
Abstract
The fatigue performance from pre-corroded pits was studied in laser-shock-peened AA7075-T651 with and without a protective ablation-layer. Surface and microstructural characterisation showed laser-shock-peening generated residual stresses up to −400MPa, limited hardness and moderate surface roughness increase. The laser-shock-peened specimens were exposed to 3.5 wt-% sodium chloride solution for different levels of galvanostatic control. The compressive residual stresses did not significantly affect corrosion behaviour, or corrosion pit morphology. Laser-shock-peening-induced surface roughness had the most detrimental impact on corrosion performance. Fatigue testing of pre-corroded AA7075-T651 showed pits act as stress concentrations. Cracks initiated shortly after dynamic loading, reducing fatigue life by 50%. Laser-shock-peening increased fatigue life by 400% compared to corroded-untreated AA7075-T651, due to residual stresses effectively counteracting stress concentrations produced by pits.
Pre-corroded laser-peened (LSP and LSPwC) AA7075-T651 fatigue performance is investigated. XRD and incremental hole drilling show deeper compressive residual stresses for LSPwC compared to LSP. Electrochemical tests show no significant changes in corrosion behaviour after laser peening. Fatigue testing and fractography show compressive residual stresses effectively counteract stress concentrations at pits.
Keywords
Introduction
Laser shock peening, commonly referred to as LSP, is a mechanical surface treatment similar to shot peening, that imparts beneficial compressive residual stresses to a metallic surface up to a depth of several millimetres. It can also cause grain refinement, generation of high-density dislocations, and small amounts of twinning [1,2]. Laser shock peening uses high-power laser pulses to ionise the surface, forming a plasma that is confined within a transparent inertial confinement medium (typically water). The confined plasma generates high pressure (of the order of GPa), transmitting shock waves into the metal surface, producing a constrained localised surface and subsurface plastic deformation, and thus compressive residual stresses [3-5]. An ablative, sacrificial coating, either black tape or aluminium foil, is often used as a thermo-protective overlay to preserve the surface integrity of the target. Alternatively, laser peening can be performed without an ablative coating (commonly referred to as LSPwC), which was originally developed for underwater laser peening to prevent stress corrosion cracking in nuclear power plant, where access to apply an ablative coating is not possible [6]. In LSPwC a thin layer of the material's surface is ablated, generating the plasma shock wave to impart compressive residual stresses. Advantages of LSPwC versus the standard laser shock peening with ablative layer (hereinafter called LSP) are the ability to employ compact and commercially available lasers, deliver laser pulses through flexible optical fibre, ability to irradiate laser pulses to water-immersed objects and a reduction in peening-processing time [6].
The aerospace industry is using laser shock peening more extensively, and in some instances in preference to shot peening. Indeed, laser shock peening is seen as a promising method for improving fatigue life of aerospace aluminium components [3]. There are several benefits to choosing laser shock peening over shot peening, including greater accuracy and precision [3,7,8], greater depth and magnitude of the subsurface compressive residual stresses [3,7,9,10]; beneficial decrease in detrimental surface modification; and fatigue life improvements [3,11].
Laser-peening effectiveness on fatigue life depends on the combination of laser parameters chosen in terms of the level of compressive residual stresses [12-14,8,11,15-17], the surface roughness [11,18-20] and the surface hardness [9-11,19,21-23]. Key laser-peening parameters can also change the effectiveness of the treatment on fatigue performance in treated 2XXX alloys [12-14] and 7XXX alloys [16,7,11,20]. Recently, Sanchez et al. [24] reported an LSP treatment on AA7075-T651 that maximised residual stresses, whilst minimising surface roughness. The LSP altered the fatigue crack initiation mechanism, and significantly delayed both initiation and propagation. However, the LSP-generated small pits, up to 12 µm in diameter, which have been previously attributed to localised air compression under the laser shockwave [25,26]. The Sanchez et al. [24] study found in most instances the crack initiation mechanism and fatigue life extension were affected by the presence of the pits induced by the LSP treatment, which act as stress raisers and markedly lowered fatigue crack initiation time. Since these small LSP mechanical pits can hinder fatigue performance, and considering the susceptibility and exposure of aluminium alloys to corrosive environments in the aerospace industry [27], it raises the question of how corrosion pits may develop and affect fatigue performance in a laser-peened material (with and without coating). Specifically, how do LSP (or LSPwC) residual stresses and the modified surface affect electrochemical behaviour; how does laser shock peening promote or diminish corrosion pit formation, and how do fatigue cracks initiate and propagate from pre-existing corrosion features within a peening-induced residual stress field.
It has been established that compressive residual stresses are beneficial in retarding corrosion phenomena that require mechanical stimuli, such as stress corrosion cracking [28-35] and corrosion fatigue [28,36-40]. Specifically, for LSPwC, studies report compressive residual stresses can improve corrosion performance. For example, studies on an LSP aerospace alloy [41,42] and aluminium–silicon alloys [22] show improvement in pit numbers and size after laser peening, and a decrease in corrosion current density, and show how increased power density will increase surface roughness, in most cases promoting higher corrosion current density. In the case of AA7075, one study [43] shows a small (50 mV) ennoblement in open-circuit potential after shot peening. Another study reported a more varied performance: LSPwC AA7075-T651 had a slight increase in corrosion current density but a decrease in number of pits compared to the baseline [36]. Whilst these studies clearly show LSPwC-induced roughness to be detrimental to corrosion performance, the link between LSPwC-generated compressive residual stresses and oxide-formation, on corrosion performance improvement, is more tenuous.
In this study, the effects of LSP (ablative laser peening) and LSPwC (non-ablative) treatments on the corrosion performance and fatigue performance of corroded AA7075-T651 are investigated. The objectives are to understand to what extent the laser-shock-peening-generated residual stresses and the modified surface (microstructure, hardness and roughness) influence the AA7075-T651 electrochemical properties and corrosion performance. Additionally, to understand if the formation of corrosion pits is hindered or encouraged by LSP, or LSPwC, treatment. Finally, to investigate how pre-corroded pit features can affect the fatigue performance, and crack initiation mechanisms, previously seen for laser-shock-peened AA7075-T651 [24].
Methodology
Materials and LSP surface treatment
The test material was sourced from an AA7075-T651 (UNS A97075) plate, with mechanical properties: a tensile strength of 572 MPa, yield strength of 503 MPa, approximate hardness of HV175 and fracture toughness of 20–29 MPa√m depending on the microstructural plane loaded [44]. The major alloying elements are zinc, magnesium and copper. The T651 temper condition indicates solution heat treatment, artificial ageing and stretching (to relieve internal residual stresses). All test samples were sectioned from the AA7075-T651 plate, with the top surface (the surface tested) in the L-LT plane (see Figure 1). Three surface conditions were tested: untreated AA7075 (baseline), LSP (laser shock peening with ablative layer) and LSPwC (laser shock peening without ablative layer followed by a light mechanical grind to remove the oxide layer to improve fatigue life, see Section Laser-shock-peening treatment). LSP and LSPwC surface treatments were applied to two sample types: identified as A and B. Type A are fatigue bend bars with dimensions as identified in Figure 1, where the LSP-induced compressive residual stresses are considered to remain intact when subsequently tested. Type B are small bars (5 mm × 5 mm × 35 mm) machined from a large laser-peened block, as shown in Figure 1. It is well-known that removing a volume from a region containing residual stresses will relieve these stresses within the discrete section, and the smaller the sample removed from the original laser-peened material the greater the stress relief [45]. Thus, Type B are assumed to have negligible residual stress.
Sample manufacturing steps (Type A and B).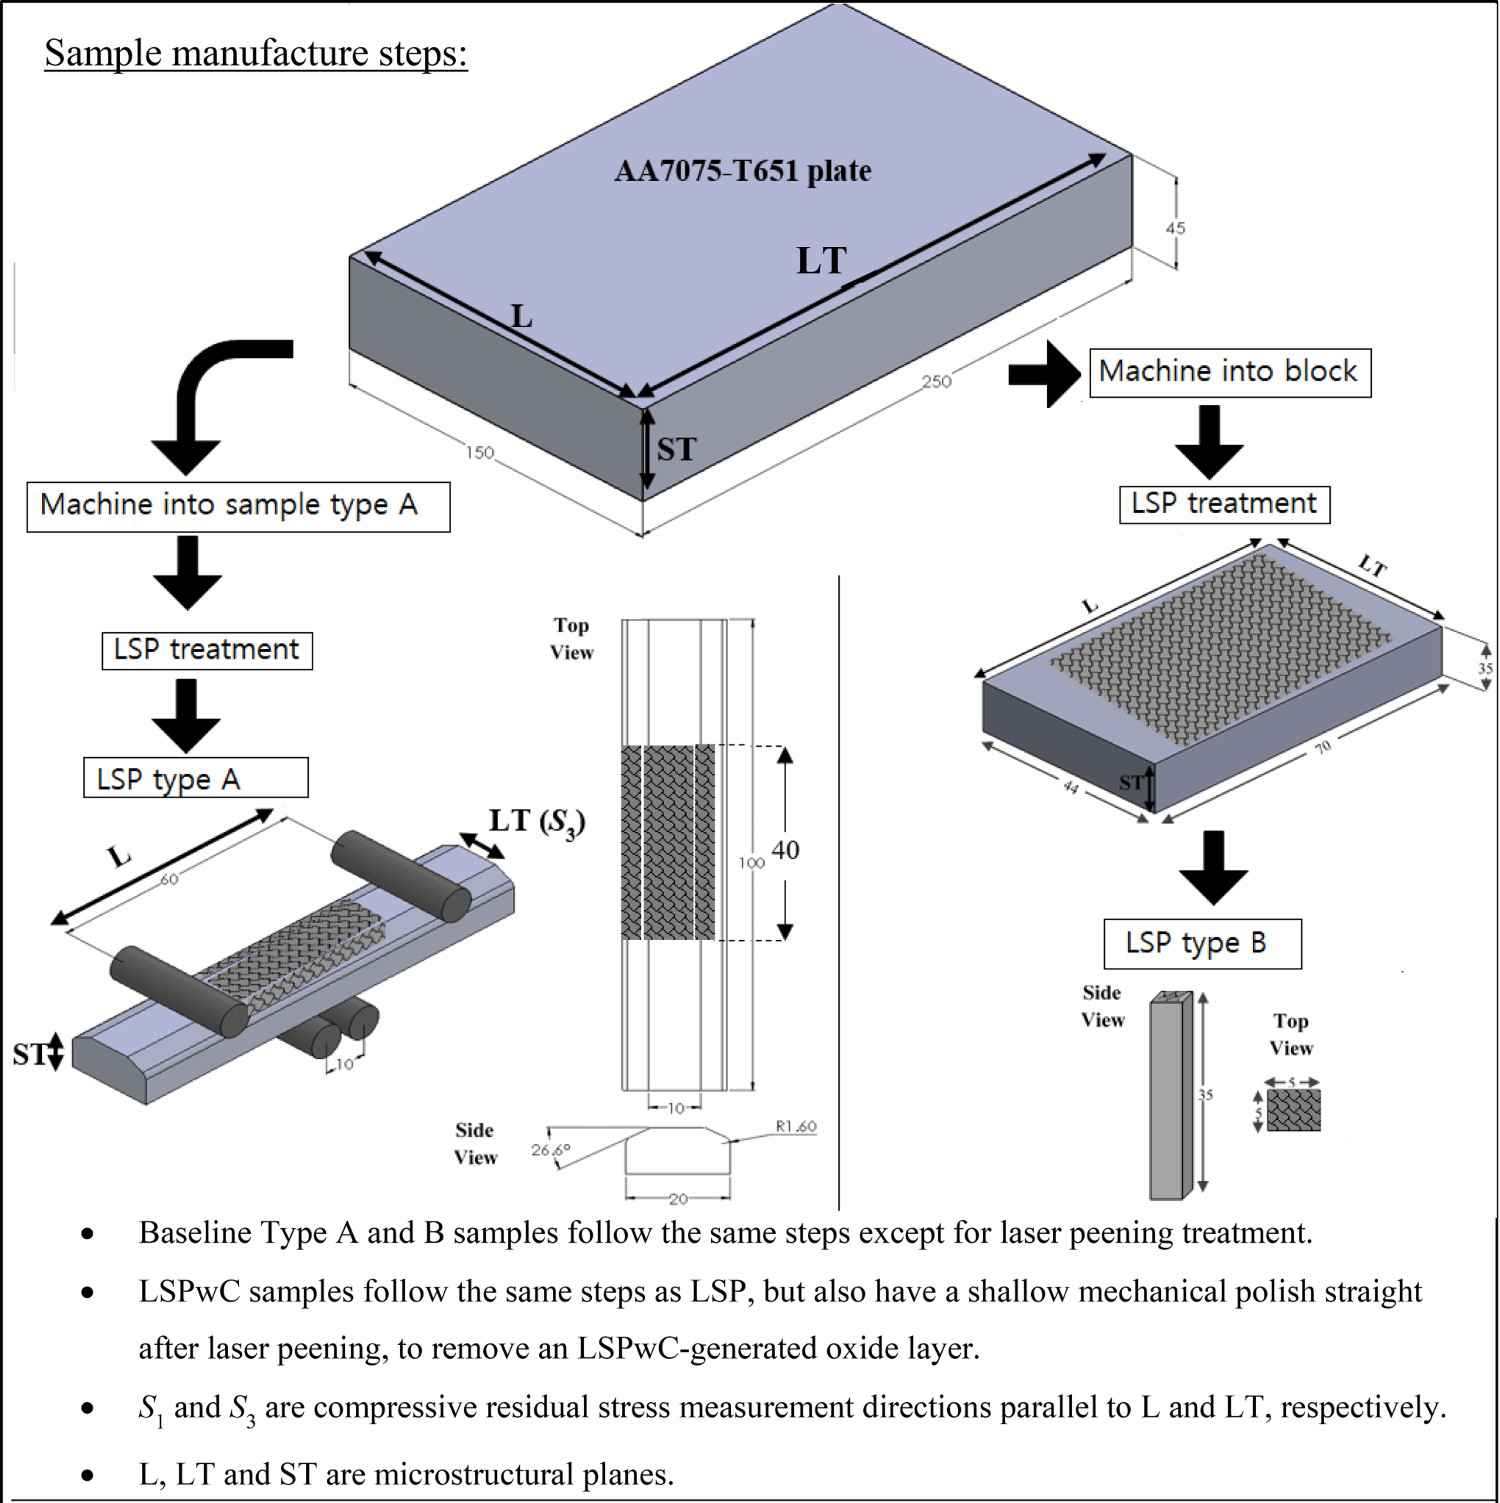
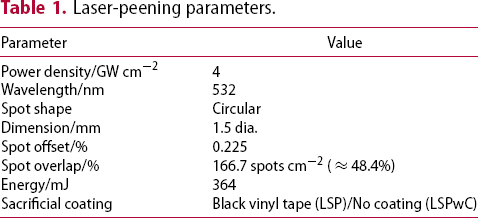
Laser-shock-peening treatment
Laser-peening parameters.
Surface and microstructural characterisation
A Talysurf contact profilometer with a vertical resolution of 4 nm was used to measure roughness testing (ISO4287 standard). Micro-hardness measurements used an FM-300 Microhardness Tester machine, with a 0.5 kg-f load and 30 s hold time. Eight to 15 readings were taken from each test sample. An Alicona InfiniteFocus™ focus variation microscope, at ×20 magnification and 150 nm vertical resolution, was used to assess the surface. A JEOL JSM-6500F scanning electron microscope (SEM) for secondary electron imaging (SEI) and backscatter electron imaging (BEI), including energy-dispersive X-ray spectroscopy (EDS) was used to qualitatively identify second-phase intermetallics. Electron backscatter diffraction (EBSD) was used to analyse microstructures after laser shock peening. The voltages used for SEI imaging, BEI imaging and EDS, and EBSD were 10, 15 and 20 keV, respectively. The EBSD samples were mechanically polished to a 3 µm surface finish with diamond suspension followed by electropolishing (2:1 methanol and nitric acid, 25–30 V, 25–35°C, 2–5 s). EBSD data was imported into Matlab R2018a and re-analysed using MTEX algorithm [47] to create a map of kernel average misorientation (KAM) versus distance from the LSP and LSPwC surfaces. For more information on EBSD method details see Sanchez et al. [24].
Residual stress analysis
X-ray Diffraction (XRD) and incremental centre hole drilling were used in a complementary manner, to assess the residual stresses present in the LSP and LSPwC samples at and below the surface [48]. The XRD measurements were made with a Stresstech Xstress diffractometer located on an articulated robotic arm, utilising the d-sin2 ψ technique to determine the stress. A chromium X-ray source was used with a 1 mm diameter collimator and counting time of 20 s at each of the 14 tilt locations evenly spaced between −45/45°. The 0° and 90° measurement angles were aligned with the longitudinal (S1) and transverse (S3) directions of the samples (see Figure 1).
The incremental hole-drilling measurements were made with a Stresscraft three-axis drilling device. Measurements were made at 23 surface-biased (smaller increments near the surface) incremental depths using an orbital drilling motion. The measurements were taken in the centre of the laser-peened region on the bend bar sample. Strain readings were taken to a depth of 1.024 mm from the surface in the longitudinal (S1) and transverse (S3) directions of the samples (see Figure 1). Further details of the XRD and hole-drilling methodology are given in Sanchez et al. [24].
Corrosion testing
To characterise the electrochemical properties of the AA7075-T651 laser-peened surface the remaining sample surface was masked using a mixture of beeswax and colophony resin (3:1 ratio), leaving only 25 mm2 unmasked. All electrochemical tests were performed at ambient temperature and atmospheric conditions. After corrosion exposure, the samples were ultrasonically cleaned in ethanol (45 min at 50°C) to remove soluble corrosion products.
Electrochemical measurements were carried out in a Faraday cage, in a single compartment three-electrode cell with a silver/silver chloride (Ag/AgCl) reference electrode, a graphite counter electrode, and a 3.5 wt-% NaCl test solution. A VMP3 Biologic VSP multi-channel potentiostat and EC-Lab v11.10 software were used to perform the tests and interpret data.
The electrochemical tests are 30 min and 24 h open-circuit potential. Additionally, a small number of samples were exposed to 72 h OCP for subsequent microscopy analysis of corrosion feature initiation mechanisms. Other electrochemical tests performed were potentiodynamic polarisation (−0.250 V < Ecorr < + 0.350 V with a 0.2 mV s−1 sweep rate), and galvanostatic control (2 mA cm−2 for 2 h and 0.157 mA cm−2 for 24 h, high and low galvanostatic control, respectively). The two galvanostatic exposures aim to capture corrosion behaviour at two different regimes. The total charge was the same for both low and high galvanostatic control (144 C). An Alicona™ variable focus microscope was used to study the surface topography after corrosion testing. Images of a corroded area were assessed using Fiji image software [49], where the following steps are followed to quantify the pit features: rotate, crop, colour threshold, eight-bit image, threshold and analyse particles. Also, Origin(pro) 2020 was used to evaluate corrosion pit area fractions (the sum of all corroded surfaces over the measurement area) and pit density (pits per mm2).
Fatigue testing
Condition of fatigue test samples.
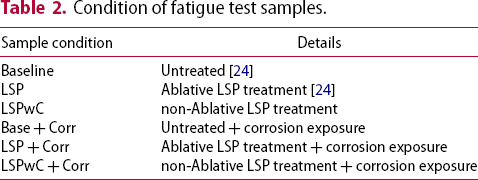
Prior to fatigue testing, all corroded baseline and laser-peened samples were exposed to the high galvanostatic control (2 mA cm−2 for 2 h) to generate corrosion features at ambient conditions. After corrosion exposure, the samples were ultrasonically cleaned in ethanol (45 min at 50°C) to remove soluble corrosion products. All pits bigger than 10 µm are assumed to be corrosion-generated (not laser-peening-generated mechanical pits) and are characterised as such.
Two methods were used for crack propagation capture: (i) the replica method for baseline samples only; and (ii) the beach marking method for all laser-peened and corroded samples. The replica method consists of using ready-made replica material Struers F5. Cracks were measured and used to calculate sample's crack growth rate da/dN as a function of stress intensity factor (ΔK).
For laser-peened samples and all corroded samples, the replica method was not effective in monitoring crack behaviour due to subsurface crack initiation and growth. In this case, the beach marking method was used. Instron wave matrix was used to set up a regime where the load ratio was varied from R = 0.1 to R = 0.5. The variation in load ratio was performed by increasing the minimum load, keeping the maximum load, and therefore Kmax, constant during the whole test. The number of cycles for each load ratio was chosen based on expected total life and experimental trial. For the ‘R = 0.1 to R = 0.5’ tests, fatigue life is presented as an estimate with error bars. The estimated life (NTotal) is equal to the cycles under ‘R = 0.1’ (NR=0.1) plus a third of the cycles under ‘R = 0.5’ (NR=0.5).
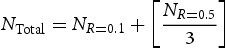
This is based on the Walker equation for AA7075-T651 by Dowling et al. [50], and a set of AA7075-T651 uniaxial data [51], to estimate fatigue life for different load ratios. Error bars are also presented to show the minimum fatigue life (NR=0.1) and the maximum fatigue life (NR=0.1 + NR=0.5) [24].
Optical microscopy and scanning electron microscopy were used to analyse fracture surfaces of fatigue samples, for both baseline, LSP and LSPwC samples. SEM microscopy (10–15 keV), Fiji image processing [49], and fatigue data (number of cycles and load ratio) are used to measure crack size and calculate crack growth versus ΔK.
Results
Material characterisation
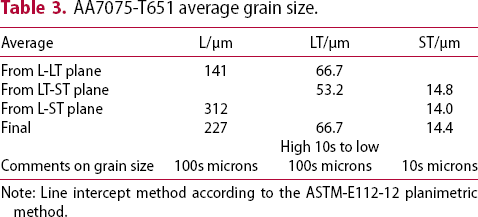
Figure 2 shows a three-dimensional representation of the AA7075-T651 microstructure. The microstructural planes are L-LT, L-ST and LT-ST. The L direction is orientated along the rolling direction, which results in grains that are anisotropic and characteristically elongated in shape. The dark features (between 1 and 10 µm in size) are coarse intermetallics. SEM-EDS suggest these are mostly Al7Cu2Fe and Al23Fe4Cu, and occasionally Mg2Si. Line intercept measurements according to the ASTM-E112-12 planimetric method give an average of 227 µm × 67 µm × 14 µm for the L, LT and ST directions, respectively (Table 3).
(a) Three-dimensional representation of AA7075-T651 microstructural planes and (b) intermetallic distribution from SEM-EDS random sampling. AA7075-T651 average grain size. Note: Line intercept method according to the ASTM-E112-12 planimetric method.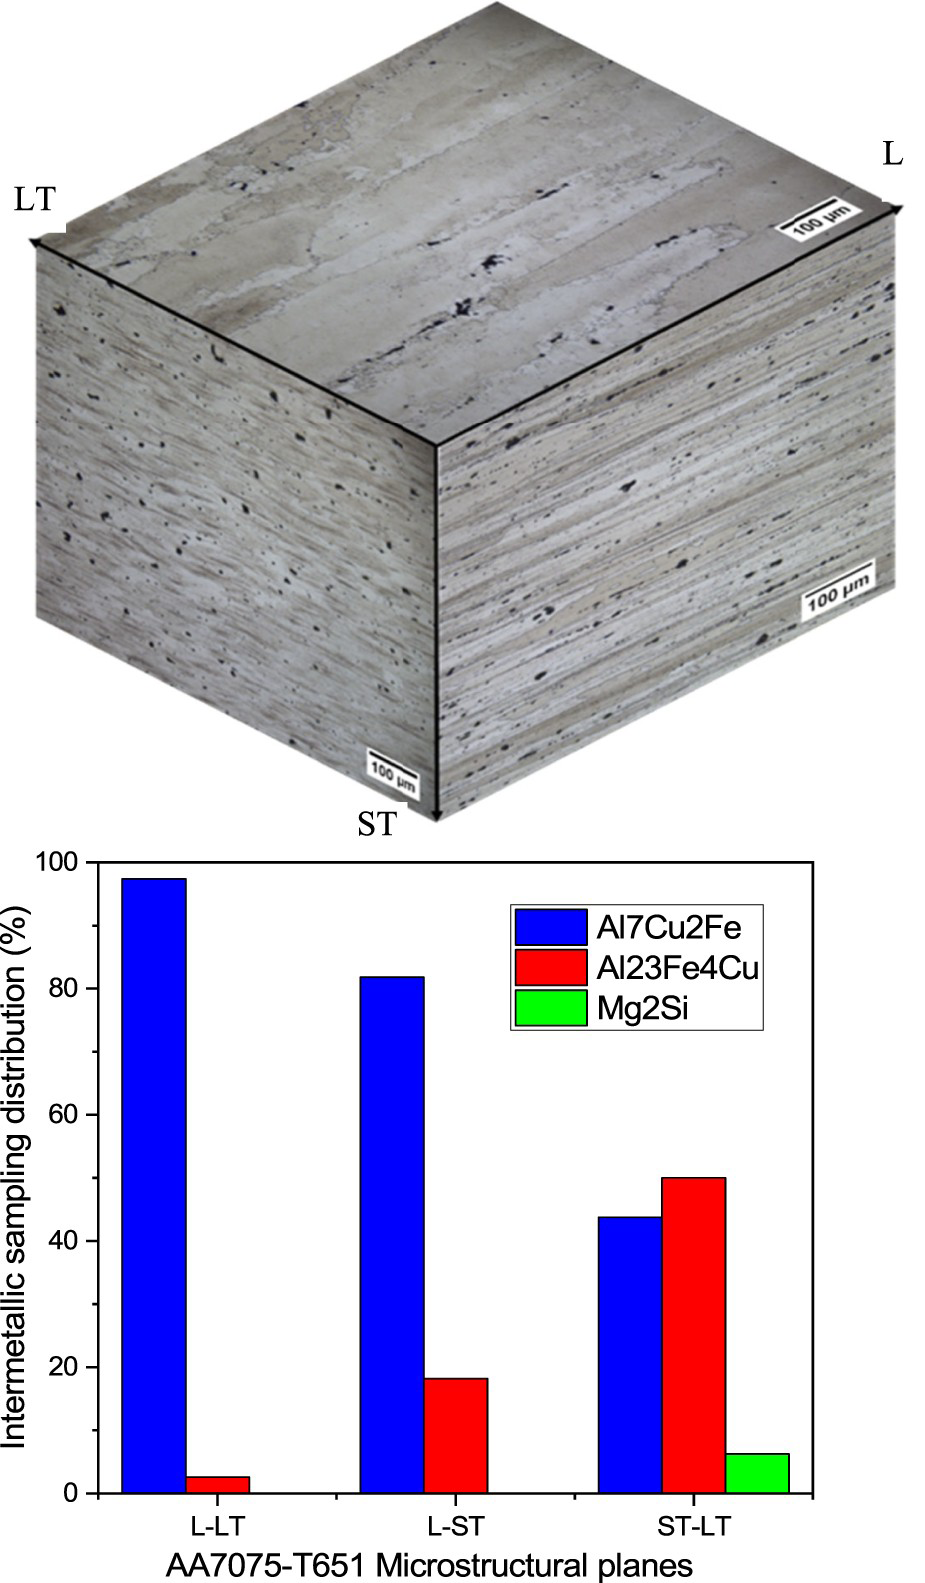
Residual stress
The LSP centre hole-drilling data in Figure 3 shows that longitudinal (S1) and transverse direction (S3) compressive residual stresses achieved a maximum of approximately −400 MPa subsurface. XRD measurements show surface residual stress of up to −330 MPa. From a maximum of −400 MPa the residual stresses progressively decrease to −50 MPa, at 1 mm subsurface. For LSPwC, XRD measurements of residual stress before oxide layer removal give −85 MPa. After oxide removal (see Section Laser-shock-peening treatment) the maximum compressive residual stress at the surface is approximately −275 MPa. The centre hole-drilling data for LSPwC in Figure 3 show compressive residual stresses of up to −405 MPa in the first 56 µm below the surface, progressively decreasing away from the surface. The measurements suggest LSPwC has higher compressive residual stresses than LSP, by up to 100 MPa in the first 800 µm, with the difference being more pronounced in the first 400 µm.
Centre hole-drilling and XRD data for LSP and LSPwC samples. S1 in the longitudinal direction, S3 in the transverse direction.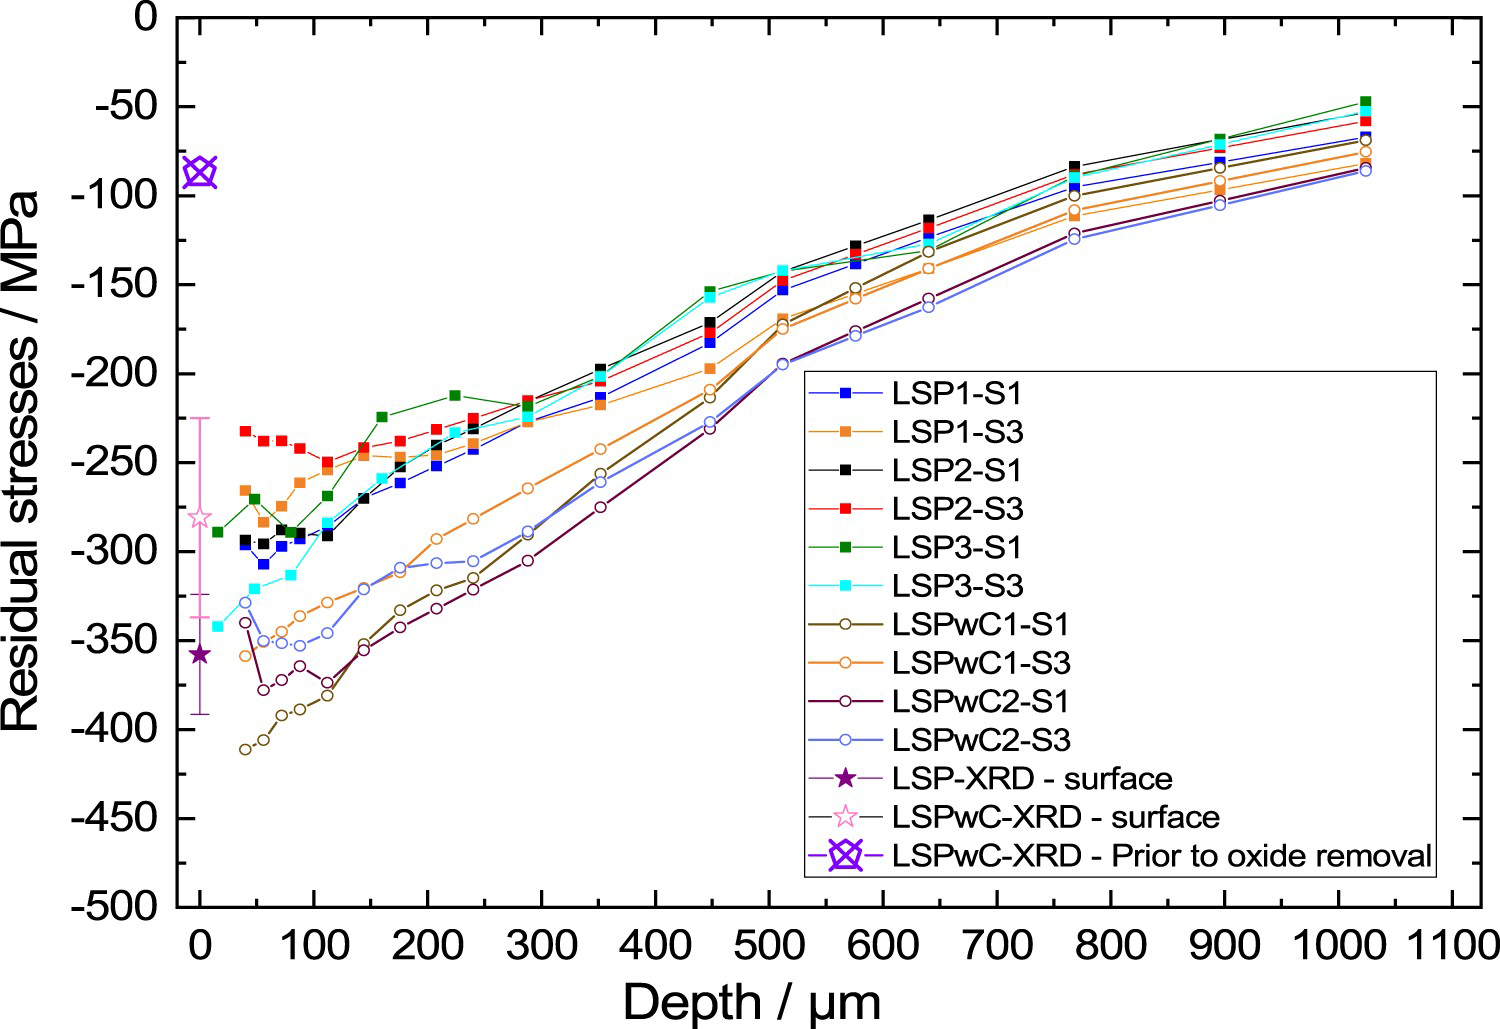
Surface and near-surface modification
According to Figure 4, the LSP Type A average micro-hardness is 188 Hv, an 11% increase compared to the baseline average hardness of 170 Hv. Average hardness for LSP Type B that is subject to residual stresses relief is 175 Hv. The LSPwC Type A and B average hardness are 176 and 171 Hv, respectively. Unlike LSP Type A and baseline, the interquartile range of LSPwC Type A is larger, thus indicating greater variability.
Vickers micro-hardness measurements of baseline, LSP and LSPwC Type A and B samples.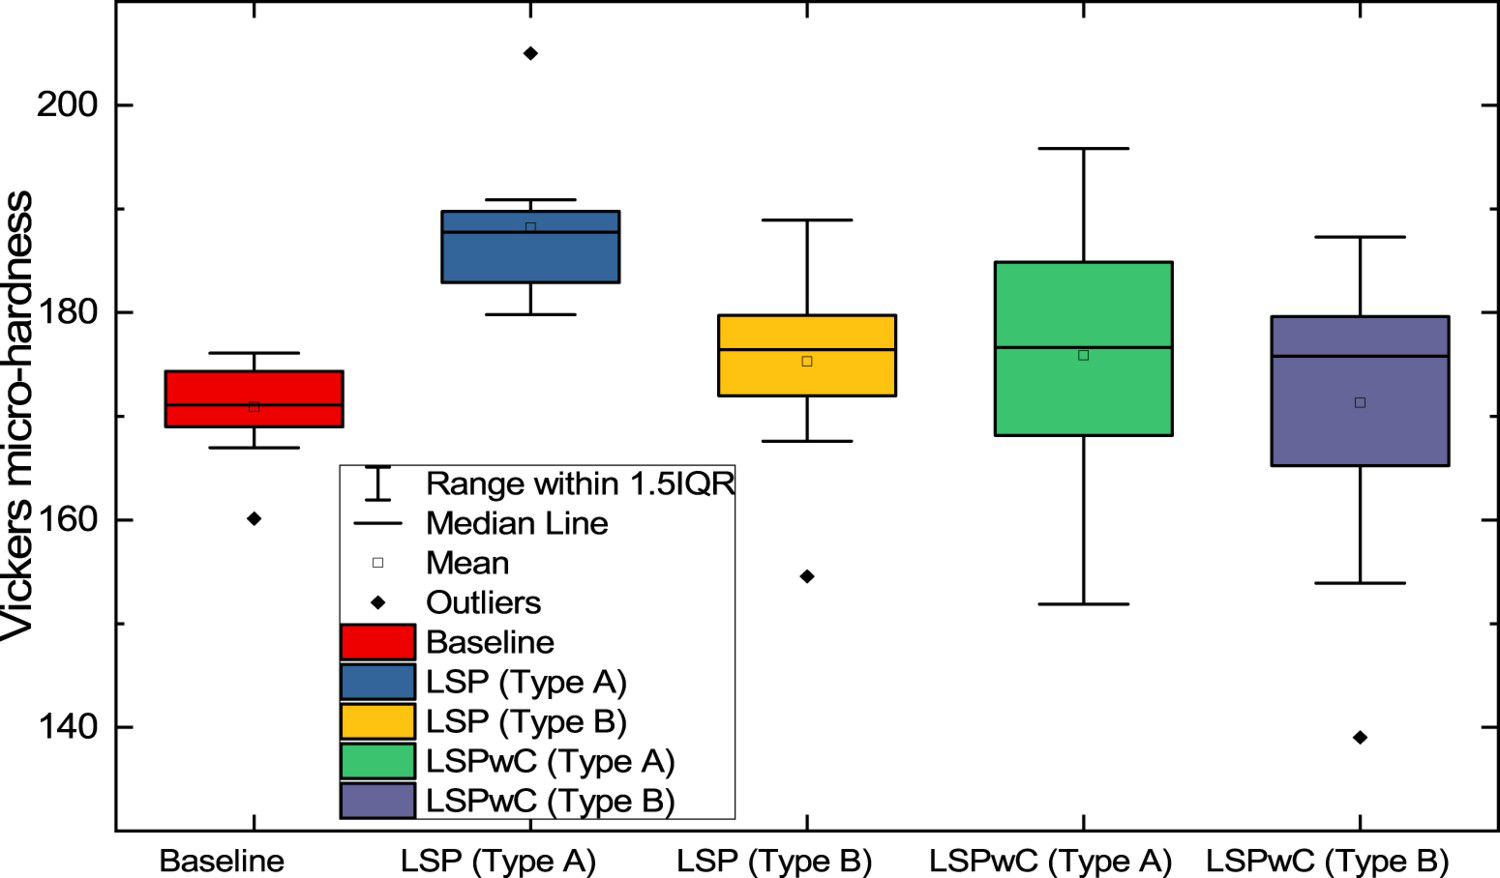
The roughness data, in Table 4, show a doubling (LSP) or tripling (LSPwC) of Rz, Rt values; and tripling (LSP) or quadrupling (LSPwC) of Ra, Rq values. There has been an increase in roughness from baseline to LSP, and even higher for LSPwC. Nevertheless, generally these values are of the same order of magnitude. However, Figure 5 shows LSPwC has a clear wavy surface profile from the laser-peening ripple features. This ripple effect is not as pronounced in LSP.
LSP and LSPwC surfaces and profiles. Average roughness measurements for baseline, LSP and LSPwC (all Type A samples).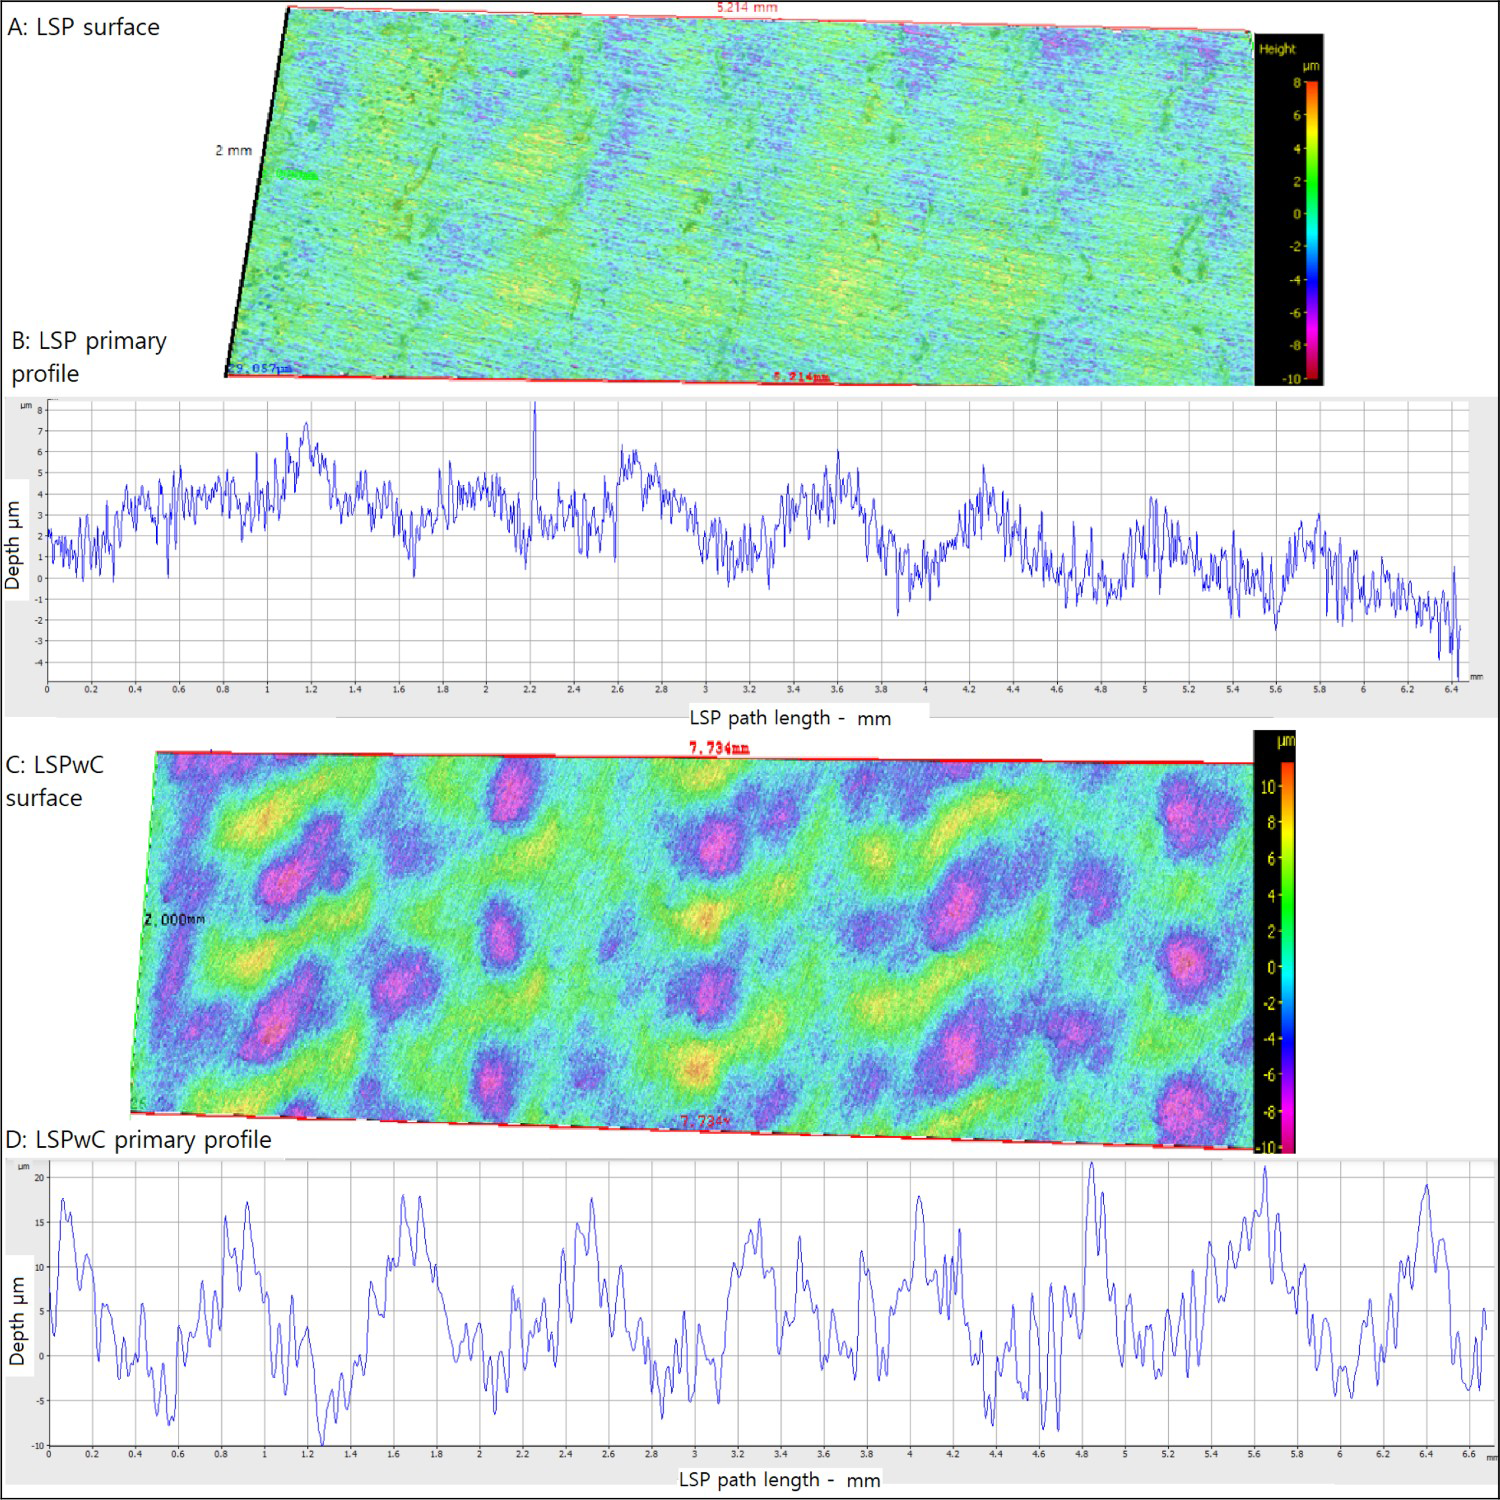
Grain microstructure analysis
EBSD was not able to capture grain data for the surface and the first 20 µm below the surface due to the limitations of EBSD indexing on highly deformed surfaces [52,53]. Thus, the expected surface and near-surface grain refinement from laser peening [1,2] could not be investigated quantitatively.
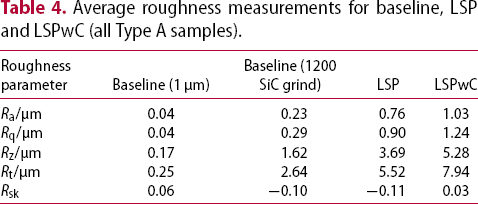
KAM data for the LSP cross-section (Figure 6) clearly show higher grain deformation near the surface (above 1.5° closest to surface), progressively decreasing away from the surface to a stable 0.5°–1°. This suggests, that as demonstrated by the EBSD recrystallization maps presented previously [24], LSP causes grain deformation, and is highest at the top surface, progressively decreasing away from the surface.
Kernel average misorientation (KAM) data, average and smooth line of LSP cross-section (LT-TS microstructural plane), distance away from surface from left to right, up to 1.15 mm subsurface. Taken from Sanchez et al. (2021).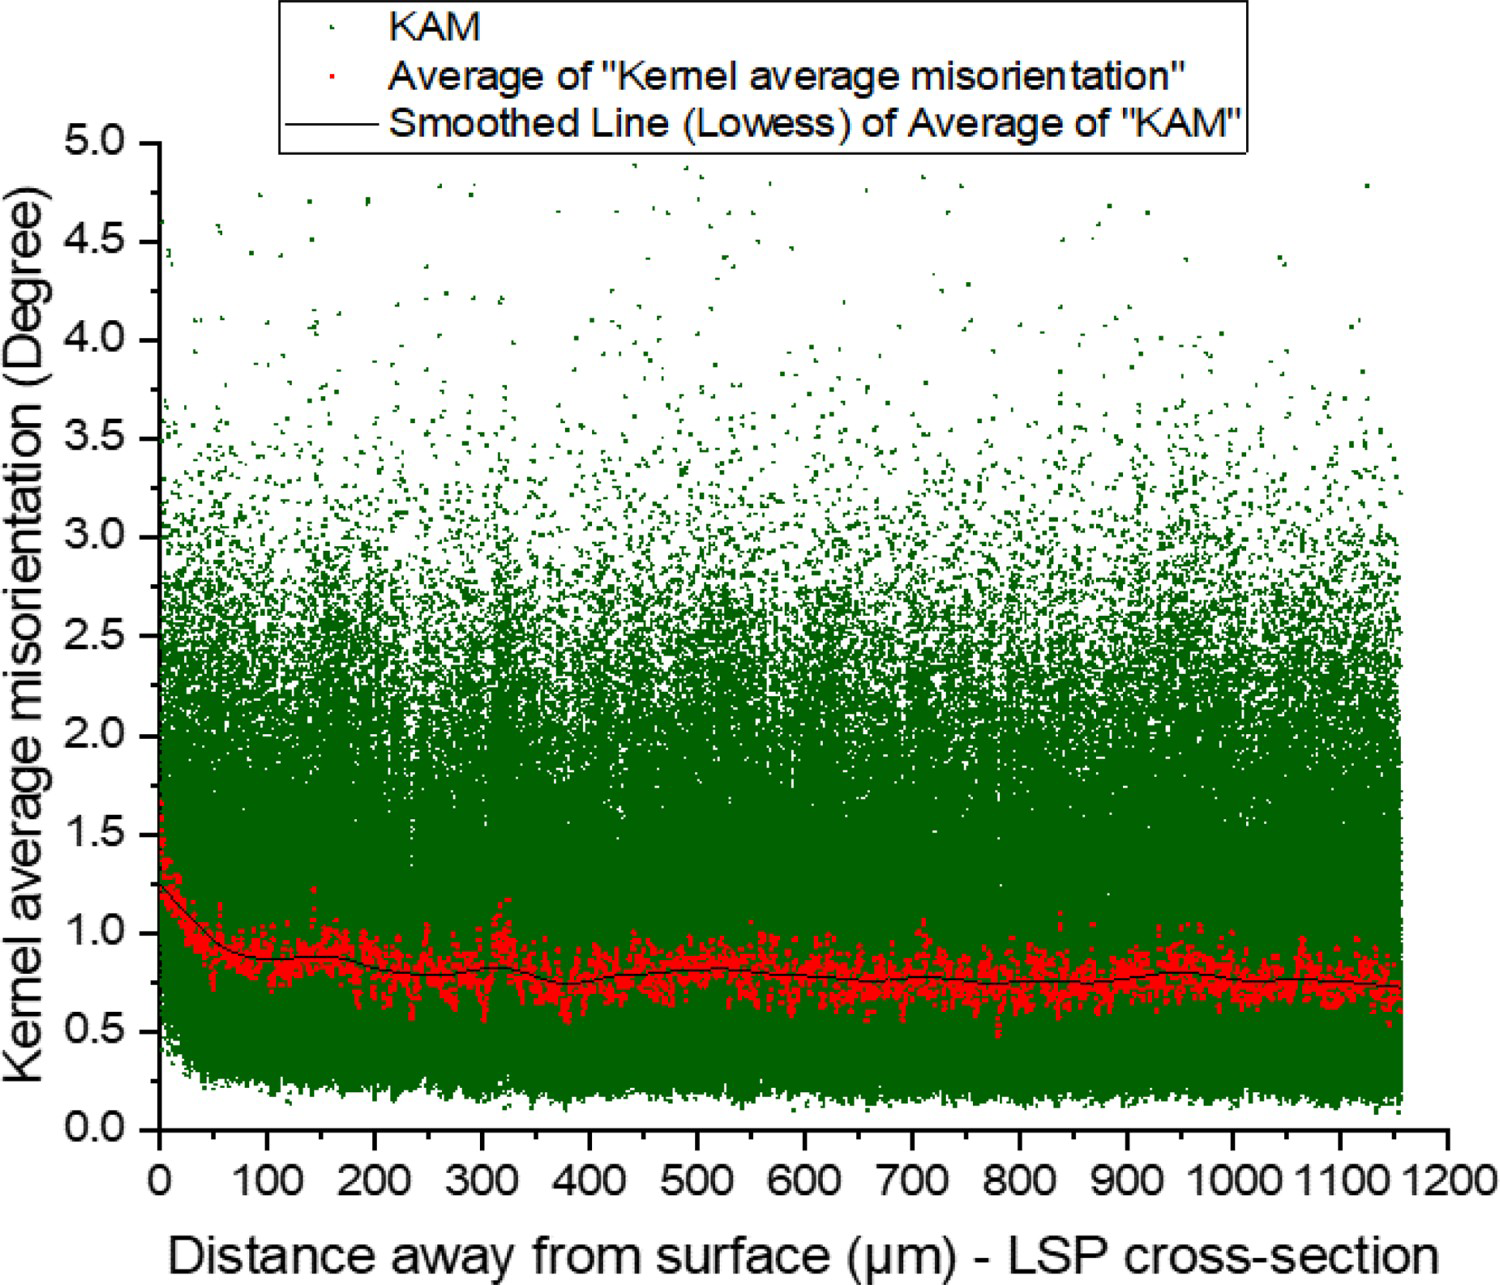
Corrosion performance
Open-circuit potential
Figure 7 shows the Open-circuit potential (OCP) measurements for the baseline, LSP and LSPwC in Type A (Figure 7(A,C)) and Type B (Figure 7(B,D)) samples. As previously noted, some (if not all) residual stress relief is expected for Type B. Initial OCP for the baseline was similar for the three replicates, between −0.730 and −0.740 V. In contrast, initially for LSP and LSPwC the corrosion potentials varied between −0.730 and −0.690 V, leading to a more transient response caused by the peened surface. Nevertheless, overall during the initial 30 min (Figure 7(A,B)) the OCPs for all surfaces were relatively similar (within 30 mV); whereas, after 24 h (Figure 7(C,D)) the OCPs for all peened surfaces tend to decrease to between −0.775 and −0.800 V, unlike the baseline which stayed relatively uniform.
Open-circuit potential 30 min (A,B) and 24 h (C,D) for untreated AA7075 (baseline), LSP and LSPwC Type A and B samples.
Potentiodynamic polarisation
Figure 8(A) shows the potentiodynamic polarisations for untreated AA7075 (baseline), LSP and LSPwC Type A and B. In terms of corrosion potential, the baseline are similar, between −0.750 and −0.735 V; whilst LSP values are generally more variable. LSP Type B are in the same range as baseline. In contrast, LSP Type A appear to have more varied free corrosion potential, and are generally nobler than the baseline, by no more than 40 mV. The anodic curves for all samples are similar, suggesting no particular difference in the anodic corrosion kinetics between baseline and LSP. Additionally, the cathodic slopes of the LSP Type B are a magnitude lower than baseline, and both LSP and LSPwC Type A. This suggests a decrease in oxygen reduction rate (ORR) for LSP samples with little to no residual stress, compared to baseline. In contrast, the ORR for LSP and LSPwC with intact residual stresses appear to have the same ORR as the baseline surface condition.
(A) Potentiodynamic polarisation of untreated AA7075 (baseline), LSP and LSPwC Type A and B. (B) High galvanostatic control (2 h) for the baseline, LSP, and LSPwC Type A and B samples. (C) Low galvanostatic control (24 h) for the baseline, LSP and LSPwC Type A.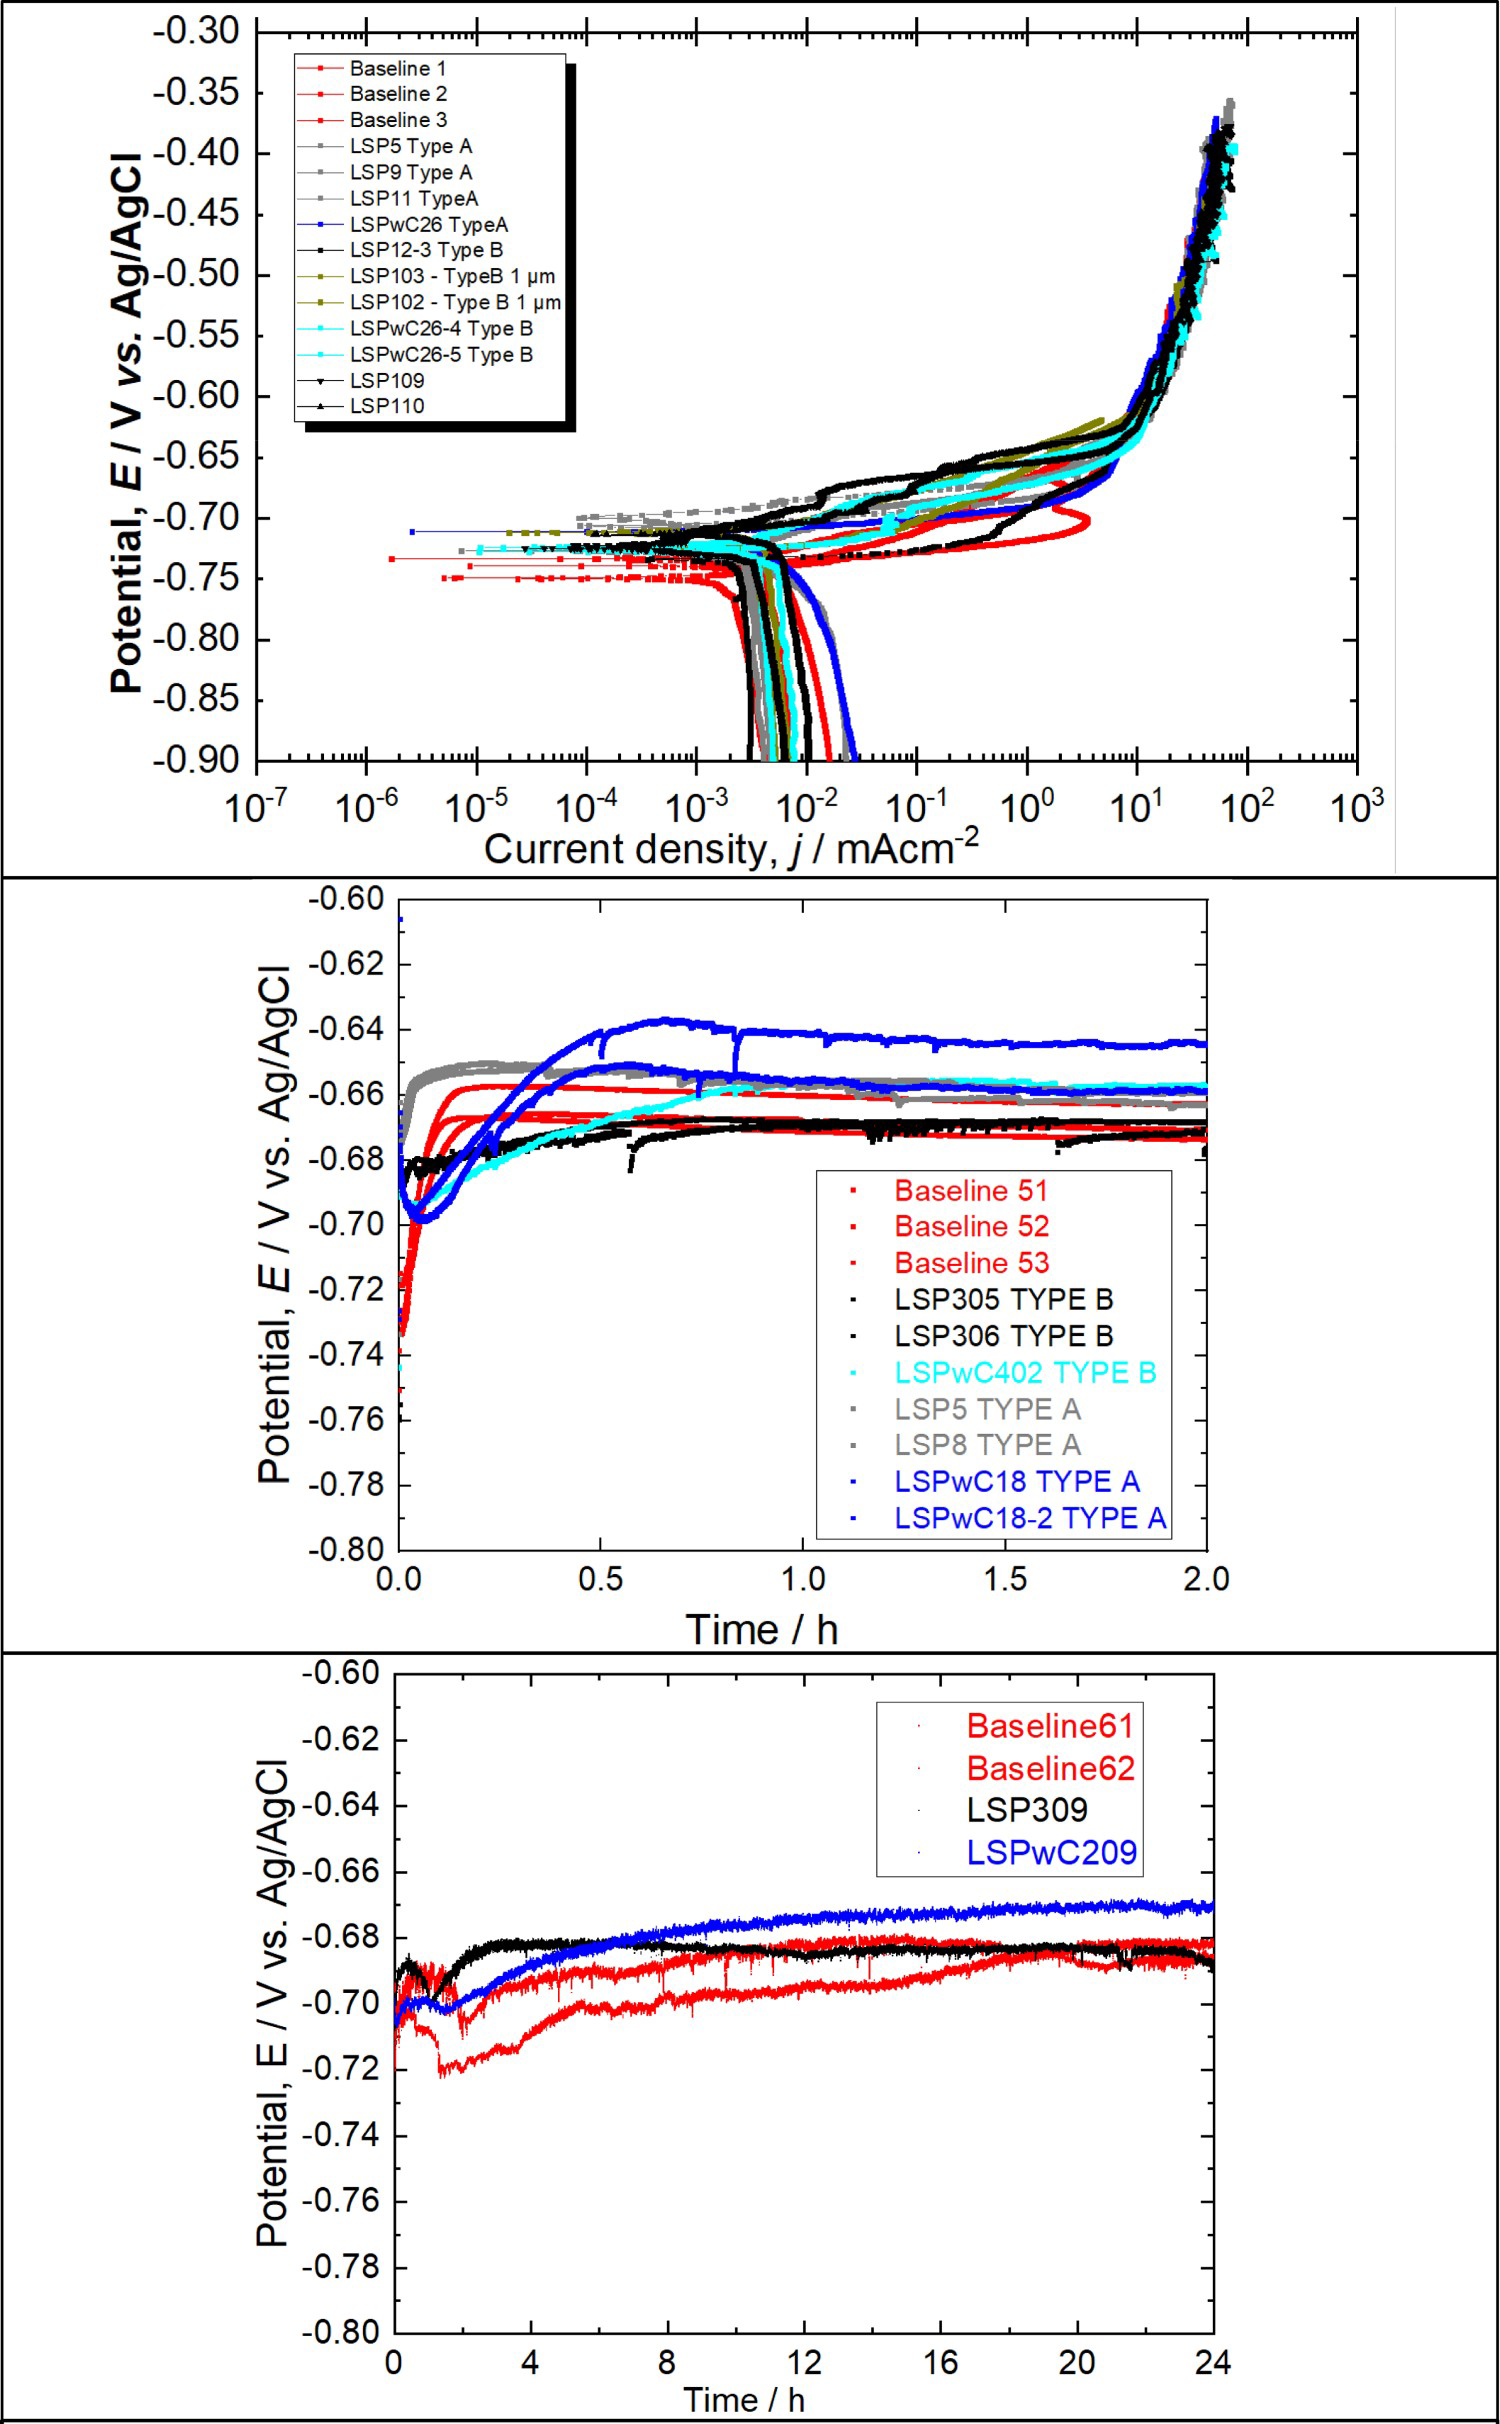
Galvanostatic control
Figure 8(B) shows untreated AA7075 (baseline), LSP and LSPwC Type A and B under high galvanostatic control (2 h at 2 mA cm−2). LSP and LSPwC are either within the baseline range or less than 50 mV from baseline. LSPwC shows a transient behaviour wherein the first 10–15 min, the potential is lower by 10–20 mV than baseline. From approximately 1 h into the galvanostatic control the potentials for all samples are within the baseline range, with some variation per sample (e.g. one LSPwC sample slightly higher by 20 mV).
Figure 8(C) shows a set of low galvanostatic control tests (all Type A), performed to view the change in potential for sample surfaces with a slower corrosion acceleration. The difference in potential values between baseline and LSP samples is less than 50 mV.
Corrosion pit characterisation
Corrosion pit initiation
Figure 9 shows typical AA7075-T651 corrosion pit initiation sites (after 72 h OCP) found on both baseline and LSP samples. In both cases trenching is evident adjacent to coarse intermetallics, due to micro-galvanic coupling between the aluminium matrix and the coarse intermetallics, particularly Al7Cu2Fe. Additionally, from microscopy observation, there is no indication of a reduction in size or population of intermetallics at the surface, suggesting laser peening has not had an effect on these particles acting as efficient local cathodes and corrosion pit initiation sites.
Pit initiation site at coarse constituent particles. Dissolution of aluminium alloy around cathodic particle due micro-galvanic coupling. Left: untreated AA7075 (baseline). Right: LSP treated. All intermetallics in these images are Al7Cu2Fe.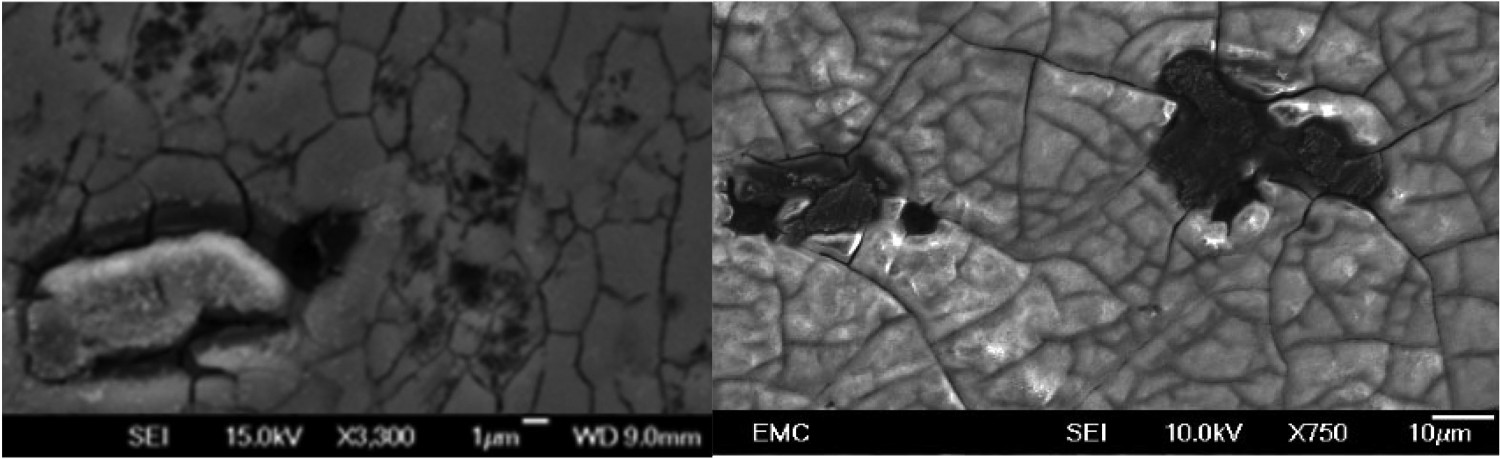
Pit topography
Figure 10 provides representative topographical maps for the baseline, LSPwC samples before and after galvanostatic control (low). It is evident for all cases there are numerous pits 10–20 µm in depth. Visual inspection suggests LSPwC has more corrosion pits than the baseline. In addition, it suggests LSPwC may have more corroded areas than baseline. This is similarly seen for LSP. It is important to note LSPwC and LSP samples already have some small pits, or depressions, present before corrosion exposure. These are assumed to be mechanical pits or generated during the laser-peening surface treatment or other surface features.
Surface profilometry of the AA7075 (baseline) and LSPwC surfaces after 24 h galvanostatic control at 0.167 mA cm−2.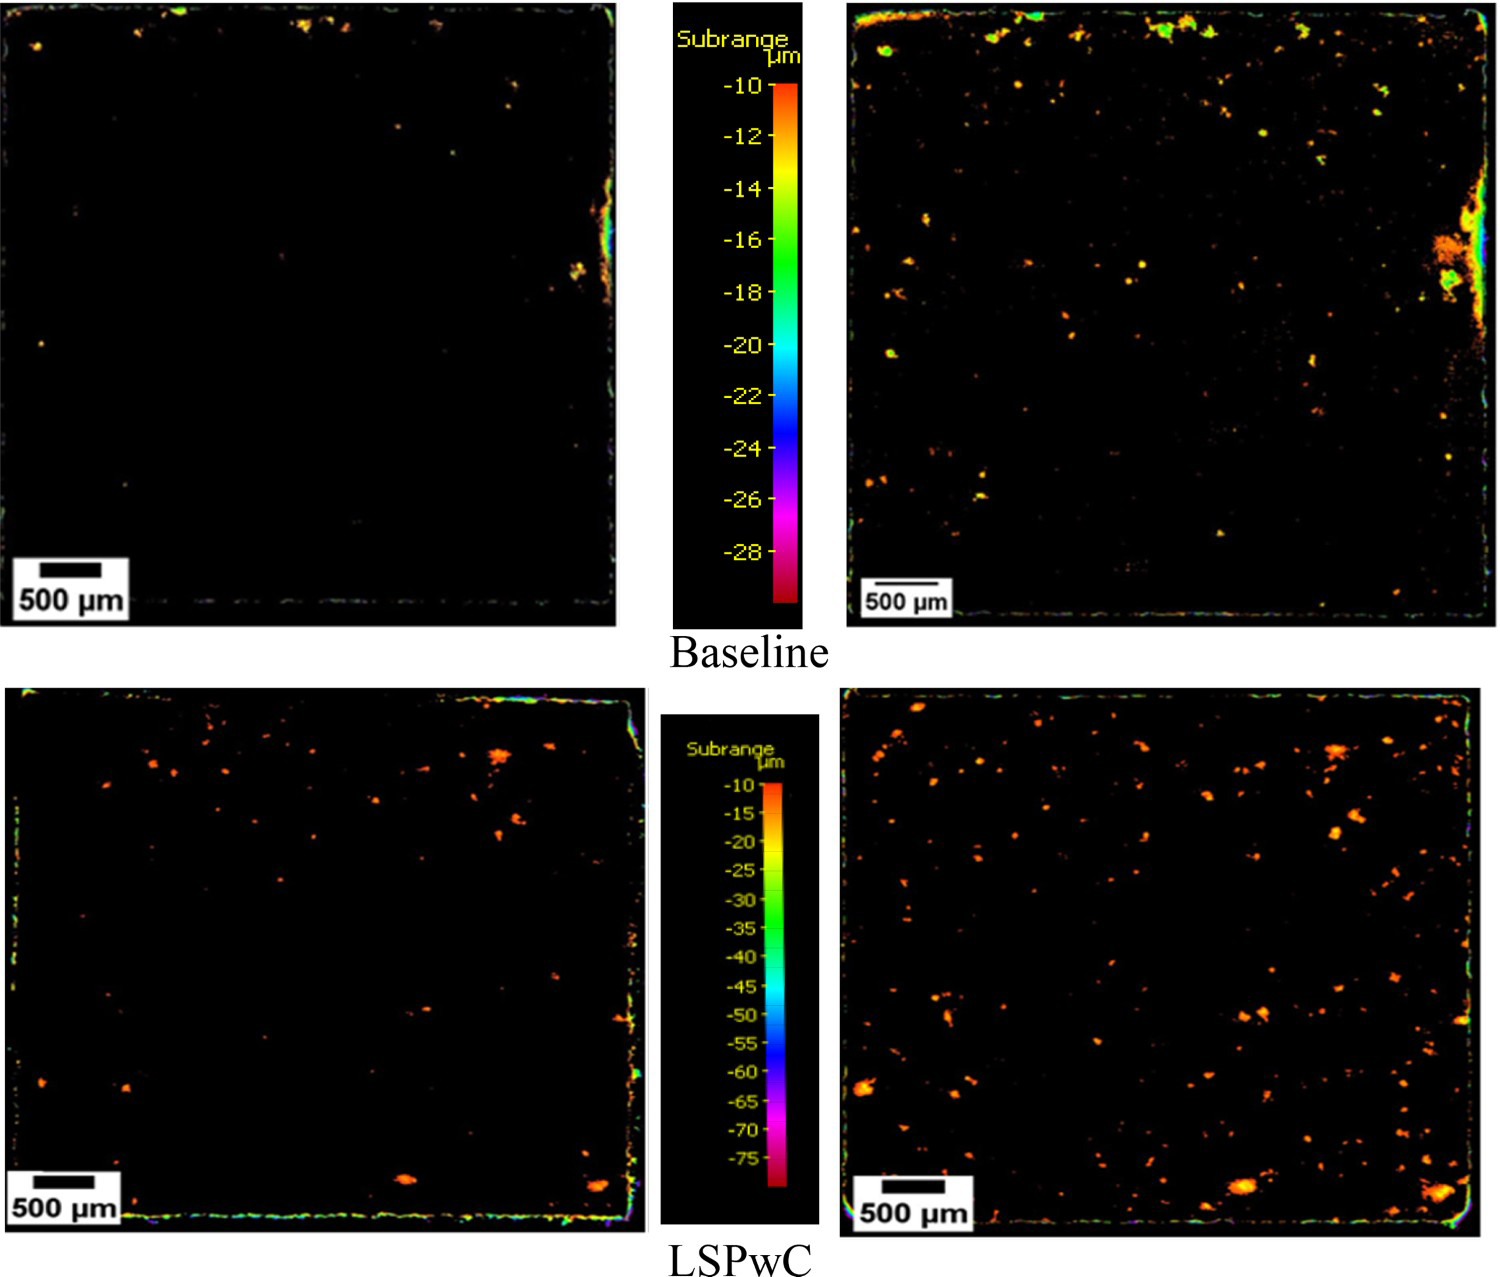
The pit density (number of pits per mm2), and the corroded area divided by the total projected area (pit area fraction) captured using the topographical images were assessed quantitatively, see Figure 11. Although there is some variation within each sample type (baseline, LSP or LSPwC), overall the LSP and LSPwC Type A show equivalent (high) or worse (low exposure) values to baseline. Type B show they are all similar to untreated AA7075 (baseline).
Pit area fraction and pit density. Areas equal or bigger than 10 µm depth are considered corroded. (A) Baseline, LSP and LSPwC Type A and B samples galvanostatic control (2 h, 2 mA cm−2). (B) Baseline, LSPwC and LSP Type A samples only (24 h, 0.167 mA cm−2).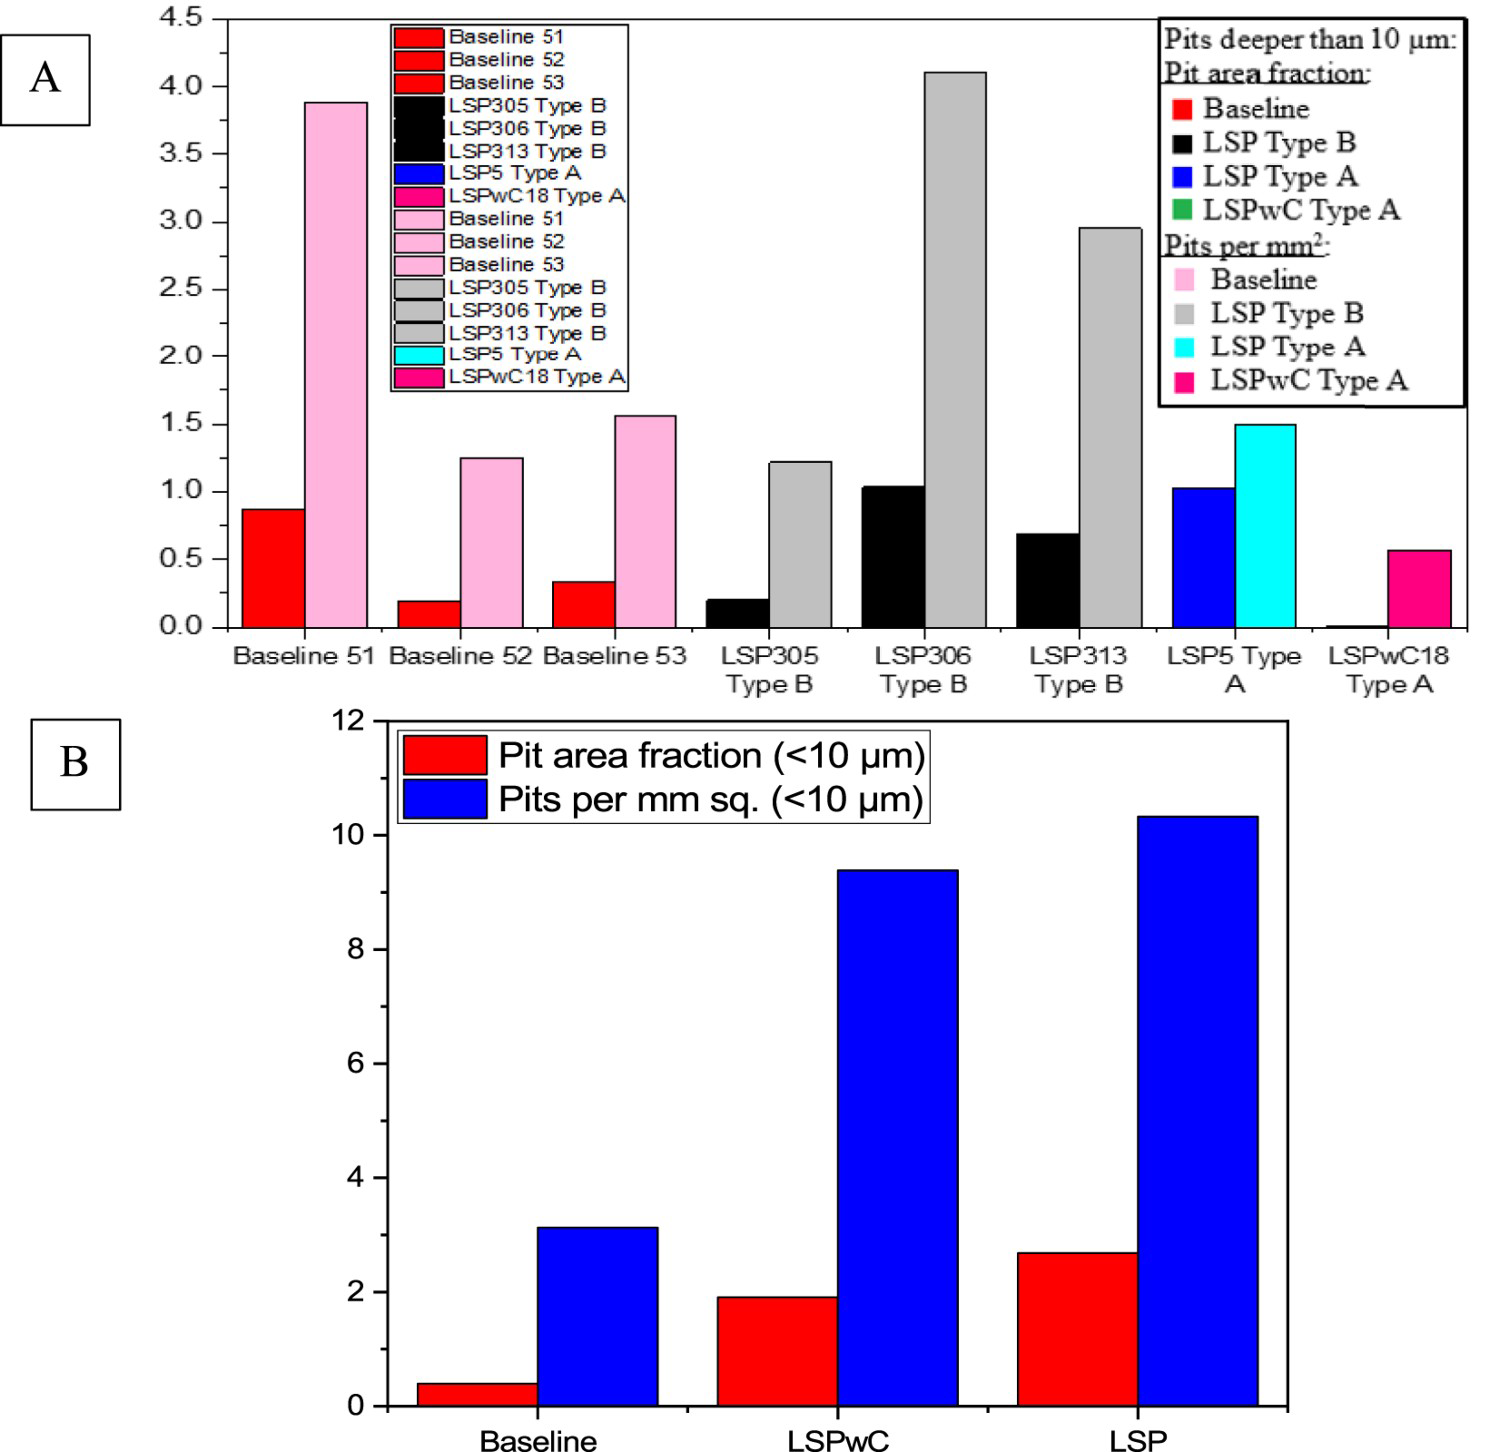
SEM imaging of corrosion pit cross-sections generated by galvanostatic control (Figure 12) show, as expected, pit depths are deeper than that assessed via topographical imaging. In all cases, irrespective of whether they are baseline or laser peened, the depth of pits is near 50 µm, despite surface topography imaging showing pits of 10–30 µm deep.
Left: Variable focus optical microscopy of pre-corroded LSP Type A sample. Right: SEM cross-section of pre-corroded pit feature in LSP sample showing true pit depth.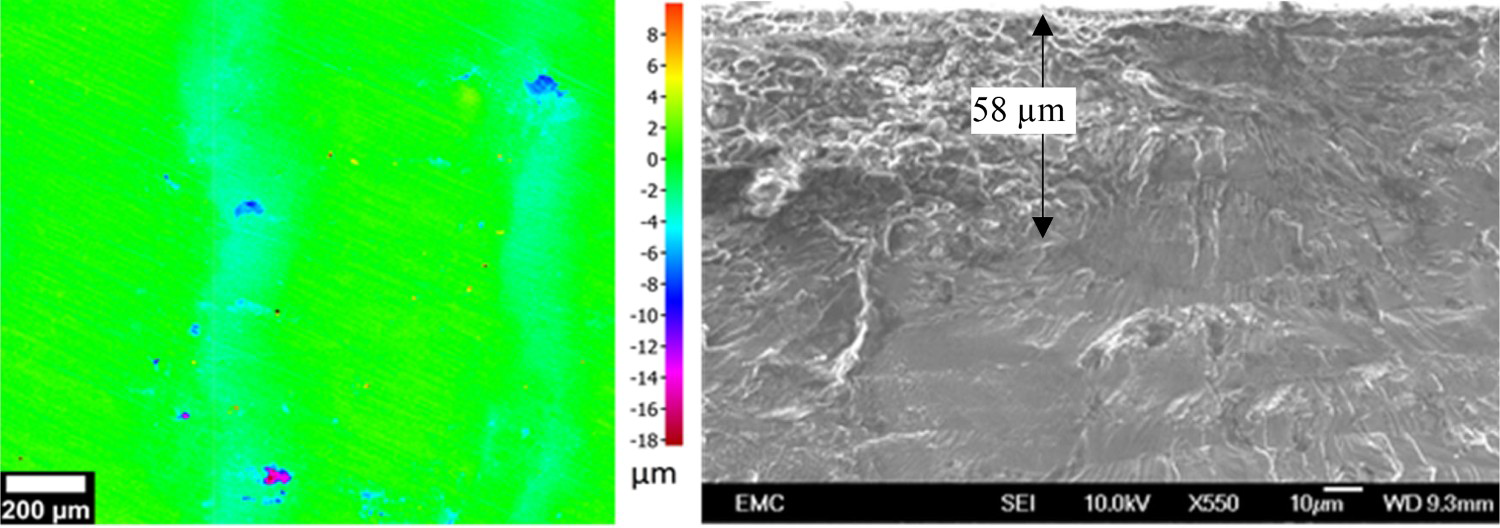
Fatigue performance of pre-corroded surfaces
Figure 13 presents a typical example of a pre-corroded Type A sample before and after fatigue testing. According to the topographical examination, fatigue cracks do not necessarily initiate at the biggest or deepest pit. This is the case for AA7075 (baseline), LSP and LSPwC samples.
Variable focus optical microscopy of pre-corroded Type A sample before (left) and after (right) fatigue. Approximate fracture line is drawn in red.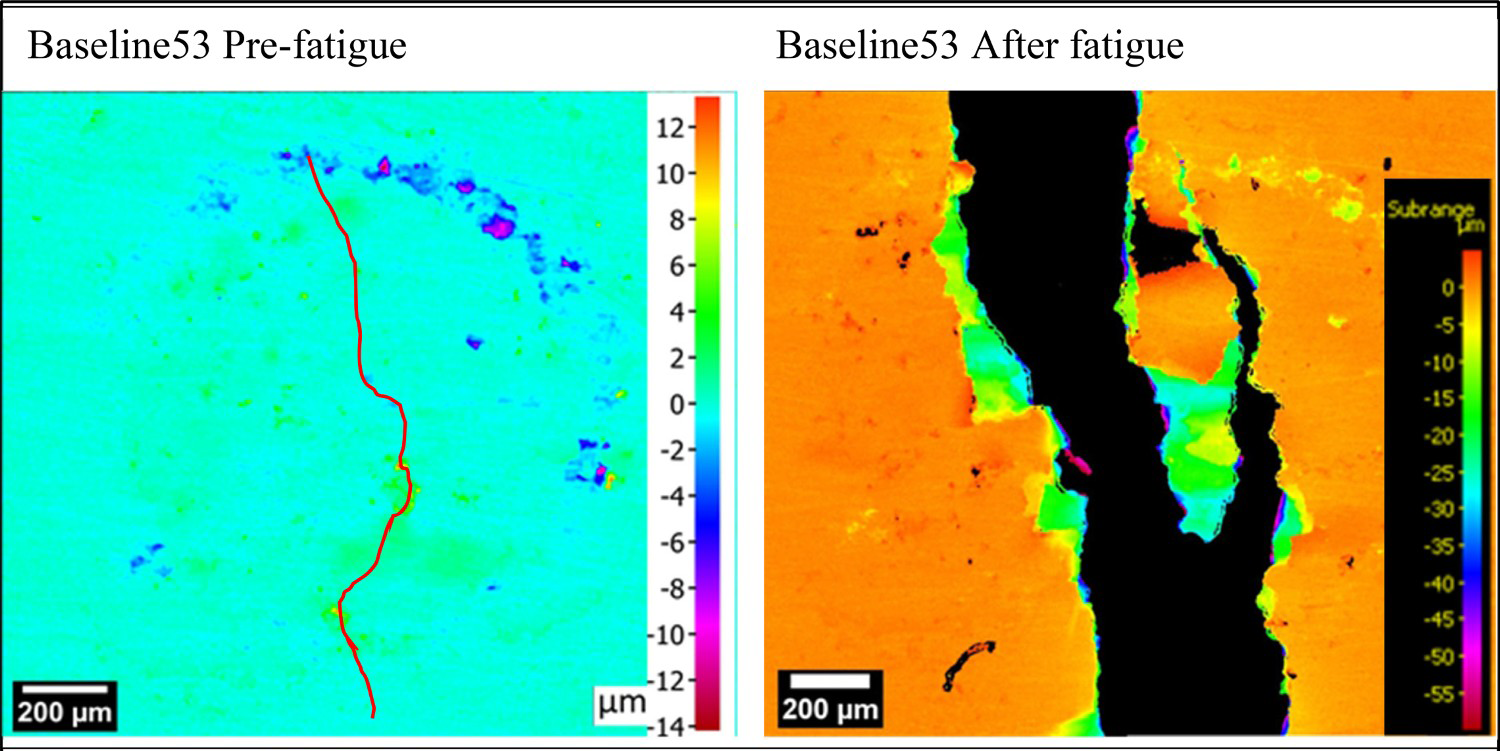
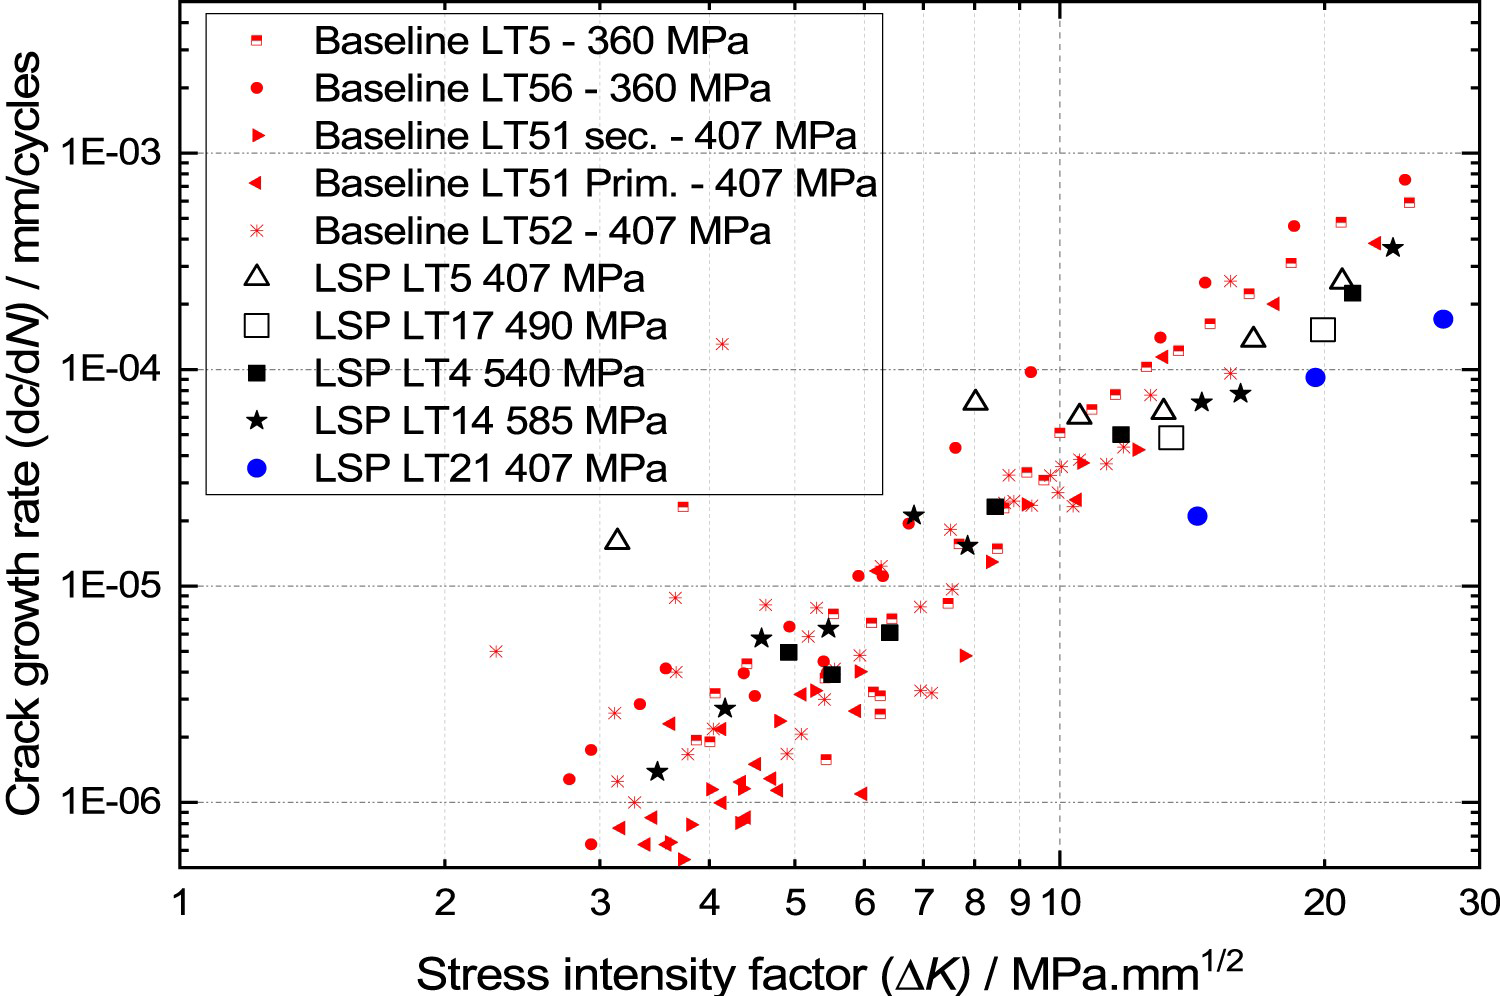
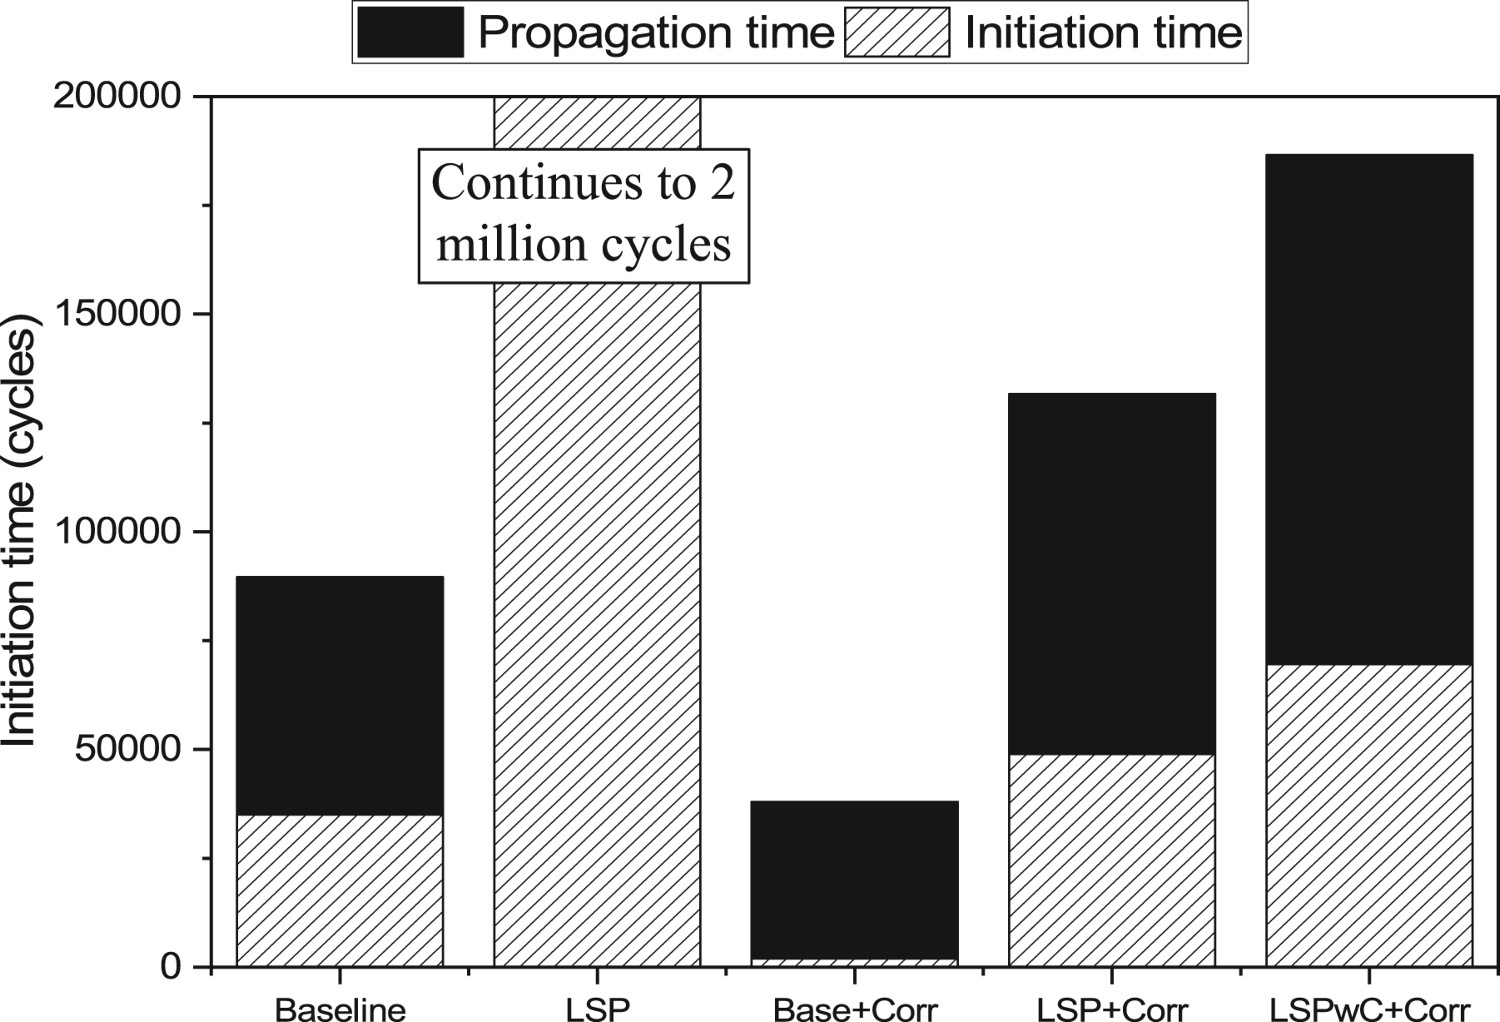
Figure 14 shows the baseline (untreated and uncorroded) AA7075 as-received (Rt = 2.64 µm) and 1 µm polished (Rt = 0.25 µm) fatigue life which are quite similar. In contrast, baseline fatigue life decreased by at least 50% in the presence of pre-corroded pits. The crack propagation (Figure 15) is at the top of the baseline trend, suggesting it occurs slighter faster than for the uncorroded untreated AA7075 baseline surface condition. Figure 16 shows crack initiation occurs almost immediately and at least 95% of fatigue life is spent in crack propagation. The pre-corroded LSP and LSPwC are subject to an order of magnitude decrease in fatigue life when compared to their uncorroded condition: from millions of cycles to hundreds of thousands. Nevertheless, both LSP treatments have a better fatigue performance than the untreated AA7075 baseline (either pre-corroded or uncorroded). Crack propagation data, although limited, shows a clear decrease in crack propagation rate for LSPwC compared to the baseline. For LSP, the crack propagation trendline lies near the bottom of the baseline trend, and considerably lower than the pre-corroded baseline samples. Crack initiation in both LSP and LSPwC lasts for 30% of the total fatigue life, thus considerably increasing the fatigue initiation time: from near zero cycles in pre-corroded baseline to approximately 40,000 cycles in pre-corroded LSP. For crack propagation, life is increased from 40,000 in corroded baseline to 80,000 for LSP and 160,000 for LSPwC. This suggests a considerable delay in both crack initiation and propagation due to LSP-generated residual stresses.
Stress range vs. cycles to failure for AA7075 Type A (baseline), LSP and LSPwC samples (pre-corroded and uncorroded). Uncorroded baseline and LSP samples are taken from Sanchez et al. Crack growth (dc/dN) vs. stress intensity factor range (ΔK) for baseline, LSP and LSPwC samples (pre-corroded and uncorroded). Baseline and LSP uncorroded samples are taken from Sanchez et al. Average initiation and propagation life of untreated AA7075 (baseline), LSP (LSPwC is expected to be the same), pre-corroded baseline, pre-corroded LSP and pre-corroded LSPwC. Columns show total fatigue life, including cycles at 0.1 and 0.5 load ratio.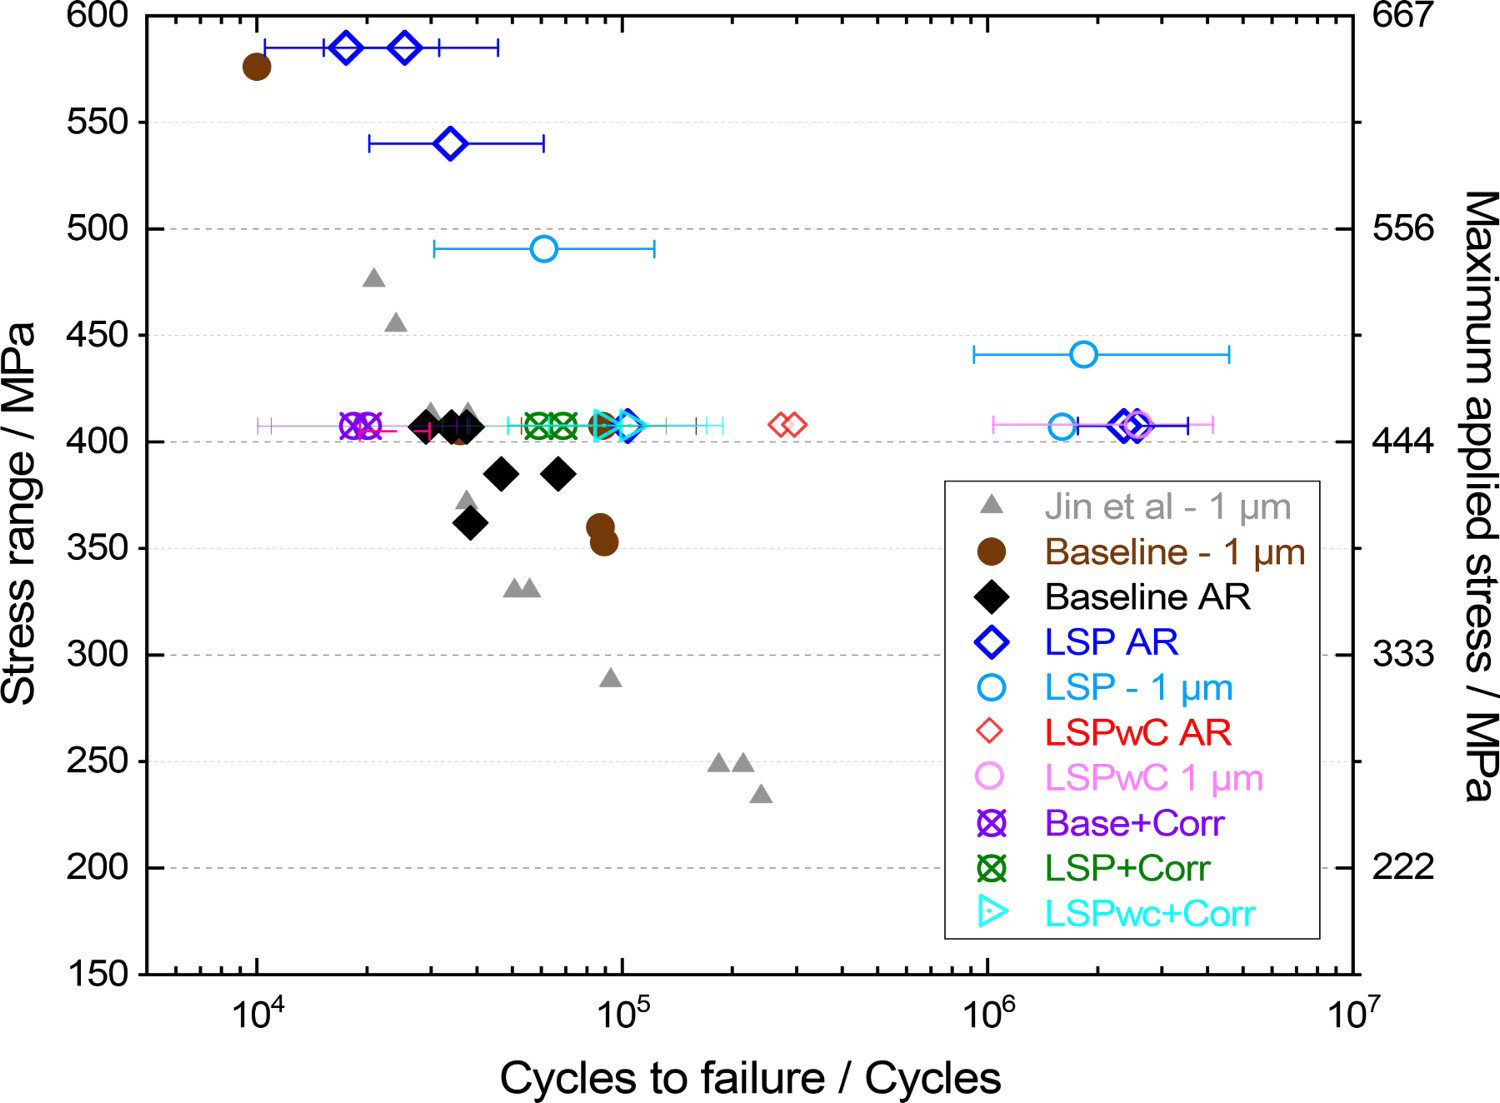
Discussion
LSP surface and microstructural changes
Laser peening of AA7075 is a complex phenomenon, which produces irreversible interfacial changes leading to the generation of surface micro-heterogeneities (peened ripple topography linked to plastic deformation) and near-surface changes in the polycrystalline microstructure/misorientation. Factors such as residual stress and roughness lead to a complex interplay of performance when these LSP-modified surfaces are subject to corrosion and fatigue environments.
As reported previously [24], residual stresses in LSP are higher or equal to previous laser-peening- or shot-peening-generated residual stresses in 7XXX alloys [11,20,23,25,26,30,38,43,54-57]. Figure 3 shows the LSPwC residual stresses within the initial 1 mm subsurface depth are up to 14% higher than for LSP. Thus, LSPwC also has higher residual stresses than previously reported in 7XXX alloys. The exception is at the surface, which is attributed to the LSPwC oxide layer formation and/or surface melting leading to weak residual stress generation (−85 MPa). The subsequent mechanical polish partly resolves this surface issue but ultimately does not achieve the higher magnitude residual stresses obtained by LSP with an ablative layer. Figure 6 [24] shows how the LSP KAM, and therefore plastic deformation, progressively decreases below the surface to considerably lower values: from near 2° at the surface to 0.75° at 1 mm below the surface, where minimal plastic deformation is anticipated, As such, relatively high levels of plastic deformation are concentrated near-surface for LSP, and the same would be expected of LSPwC.
Previous studies [58-61] have shown a clear link between hardness and residual stress. Small errors in the measurement of indent size in materials under compressive load (applied or residual) can lead to hardness overestimation, due to the residual stress effects on material pile-up at hardness indent edges. Thus, it is likely the apparent LSP hardness increase seen in this study (from 170 to 188 Hv) is in large part due to compressive residual stresses rather than the LSP-modified microstructure. When most residual stresses were removed (Type B), the hardness average decreased (175 Hv), although they were still slightly higher than for the untreated AA7075 (baseline). Considering LSPwC had similar peening parameters and residual stresses it would be expected to have similar hardness values to LSP. Instead, the LSPwC average and median hardness are only marginally higher than baseline. However, the variation in both Type A and B LSPwC samples is very large, particularly compared to baseline and LSP. It is likely there is an issue with testing accuracy due to higher roughness, and profile waviness, in LSPwC, as seen in Figure 5. Both the nature of non-ablative laser peening (ablation of alloy surface) and the subsequent mechanical polish to remove the subsequent oxide layer, lead to this increased roughness and waviness profile. Although this roughness is mostly within the same magnitude as baseline, it is four times higher (for Rz and Rt). Thus, a combination of the aforementioned indent pile-up effect and the surface/area ratio caused by roughness may be causing high variability in micro-hardness testing accuracy in LSPwC.
LSP effects on electrochemical and corrosion performance
The short-term OCP results agree with similar studies for AA6082 LSPwC by Trdan and Grum [41,42], where small potential changes are seen after peening (below 50 mV) within the first hour. However, the long-term (24 h) OCP shows relatively stable potentials for untreated AA7075 baseline, whereas potentials for all the LSP and LSPwC (A or B) decreased suggesting the modified surface (specifically roughness) may be detrimental in the longer term. Laser peening having a negative effect on corrosion is not universal: e.g. Trdan and Grum [42] found a favourable decrease in the current density of AA6082 LSPwC during polarisation tests. Other studies see minor corrosion potential increases without changes in kinetic behaviour for AA6082 LSPwC [42,62] and low-plasticity burnished AA2024-T3 [63]. In terms of kinetic behaviour, the potentiodynamic polarisations in this study (Figure 8) appear to be consistent with the open-literature: small increases in the corrosion potential (below 50 mV) of laser-peened material and similar kinetic behaviour for untreated and laser-peened material: No significant difference is found between the baseline and laser-peened (Type A or B) anodic and cathodic branches. Although there is a variation for all types of tested conditions, the kinetic behaviours of LSP and LSPwC are within the baseline range. This agrees with results from other electrochemical tests of this study: Overall it suggests no conclusive significant differences in behaviour between untreated and laser shock peened or between type A and B samples. Fundamentally, the LSP compressive residual stress will affect the thermodynamics of these electrochemical active surfaces, i.e. the ‘free-energy state’ which may promote the formation of oxide layers, and these may be the cause of the slight raised free corrosion potential of laser-peened samples. The residual stress, plastic deformation and surface roughness will generally alter the corrosion either from enhanced cathodic kinetics, increased anodic dissolution (more initiation sites with increased surface activity) or via the formation of oxide layers (here subject to a compressive stress field). Overall, the combination of these conditions has not shown a conclusive kinetic effect on AA7075-T651. However, although the precise effect of laser-peening-induced surface roughness on AA7075-T651 corrosion is unclear, the only real conclusion that can be drawn is that roughness could affect the electrochemical potential long-term.
When galvanostatically controlled (Figure 10), while there is no evidence of substantive corrosion, there are initially small transient differences, but subsequent pit characterisation shows no influence on pit density, pit size or depth for either LSP- or LSPwC-treated surface conditions. This is also different from that reported by Trdan and Grum [42,62], where a decrease in pit number and size was attributed to LSPwC surface melting changing the oxide layer (Al2O3) and residual stresses. Melting of aluminium surfaces using lasers has been shown to generate a more homogeneous surface, with fewer second-phase particles [64,65], and to generate an oxide layer [42,65,66]. For the present study, the LSP (due to the ablative layer) and LSPwC (due to the subsequent mechanical polish removing any shallow melted layer that may be present) are unlikely to have this laser-induced oxide layer. This difference in the oxide layer may explain why there is no enhanced corrosion performance as seen in other LSPwC studies [41,42,62,66]. Thus, the small transient improvements in corrosion potential seen in this study could be attributed to compressive residual stresses, as this is not seen only in laser peened [41,42,62,66] but also in shot-peened [43] and low-plasticity burnished [63] aluminium alloys. It is also likely that the laser-peening-induced roughness, particularly LSPwC, counteracts the residual stress benefits. Zagar and Grum [43] show that LSP treatment led to surface roughness that promoted higher corrosion current densities, counteracting any possible LSP benefits. Figure 11, showing the high galvanostatic control, suggests this is the case: LSP Type B (reduced or no residual stresses) shows higher pit area fraction and pit density compared to the Type A condition, where residual stresses may be counteracting the detrimental effects of roughness. In contrast, the low (less aggressive) galvanostatic control shows a significant difference between baseline and laser-peened Type A. In this instance, laser peened may have performed worse due to the slower kinetics allowing roughness to play a more dominant role. This corroborates the 24 h OCP data, suggesting in long-term, natural (non-aggressive) exposure, roughness plays a significant role in pit corrosion development, being more dominant than any beneficial residual stress effects. In addition, although grain refinement was not captured quantitatively, it is known that changes in grain size can have an effect on corrosion performance [67]. However, the lack of conclusive evidence of changes in corrosion performance in this study suggests the expected grain refinement from both LSP and LSPwC has had a negligible effect in corrosion behaviour. Overall, this indicates surface roughness may be the most important variable in terms of electrochemical behaviour and corrosion performance after laser peening, offsetting any residual stress effects. For LSPwC, if the oxide layer is not removed it may also provide an enhanced barrier to corrosion but this could not be evaluated in this study.
Mechanisms for AA7075-T651 corrosion initiation
From Figure 9 it is evident there is no discernible change in pit corrosion mechanism after LSP, which is also seen for LSPwC. This agrees with the negligible minor effects seen in electrochemical behaviour after both laser-peening types. Aside from a few studies [41-43,62,66], residual stresses are reported to mostly have a significant effect only when retarding corrosion in processes where there is an external mechanical stimuli, such as corrosion fatigue and stress corrosion cracking [28-40]. In contrast, Liu and Frankel [63] evaluated the direction of compressive residual stress relative to the direction of intergranular corrosion (IGC). They observed compressive stresses (applied or residual) normal to the direction of preferred IGC (L-LT) reduced corrosion rates by closing intergranular sites. However, this benefit was not seen if the compressive stresses were parallel to the IGC direction. Unlike the Frankel study [63], the compressive residual stresses in this study are expected to be mainly parallel to the electrochemically exposed L-LT surface and as such the benefits of compression on IGC were not seen. Thus, for this study, the dominant role of second-phase intermetallics in corrosion pit initiation and growth, which is well documented [68,69], and the role of IGC, were clearly unchanged by the laser-peening-induced residual stresses or the modified surface. Future work should study similar electrochemical tests on AA7075-T651 with LSP treatment, and thus compressive residual stresses, normal to the preferred direction of IGC (L-LT plane), and likewise, to investigate LSPwC without removing its generated oxide layer. This oxide layer and the resulting homogenised surface caused by laser melting may change the overall electrochemical behaviour, giving a small to moderate improvement in electrochemical properties and reduce the number and size of pits.
LSP effects on fatigue behaviour of pre-corroded AA7075-T651
Evaluation of the fractured fatigue samples (Figure 12) showed cracks do not necessarily initiate at the deepest or widest pits within a pre-corroded surface. In several cases, cracks originated at what appear to be 10-µm-deep pits. SEM microscopy of pit cross-sections shows many of these apparently discrete pits are in fact connected to one another below the surface. Thus, the pit morphology under the surface is more complex. Cracks initiate subsurface and at the sharp edges of these complex pits, where the stress concentration is highest.
Fatigue S-N data (Figure 14), and microscopy of beach-marked fracture surfaces reveal the decrease in fatigue life of corroded baseline samples is due to a near-complete absence of crack initiation time. This confirms pits (mechanical or corrosion), act as effective stress concentrations, initiating cracks shortly after dynamic loading starts. The crack growth rate vs. stress intensity factor (ΔK) data in Figure 15 suggest that the crack growth rate of corroded baseline is not particularly faster than uncorroded baseline, although it sits on the upper limits of this data trend. This may be due to all samples having at least two cracks initiating close together and coalescing shortly after. Thus, crack growth rates are marginally faster than uncorroded baseline due to multi-site cracking. This, and the fact the cracks already start 50 µm below the surface (at pits) may explain why crack growth life is lower than for uncorroded baseline.
Pre-corroded LSP S-N and crack growth rate vs. ΔK data show compressive residual stresses delay crack initiation by effectively counteracting stress concentrations at pits. The higher compressive residual stresses in corroded LSPwC samples means crack initiation and crack propagation are delayed more effectively than corroded LSP, as seen in Figure 15. It is likely residual stresses are playing a part in delaying crack propagation of small cracks (ΔK ≤ 10); however, multi-site fatigue crack growth likely accelerates the overall crack growth rate. The overall increase in fatigue life is +250% and 400% for LSP and LSPwC, respectively. Zupanc and Grum reported a similar improvement (an order of magnitude increase) in fatigue performance [36] in shot-peened AA7075. Thus the fatigue life improvement from the corroded surfaces is not due to laser peening changing the mechanism of fatigue crack initiation in pits. Instead, the improvement in fatigue life is solely connected to the level of residual stresses, and how effectively they delay crack initiation and propagation.
Conclusions
Laser shock peening with and without an ablative coating (LSP and LSPwC) generated deep compressive residual stress fields of up to −400 MPa in AA7075-T651, whilst also causing a small increase in surface roughness for LSP, and a moderate increase for LSPwC. Additionally, laser peening caused a small increase (up to 11%) in surface hardness for LSP and likely for LSPwC. Key study insights include:
There is no conclusive evidence of long-term effects of compressive residual stresses on corrosion performance, changes in the corrosion pit initiation mechanism, or the number or depth of pits, for the LSP and LSPwC treated AA7075-T651, where no external mechanical stimulus is involved. This may not be the case if compressive residual stresses are normal to the direction of preferred intergranular corrosion, and this should be investigated further. Laser-shock-peening-induced surface roughness can be a dominant feature and be detrimental to long-term corrosion performance. The LSPwC-induced oxide layer, not covered in this study, could be beneficial to corrosion performance and this should be investigated further in conjunction with its fatigue performance. Corrosion pits in untreated AA7075-T651 act as stress concentrations causing at least a 50% loss in fatigue life, mainly due to a near-complete absence of crack initiation time. Laser-shock-peen-generated residual stresses effectively counteract stress concentrations at pits, substantially delaying crack initiation by at least 40,000 cycles. The residual stresses also delay crack propagation, with LSPwC (160,000 cycles) performing better than LSP (80,000 cycles) due to the higher compressive residual stresses. Overall, laser-peened AA7075-T651 with corrosion pit degradation can be expected to have a fatigue performance and a lifetime equivalent or better than uncorroded unpeened AA7075-T651.
Footnotes
Disclosure statement
No potential conflict of interest was reported by the author(s).
Data availability statement
The raw data required to reproduce these findings are available to download from the University of Southampton repository at ![]() . The processed data required to reproduce these findings are available to download from https://doi.org/10.5258/SOTON/D1949.
. The processed data required to reproduce these findings are available to download from https://doi.org/10.5258/SOTON/D1949.