
Abstract
Hydrogen diffusion and trapping in ferrite is evaluated by quantum mechanically informed kinetic Monte Carlo simulations in defective microstructures. We find that the lattice diffusivity is attenuated by two to four orders of magnitude due to the presence of dislocations. We also find that pipe diffusivity is vanishingly small along screw dislocations and demonstrate that dislocations do not provide fast diffusion pathways for hydrogen as is sometimes supposed. We make contact between our simulations and the predictions of Oriani's theory of ‘effective diffusivity’, and find that local equilibrium is maintained between lattice and trap sites. We also find that the predicted effective diffusivity is in agreement with our simulated results in cases where the distribution of traps is spatially homogeneous; in the trapping of hydrogen by dislocations where this condition is not met, the Oriani effective diffusivity is in agreement with the simulations to within a factor of two.
This paper is part of a thematic issue on Hydrogen in Metallic Alloys
Introduction
Hydrogen can be dissolved in most metals and alloys [1], although it has remarkably low solubility in body-centred cubic (bcc) iron. The interaction of hydrogen with the microstructure is one reason for embrittlement and premature failure in high-strength steels and other engineering metals including nickel, titanium and zirconium alloys [2]. The deleterious effects of hydrogen are frequently connected to its rapid diffusion through the crystal lattice, in particular in bcc and martensitic steels. The interactions of hydrogen with crystal defects and their consequences are fundamentally less well understood than diffusion of hydrogen in the perfect crystal lattice, despite generally dominating the influence of hydrogen in metals.
Hydrogen atoms in the lattice are frequently divided into two categories: diffusing hydrogen, which can move freely through the normal interstitial sites, and trapped or non-diffusing hydrogen, residing around various crystal imperfections (vacancies, dislocations, grain boundaries and so on) [3–5]. The driving force for diffusion is the chemical potential gradient generated by hydrogen gradients combined with hydrostatic stress gradients. If fast trapping and detrapping kinetics are assumed, the freely diffusing and trapped hydrogen concentrations need to be in equilibrium. Based on the McLean isotherm, Oriani's [6] fractional occupancy  of a trap site is connected to the occupancy of normal interstitial sites
  by
by
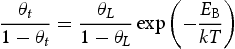
 is the corresponding trap binding energy, k is the Boltzmann constant and T is the absolute temperature. If
  and
and  represent the number of normal interstitial sites and number of traps per unit volume, then the volume concentrations of hydrogen in normal interstitial sites are
  and in traps
  . Using Equation (1), Oriani [6] finds an effective diffusivity of hydrogen given by
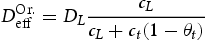
 is the hydrogen diffusivity in the perfect bcc lattice.
In this work the validity of Equations (1) and (2) is investigated by comparison to quantum mechanically informed kinetic Monte Carlo (kMC) simulations. Using the kMC, we may calculate the diffusivity of hydrogen in the perfect lattice,  . We can then create blocks of crystal containing defects which act as trap sites, and from the evolution of the simulation we can extract an effective diffusivity,
  . From the kMC simulations, the evolution of the occupancy of normal interstitial and trapping sites in pure bcc Fe is extracted and used as inputs to Equations (1) and (2) to calculate corresponding trap barriers and effective diffusivity,
  , in steady state, which are in turn compared for consistency with the input trap depths and output effective diffusivity,
  , to the kMC. Simulations of a perfect lattice are used to benchmark the resulting effective diffusivity in the lattice with defects (vacancy,
  edge or
  screw dislocation).
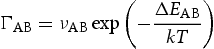
 is the attempt frequency and
  is the energy barrier between metastable position A through the saddle point to the position B, dependent on the local atomic configuration. For a given local configuration, a process k is selected according to
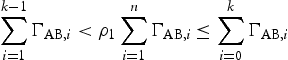
 is a uniform random number between 0 and 1, and n is the number of all possible events, i, during one transition. The kMC simulates Poisson processes and the simulation time
  of each event is evaluated as [8–10]
 is a second random variable in
  , and directly corresponds to physical time t when only interstitial diffusion is considered. The time-dependent diffusion coefficient is given by the Einstein expression, [11, 12] as
 is the average squared displacement of particles in time t, [13]. In this study, all simulations were done at a constant temperature of 300 K, using a box with
  bcc Fe unit cells, unless stated otherwise. Simulations were performed with full periodic boundary conditions in all directions. Fe atoms were not moved throughout the simulations and the permitted events were jumps between tetrahedral (T) sites, from T sites to trapping sites, vice versa and between trapping sites. The parameters used in the kMC model were for a vacancy obtained by using the quantum mechanical tight-binding approximation and molecular dynamics methods based around the Feynman path integral formulation of the quantum partition function [14, 15]; or taken from the literature for the hydrogen interaction with
  edge and screw [16] dislocations on
  slip planes, also determined within the framework of path integral molecular dynamics at 300 K. The use of
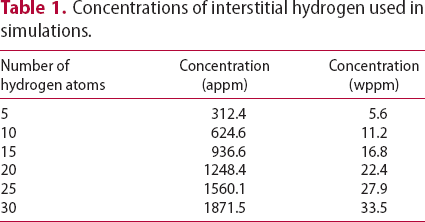
  bcc Fe unit cells results in very large defect concentrations in the simulation box; therefore, hydrogen concentrations were increased to obtain a realistic ratio between defect and interstitial concentrations. Simulations were performed with 5–30 hydrogen atoms and a vacancy, edge or screw dislocation, and a combination of edge and screw dislocations in the simulation box. The corresponding concentrations of interstitial hydrogen in atomic and weight parts per million are given in Table 1. To demonstrate the effect of simulation box size, test runs were also performed using
  ,
,  and
and  bcc Fe unit cells and compared with results obtained with
  bcc Fe unit cells.
Concentrations of interstitial hydrogen used in simulations.
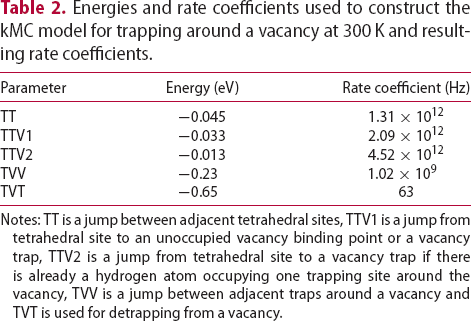
For simulations on the movement of interstitial hydrogen, the energy landscape around a defect is needed. Energies are then used as inputs in Equation (3) to calculate the rate of all possible events. In Table 2, energies and calculated rate constants needed for interstitial movement around a vacancy at 300 K are given. Several events are considered: TT is a jump between adjacent tetrahedral sites, TTV1 is a jump from tetrahedral site to an unoccupied vacancy trap, TTV2 is a jump from a tetrahedral site to the vacancy trap if there is already a hydrogen atom occupying one trapping site around the vacancy, TVV is a jump between adjacent trap positions around the vacancy and TVT is used for detrapping from the vacancy. According to quantum calculations up to six hydrogen atoms can be trapped around a vacancy; however, only two have high probability of being found there [14, 15, 17]. Therefore, in the model only up to two hydrogen atoms are allowed to be trapped around the vacancy to increase the computational efficiency of the model without sacrificing significant reality. Figure 1 shows a schematic representation of the events we consider in the kMC simulations of the vacancy microstructures.
Schematic representation of the events considered in our kMC model shown in the bcc lattice, where the vacancy (V) is presented as a dotted cube with six possible binding points around its centre, T is a tetrahedral interstitial site and Fe is an iron position. Energies and rate coefficients used to construct the kMC model for trapping around a vacancy at 300 K and resulting rate coefficients. Notes: TT is a jump between adjacent tetrahedral sites, TTV1 is a jump from tetrahedral site to an unoccupied vacancy binding point or a vacancy trap, TTV2 is a jump from tetrahedral site to a vacancy trap if there is already a hydrogen atom occupying one trapping site around the vacancy, TVV is a jump between adjacent traps around a vacancy and TVT is used for detrapping from a vacancy.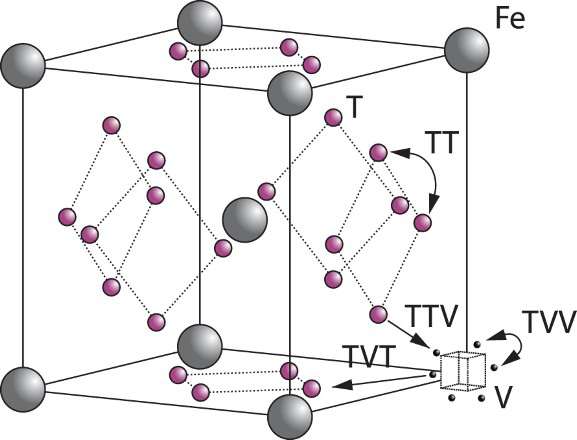
In all the calculations performed at 300 K, we use an activation barrier for lattice diffusion of 0.045 eV, calculated using zero-point energy-corrected density functional theory [18]; and an Arhenius prefactor of .
.
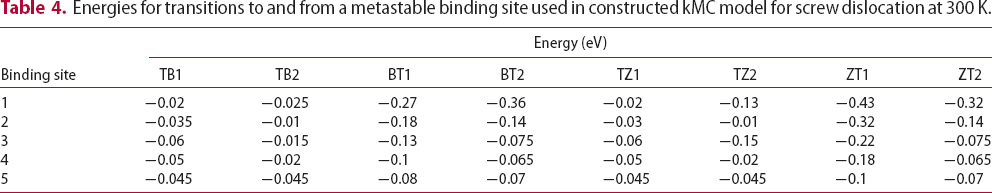
The energetic landscape of an interstitial hydrogen around edge or screw dislocations has many more local minima in comparison to the vacancy. As a remote hydrogen atom approaches the core, it encounters several metastable binding sites distributed between two parallel adjacent crystal planes which are perpendicular to the dislocation line sense [16]. In particular, the cores of edge and screw dislocations are reached through seven and six deep metastable binding sites, respectively. Movements from one metastable binding site to another and energy barriers for that transition were determined in [16] at 300 K using path integral molecular dynamics. However, these authors did not address transitions from bulk tetrahedral to metastable binding sites. The saddle point energy between a tetrahedral interstitial (T) site and a metastable binding site is assumed here to be similar to values obtained for transitions from a tetrahedral interstitial site to metastable binding site next to a vacancy [19]. In the case of edge dislocations, the present kMC model does not account for the change of binding energies and energy barriers between the metastable sites in compressive and tensile areas on both sides of the planar core. Instead, we assume that each metastable binding site is surrounded by four tetrahedral sites with energies for transition between T site to metastable binding points given in Tables 3 and 4 for Schematic representation of the TB/BT and TZ/ZT transitions based on the distance between four nearest tetrahedral interstitial sites T Energies for transitions to and from the metastable binding site used in constructed kMC model for edge dislocation at 300 K. Energies for transitions to and from a metastable binding site used in constructed kMC model for screw dislocation at 300 K. edge and
  screw dislocation, respectively. TB and TZ represent transitions from four nearest T sites to metastable binding sites close to the dislocation, while BT and ZT represent the reverse. Transitions are grouped into TB/BT and TZ/ZT based on the distance between the T sites and metastable binding sites close to the dislocation (cf. Figure 2). A larger number labelling of a binding site corresponds to a position closer to the dislocation core, where, for an edge dislocation, metastable point 7 is the closest to the dislocation line and, in the case of a screw dislocation, metastable point 6 is the closest to the core. As in the case of vacancy, at 300 K we use an activation barrier for lattice diffusion of 0.045 eV and an Arhenius prefactor of
 Hz.
Hz.
 and metastable binding site B.
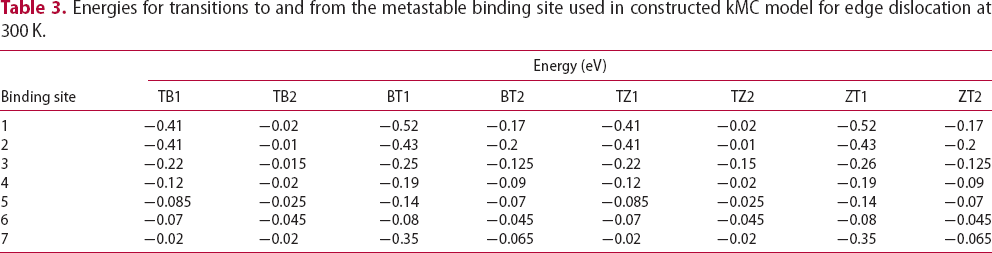
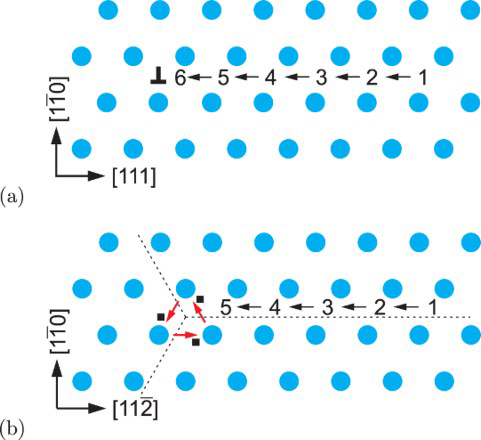
Schematic representations of edge and screw dislocation energetic landscapes are shown in Figure 3. In the case of an edge dislocation, the core is depicted as an inverted T, while numbers represent metastable binding points for a hydrogen atom diffusing along the Schematic representation of an energetic landscape around (a) edge dislocation and (b) screw dislocation. slip plane of the edge dislocation (Figure 3(a)). Figure 3(b) shows schematically energetic landscape and metastable points around a screw dislocation. The dotted lines serve as a guide to view threefold symmetry of the
  slip planes, and solid squares indicate the three deepest traps closest to the dislocation core. The arrows indicate those transitions of hydrogen atoms along the slip plane in the direction of the core that are included in our kMC simulations.
Activation energies for pipe diffusion along dislocation core lines for edge and screw dislocations.
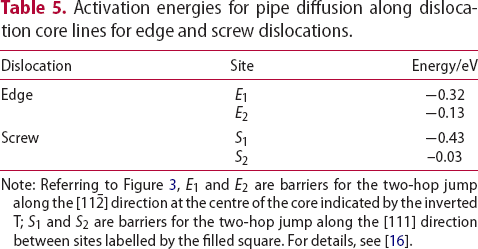
Note: Referring to Figure 3,  and
and  are barriers for the two-hop jump along the
  direction at the centre of the core indicated by the inverted T;
  and
and  are barriers for the two-hop jump along the
  direction between sites labelled by the filled square. For details, see [16].
Diffusivity in ideal lattice
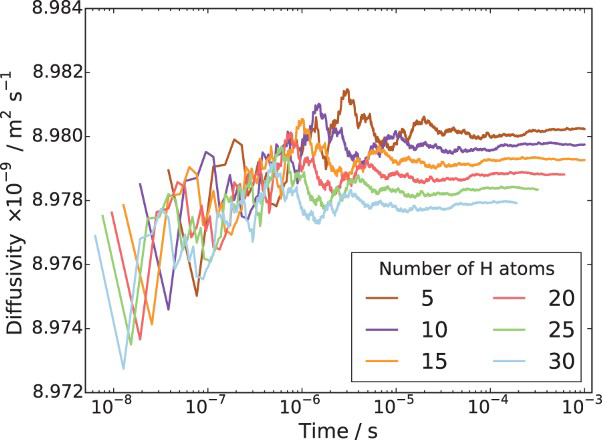
To begin with, we show in Figure 4 the calculated lattice diffusivity, Influence of hydrogen concentration (cf. Table 1) on kMC determined lattice diffusivity in an ideal lattice. , in a perfect lattice at 300 K as a function of simulation time. (In this and subsequent figures we use ‘diffusivity’ loosely to mean the simulated diffusivity as a function of simulation time. But our calculated diffusivities are of course the steady-state limit of this quantity.) It is vital to note that simulation times of at least one microsecond are required before a convergent result is reached. This is an important observation since it emphasises the need to go beyond timescales accessible to molecular dynamics. We have used an activation barrier for lattice diffusion of 0.045 eV and an Arhenius prefactor of
  Hz at 300 K, which reproduces the diffusivity measured by Nagano et al. [20], namely
  . As shown, there is negligible effect of hydrogen concentration on the interactions between interstitial atoms despite the small simulation box, as our results are in the range from
  to
to .
.
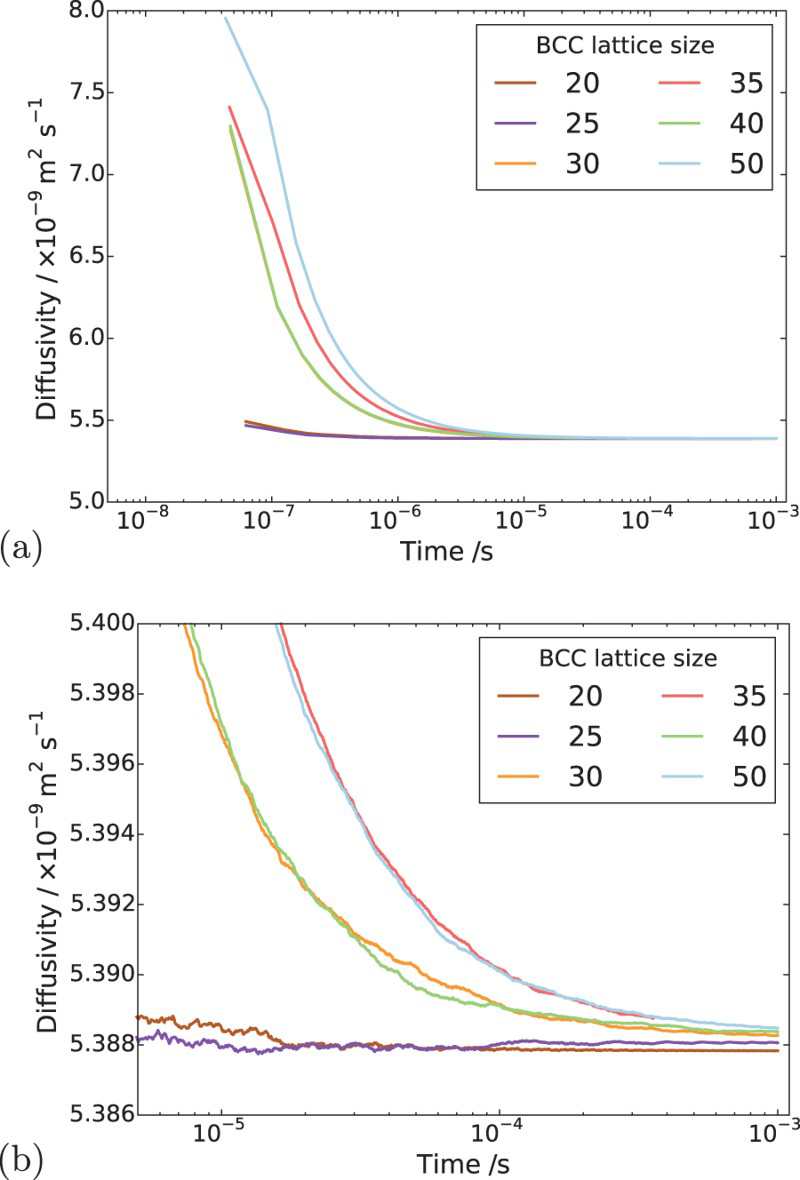
In order to determine appropriate simulation box size in the presence of a trap, we performed simulations with different box sizes of Results of simulations with single vacancy and five hydrogen atoms, (a) effect of simulations box size and (b) details showing final results of (a). ,
,  ,
,  ,
,  ,
,  and
and  unit cells and a single point defect (vacancy) with 5 hydrogen atoms in the simulation box. Our results depicted in Figure 5(a) show that box size only has an effect on diffusivity at the outset of the simulation. Since very similar final results for diffusivity was obtained for all tested box sizes (cf. Figure 5(b)), the decision was made to use
  bcc Fe unit cells (5.74 nm with 16000 Fe atoms and 100800 tetrahedral sites) to keep the simulation runtime achievable and reasonable.
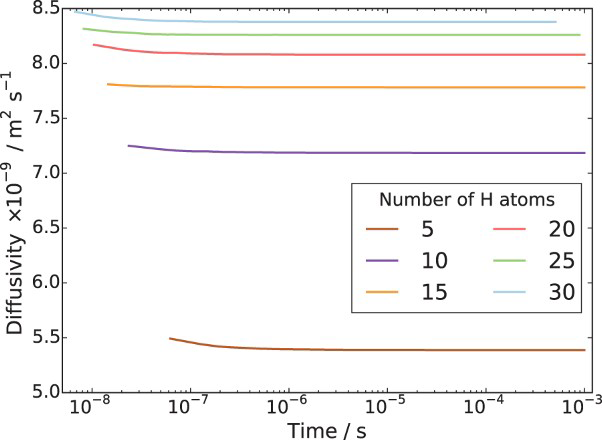
The effects of different initial hydrogen positions were evaluated. It was found that different initial positions of interstitial hydrogen have negligible effects on the diffusivity and time when the steady state is reached. Figure 6 shows evolution of effective diffusivity from kMC simulations for a single vacancy and different hydrogen concentrations. As shown, the time needed to reach steady state for a vacancy is about Influence of hydrogen concentration on effective diffusivity in lattice with a single point defect. s, indicating that hydrogen diffusivity around point defects achieves steady state almost instantly. For point defects this is expected since the activation barrier for trapping is lower than that for lattice diffusion, while the barrier for escape from the trap is so large that escape is a very rare event on the timescale of our simulations.
A comparison between calculated diffusivity in the perfect lattice and calculated effective diffusivity with different vacancy or hydrogen concentrations determined from kMC simulations is shown in Figure 7. It can be seen that similar ratios between defect and hydrogen concentrations lead to comparable effective diffusivities.
Influence of number of point defects or hydrogen concentrations on effective diffusivity and comparison to ideal lattice diffusivity.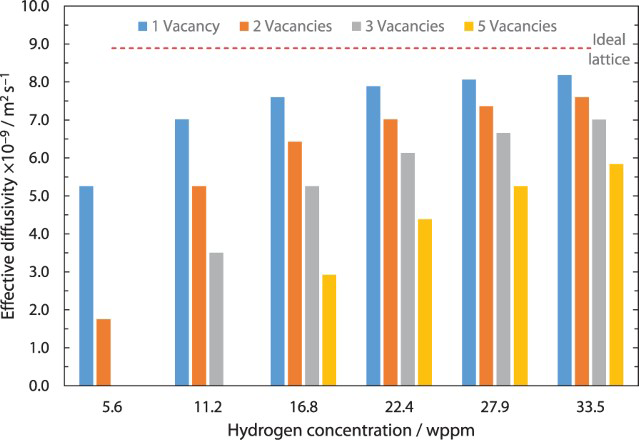
Simulations with dislocations were performed mainly using a box size of Influence of hydrogen concentration on kMC determined effective diffusivity in lattice with (a) single  Fe bcc unit cells and different hydrogen concentrations. Results of effective diffusivity for a single screw, a single edge and a combination of screw and edge dislocations are shown in Figure 8. Depending on the defect type and hydrogen concentration, the time needed to reach steady state is for both dislocation types, around
  s. Results shown in Figure 8 indicate that hydrogen diffusivity around traps, simulated with kMC achieves steady state almost instantly. This discovery is important for mesoscopic and continuum simulations of crack propagation where the redistribution of hydrogen during crack growth plays an important role.
 edge dislocation; (b) single
  screw dislocation; (c) one edge and one screw dislocation.
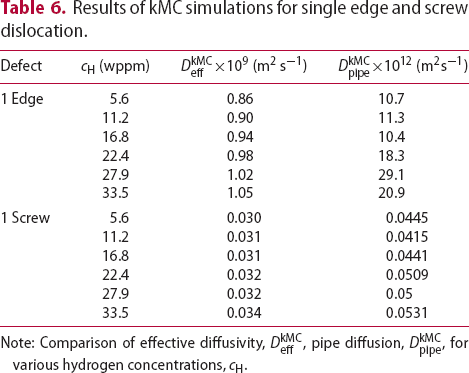
 direction of the dislocation line, clearly indicate that the diffusivity resulting from hydrogen transport along the dislocation line is several orders of magnitude lower compared to the effective lattice diffusivity. It follows that dislocation lines do not act as fast pathways for hydrogen pipe diffusion in bcc iron. In Table 6 are given results obtained for various hydrogen concentrations in a simulation box with a single edge or screw dislocations, where
  is the effective diffusivity and
  is the diffusivity along the
  direction within the dislocation core. Figure 9 shows the evolution of the diffusivity along a screw dislocation core, showing that the diffusivity along the screw dislocation line is more than order of magnitude smaller than the effective diffusivity of the dislocated lattice. Pipe diffusion along the screw dislocation
  direction is several orders of magnitude smaller than the lattice diffusivity.
Results of kMC simulations for single edge and screw dislocation.
 (wppm)
 (m2 s−1)
 (m2s−1)
Note: Comparison of effective diffusivity,  , pipe diffusion,
  , for various hydrogen concentrations,
  .
.

Pipe diffusivity along screw dislocation core () determined from kMC simulations.
From this we can conclude that the screw dislocation core is not a pathway for fast diffusion of hydrogen. The origin of this is twofold: first the activation barrier is large, Table 5, and second the trap occupancy is relatively large leading to blocking of the diffusion path.
In Figure 10 a comparison between calculated effective diffusivity for several cases with different dislocation or hydrogen concentrations is shown. It can be seen that similar ratios between defects and hydrogen concentration lead to comparable effective diffusivities.
Influence of defect and hydrogen concentration on effective diffusivity for dislocations.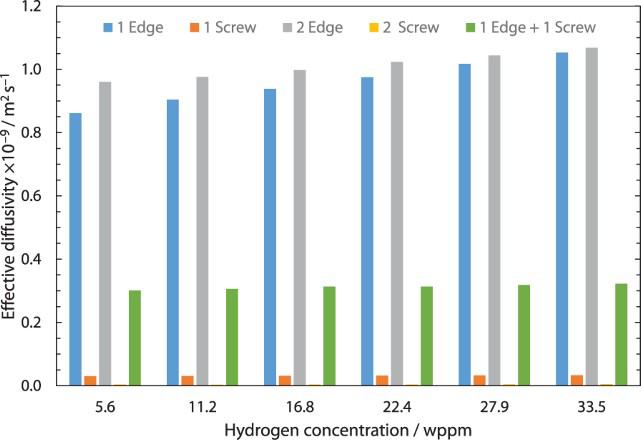
To test the validity of Oriani's assumption (cf. Equation (1), [6]) of equilibrium between freely diffusing and trapped hydrogen concentrations, the kMC model was developed in a way that trap and lattice occupancies could be followed. The total time hydrogen atoms spent at each site can be calculated at any given time during the simulation as the time spent in the trap or the lattice. Fractional occupancy of sites is obtained by dividing the time hydrogen atoms spent in a site by the total time. Since a kMC simulation aims to reach thermodynamic steady state, values at the end of simulations were used to determine trap binding energies of defects from resulting data for occupancies between lattice hydrogen and trapped hydrogen using equation (1) and to test the validity of Oriani's theory of local equilibrium by comparing these binding energies with those used as input. After suitable averaging of the trap occupancies, the diffusivity obtained from kMC is compared to the effective diffusivity calculated with Equation (2) using occupancies from kMC simulations. Detailed results and calculated trap binding energies for different defect and hydrogen concentrations are presented in Tables 7–9. Results for the vacancy in Table 7 show a minimal effect of concentration in the cases where the number of hydrogen atoms is smaller than the number of trapping sites. The average value for vacancy trap binding energy calculated using equation (1) is determined to be Results of obtained diffusivities for point defect from kMC simulations, Results of kMC simulations for various vacancy and hydrogen concentrations. Note: Vac. is the number of vacancies, Results of kMC simulations for dislocations and hydrogen concentrations. Note: Results of kMC simulations for dislocations and hydrogen concentrations. Note:  eV. In the case of a single type of dislocation (cf. Table 8), the number of possible trapping sites far exceeds the number of hydrogen atoms in the box. The trap binding energy determined for an edge dislocation is
  eV and is independent of the number of dislocations in the box. The trap binding energy of the screw dislocation is slightly dependent on the number of dislocations in the box and is
  eV for a single screw dislocation in the box and
  eV in the case of simulations with two screw dislocations. This increase occurs due to overlap between both dislocations. Oriani's effective diffusivity,
  , calculated using equation (2) for vacancies using occupancies from kMC simulations is presented in Table 7. Comparison between
  and
and  shown in Figure 11 reveals that the diffusivity obtained from kMC simulations is slightly lower than that obtained using equation (2). The largest differences are in the case of lowest hydrogen concentrations, and the least differences when the hydrogen concentration is highest. This can be explained by the small difference between the number of hydrogen atoms that can freely move compared to possible trap sites. In the cases where the number of traps exceeds the number of hydrogen atoms, we get very similar results when comparing both approaches. From our results, we may show that Oriani's effective diffusivity is a very good approximation for the description of effective diffusivity of hydrogen in the case of microstructures with a single type of trap uniformly distributed, for example, the case of vacancies.
 (closed symbols) and calculated using Oriani's equation,
  (open symbols).
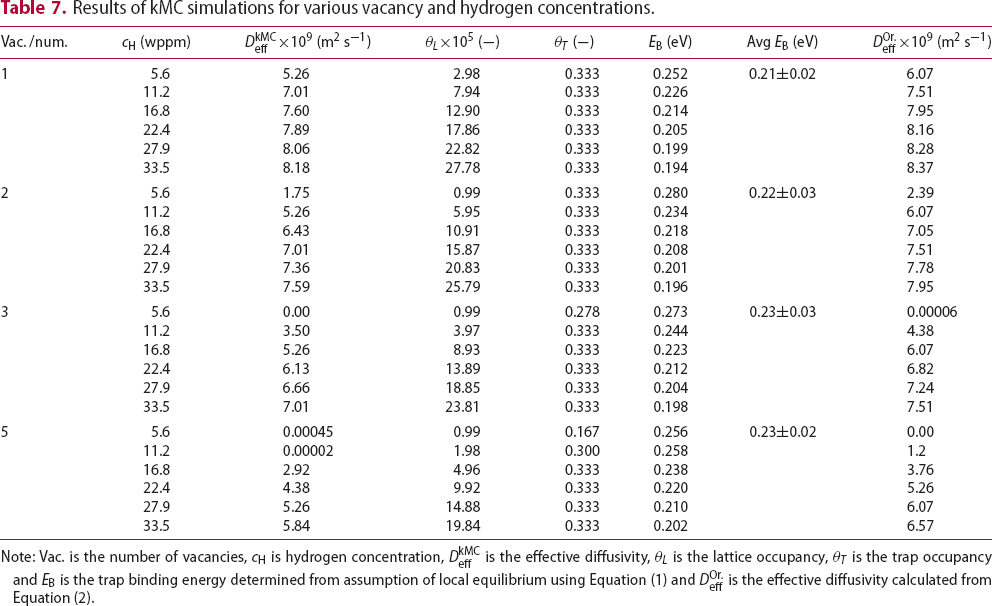
 is hydrogen concentration,
  is the effective diffusivity,
  is the lattice occupancy,
  is the trap occupancy and
  is the trap binding energy determined from assumption of local equilibrium using Equation (1) and
  is the effective diffusivity calculated from Equation (2).
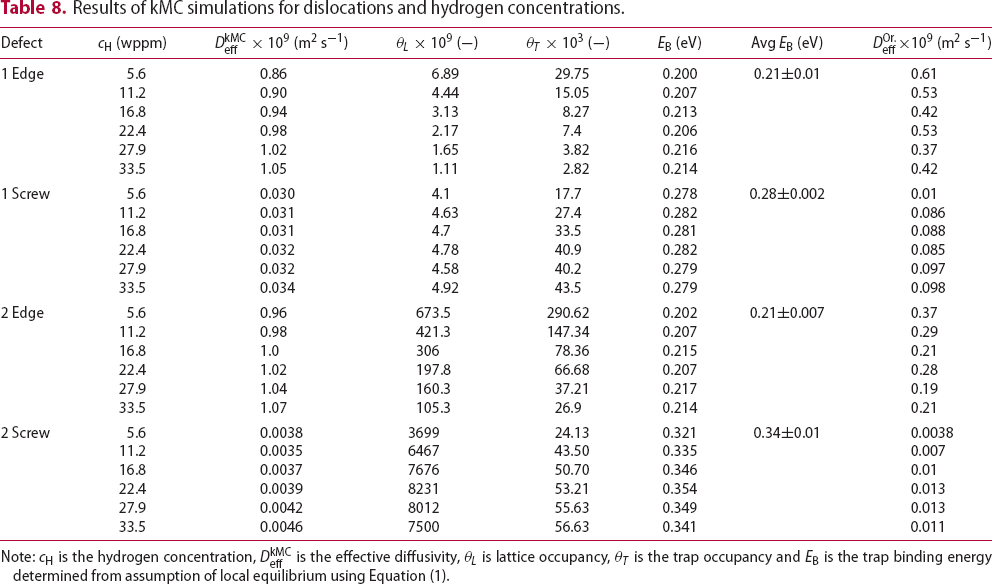
 is the hydrogen concentration,
  is the effective diffusivity,
  is lattice occupancy,
  is the trap occupancy and
  is the trap binding energy determined from assumption of local equilibrium using Equation (1).
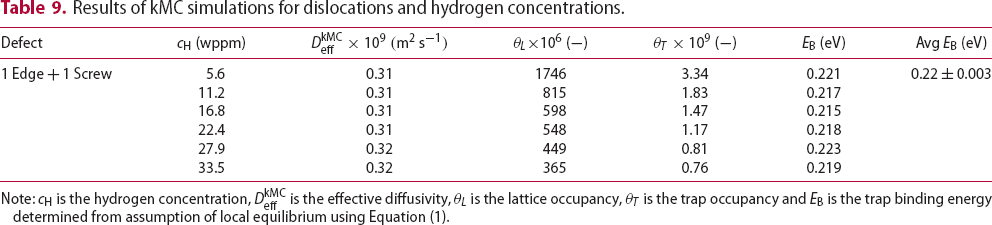
 is the hydrogen concentration,
  is the effective diffusivity,
  is the lattice occupancy,
  is the trap occupancy and
  is the trap binding energy determined from assumption of local equilibrium using Equation (1).
 (wppm)
 (m2 s−1)
 (−)
(−) (−)
(−) (eV)
(eV) (eV)
(eV)
 (m2 s−1)
 (wppm)
 (
( )
) (−)
(−) (−)
(−) (eV)
(eV) (eV)
(eV)
 (
( )
) (wppm)

 (−)
(−) (−)
(−) (eV)
(eV) (eV)
(eV)Results from kMC simulations with edge and screw dislocations in the box are presented in Table 9. The trap binding energy for combination of both types of dislocations in kMC simulation is Results of obtained diffusivities from kMC simulations,  eV and is close to the simulations where only an edge dislocation is present. Comparison of effective diffusivity shows that though vacancies can bind hydrogen to their nearest tetrahedral sites, the number of these sites is too small to have any large effect unless the number of possible trapping sites exceeds the number of hydrogen atoms. In the case of dislocations effective diffusivity is significantly lower than that in the ideal lattice or even in a lattice with only vacancies. Moreover, results show that the effective diffusivity in the presence of screw dislocations is a couple of decades smaller compared to simulations with edge dislocations or combinations of defects. This is due to deeper trap sites around screw dislocations and interactions between them if several screw dislocations are present in the box. Resulting values for the binding energies for vacancy and edge or screw dislocations are in good agreement with published results from the literature [21, 22]. Figure 12 shows comparison between calculated diffusivity from kMC simulations and determined effective diffusivity using Oriani's theory for dislocations. In the case of a screw dislocation, Oriani's effective diffusivity calculated with inputs for occupancies at the end of kMC simulations is slightly higher compared to diffusivity from kMC simulation (cf. Figure 12(a)). In the case of an edge dislocation and combination of edge and screw dislocations depicted in Figure 12(b), diffusivity obtained from kMC simulations is higher than calculated using equation (2). Larger discrepancies between diffusivities obtained from kMC simulations and calculated Oriani effective diffusivity,
  , using data for occupancies from kMC simulations can be explained by the spatial inhomogeneity of the energy landscape due to trap sites.
 , (closed symbols) and calculated using Oriani's equation,
  , (open symbols) for (a) single
  screw dislocation and (b) single
  edge dislocation and one edge and one screw dislocation.
A kMC model for diffusion of hydrogen has been developed. This is able to simulate diffusion in ideal lattices and with vacancies and edge or screw dislocations with Diffusivity in the ideal lattice is comparable to experimental results. Direct comparison can be made of explicit simulations and the theory of Oriani which assumes local equilibrium and one type of trap. The kMC confirms the establishment of local equilibrium in all the cases we have looked at. The Oriani effective diffusivity,  Burgers vector. The following conclusions can be reached from the present work.
 , forms a good approximation to that calculated by kMC,
  . The best agreement is in the case of a homogeneous distribution of vacancies. For the case of dislocations, because these are spatially inhomogeneously distributed and there is a range of trap types with different binding energies, the Oriani effective diffusivity may differ by a factor of two from the kMC value.
As a result of kMC simulations of hydrogen transport in the proximity of a screw dislocation, we can conclude as follows:
Hydrogen atoms are confined to the region around the dislocation line, where they jump between the adjacent binding and low-energy metastable sites. Hydrogen atoms occupy predominantly the deepest trap sites close to the dislocation line. Hydrogen diffusivity significantly decreases with increasing dislocation density. Dislocation pipe diffusion of hydrogen results in significantly lower diffusivity compared to lattice diffusion. We calculated the jump diffusion coefficient for hydrogen diffusion in the cases when hydrogen atoms are trapped inside the core and move in the
 direction along the dislocation line. Our kMC simulations clearly indicate that the diffusivity resulting from hydrogen transport along the dislocation line is several orders of magnitude lower than that resulting from the lattice diffusion. Thus, the dislocation lines do not act as fast pathways for hydrogen diffusion in bcc Fe. The two reasons for this are the large activation barrier and the near saturation of trap sites leading to a blocking of the diffusion path.
Similar simulations of the hydrogen diffusivity in proximity of The diffusivity near edge dislocations is higher compared to that in the vicinity of screw dislocations. Apart from the higher number of trap sites, diffusivity near a screw dislocation is also affected by its non-planar core structure. The planar core of the edge dislocation allows hydrogen atoms to move in directions parallel to the lines of trap sites, which increases their pipe diffusivity. We repeat that, in these preliminary simulations, we have neglected possible attraction and repulsion of hydrogen by the tensile and compressive strain fields above and below the slip plane of an edge dislocation. There are no dominant trap sites. Hydrogen atoms are confined more or less evenly in all binding sites and jump between trap sites and the adjacent low-energy metastable sites. There is no low-energy pathway for hydrogen diffusion in the  edge dislocations show the following.
 direction along the dislocation line. We used our kMC model for screw and edge dislocations to simulate diffusion of ten hydrogen atoms. Hydrogen diffusivity in this case is higher than the diffusivity around the same number of screw dislocations and lower than the diffusivity around edge dislocations. The reason for this is the higher hydrogen diffusivity in the proximity of edge dislocations.
Footnotes
References
 -iron
-iron an ab initio study