
Abstract
During the past 20 years Victoria's mental health (MH) services have undergone the transition from institutional to community-based care aiming to provide treatment in the least restrictive environment. In 1992–93, 35% of MH expenditure was directed to community-based services; this had increased to 66% by 2002 [1]. Additionally, there has been mainstreaming of inpatient services into the general health system. In 2000, Victoria provided 95% of MH inpatient beds within general hospitals compared to 35% in 1992–93 [2].
Major hospitals’ emergency departments (EDs) have developed an increasingly important role in providing crisis services to patients with MH issues. In the Victorian MH service a referral is made to a duty worker at an MH clinic or after-hours psychiatric triage facility and patients are triaged to a clinic or Crisis Assessment and Treatment (CAT) team for follow up. However, for many patients with acute MH issues, the ED is being used as the initial point of care.
In 2002 the Victorian Department of Human Services (DHS) Emergency Demand Coordination Group determined that in the previous 2 years there had been a 13.2% increase in MH presentations to Victorian EDs from 26 902 to 30 985 [3].
Furthermore, between 1997–98 and 2000–01 registered clients of Victorian MH services increased by 24.4% from 40 394 to 53 442. Concurrently, MH inpatient beds rose by only 3.4% to 949 so that Victoria was 2.6 beds (10.7%) below the national average of 24.4 per 100 000 adults [4]. The increasing demands on community MH care and relatively low provision of inpatient beds increased pressure at the interface of these services: Victoria's EDs.
Few studies have examined the characteristics of patients who present to EDs with MH issues. Harris et al. examined ED frequent attenders in New South Wales. This population had substantial support needs but were not linked into appropriate support agencies [5]. Cassar reported that EDs largely serve a different population of mentally ill patients compared to local community MH teams and therefore play an integral role in providing support and services for those missed by MH services [6]. Schnyder et al. reported that current diagnoses of psychotic disorder, referral by the police or health professional and previous hospitalizations were the strongest predictors of hospitalization after ED presentation [7].
To date there has been no comprehensive descriptive examination of patients with MH issues who present to Australasian EDs.
The aim of the present study was to determine the nature of MH presentations to EDs in Victoria and to describe this population including the means of arrival, management and disposition.
Methods
This was a multicentre retrospective observational study undertaken between May 14 and October 13, 2004.
Five sites participated and provided a cross-section of EDs from Melbourne and regional Victoria: two tertiary referral (Alfred and Royal Melbourne Hospitals), two major urban (Dandenong and Maroondah Hospitals) and one regional (Geelong Hospital). Table 1 provides an overview of the population of each catchment area, the corresponding funded acute bed numbers and the presentations to EDs at those sites [8].
Characteristics of participating sites (2003)
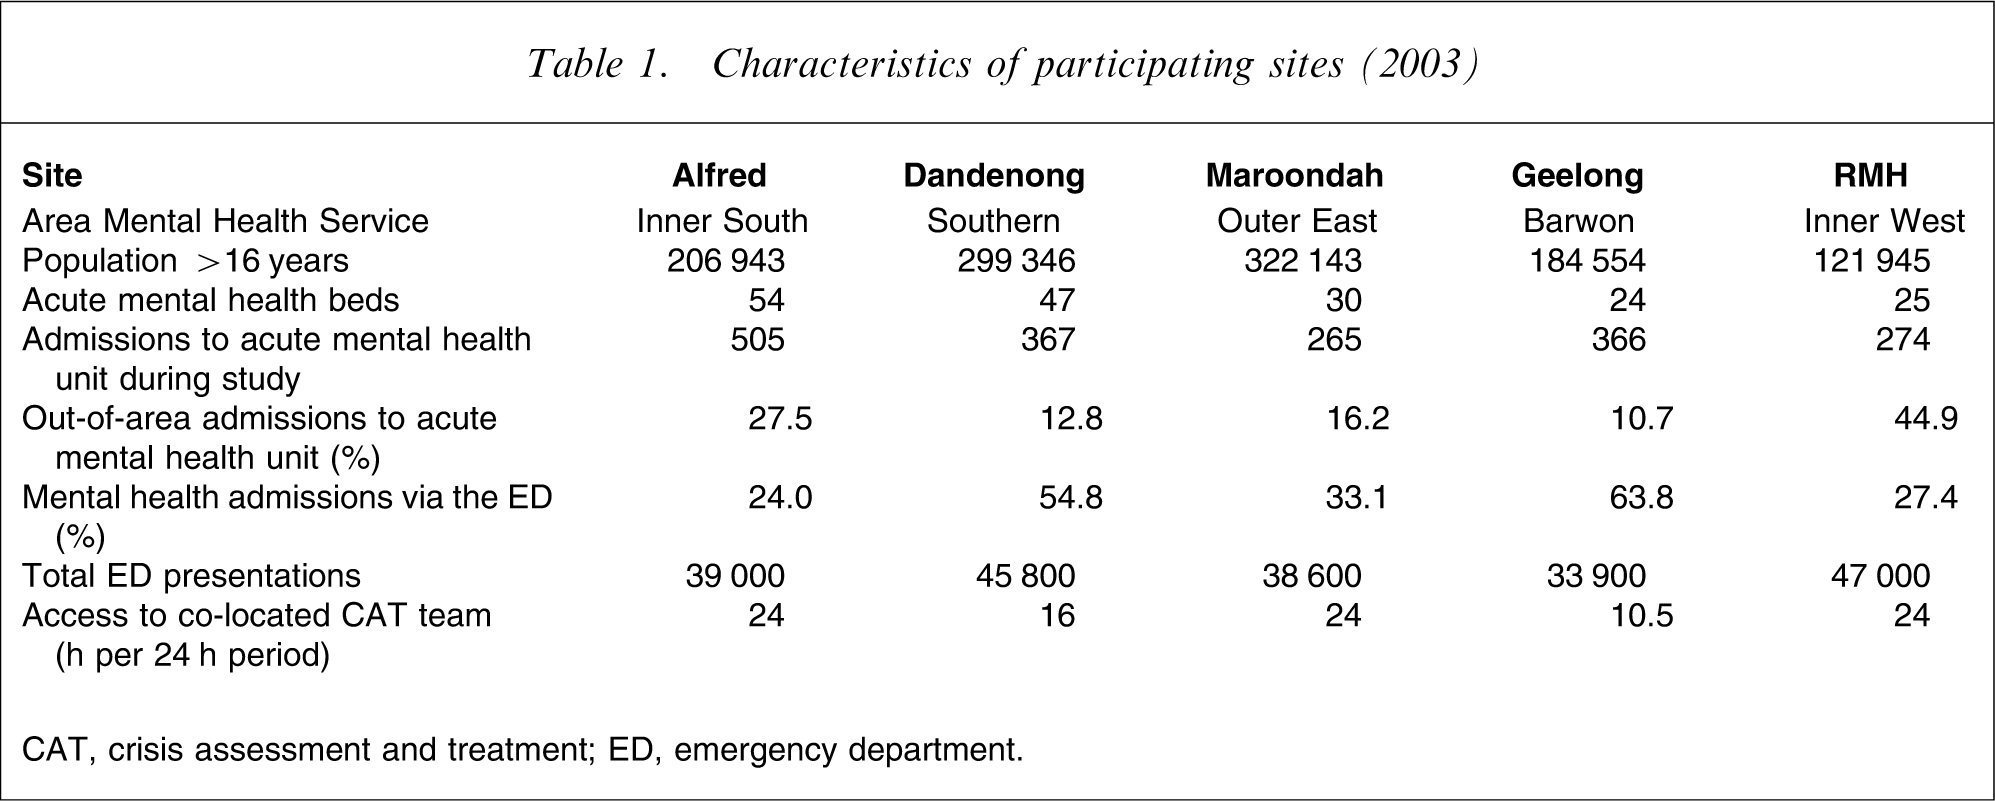
CAT, crisis assessment and treatment; ED, emergency department.
Patients were included if they had an ED discharge diagnosis of an MH disorder including mental illness, substance abuse or crisis presentation including deliberate self-harm. These diagnoses were determined prospectively and based on ICD-10 classifications for mental and behavioural disturbance [9]. Patients with simple intoxication only were excluded. All patients were identified using the EDs’ information system. Data were extracted from the medical record using a specifically designed, explicit data collection document. Data from each site were extracted by a dedicated research assistant. Extracted data included patient demographics, clinical data, details of ED management, reason for presentation and disposition.
The data documents were scanned into a database by Strategic Data (Strategic Data, Melbourne, Victoria, Australia). One hundred and eighty-five records in the database (5.0%) were selected at random and manually checked against the data collection instrument. Seven of these records (3.8%) were found to have been incompletely scanned. The items were manually corrected for these records only. All times in the database were sorted to identify errors, which were manually corrected. Thus, although all times were correctly recorded, 3.8% (95% confidence interval (CI): 1.7–8.0) of the records may have incomplete data.
The time to be seen by clinician mostly indicates when ED medical staff first saw the patient. However, due to co-location of MH services, the first clinician may have been from MH services. The time from referral to review by MH staff indicates the time from referral to being seen by any member of MH services including CAT or Extended or Emergency CAT (ECAT) clinicians, psychiatric registrars or consultants. ECAT clinicians are MH workers who are based in the ED rather than the community. A presentation “only because an MH bed was unavailable” required specific documentation in the patient record that had an MH bed been available, the patient would have been a direct admission to the inpatient ward from the community, for example a revoked community treatment order. This subgroup excludes any patient who required ED assessment (medical clearance) prior to MH admission. A nursing “special” was defined as a case in which one-to-one care by any nurse was required and specifically documented.
Comparisons between sites were conducted to determine whether local differences in ED MH management occurred. Where appropriate, non-MH data are presented for comparison with MH presentations. DHS provided data on non-MH presentations during the study period and MH admissions to the institutions in the present study (RAPID database, DHS) [10].
Data were analysed on Intercooled Stata version 8.2 (StataCorp, College Station, TX, USA). Proportions were compared using χ2 tests, normally distributed data using Student's t-test or ANOVA and non-parametric data using Wilcoxon's rank–sum test or Kruskal–Wallis test.
In 2001/02 the five EDs saw approximately 180 000 patients. The proportion of patients with any ICD-10 code for mental illness has been reported as 6.8% [3] but this included those patients with simple intoxication. A recent publication from the Australian Institute for Health and Welfare reported that 24.2% of ED MH presentations were due to intoxication [11]. Therefore the five EDs should expect approximately 9300 MH presentations per annum excluding those with simple intoxication. The study was limited to a data collection period of 5 months, over which time it was anticipated that 3866 patients would be enrolled.
This study was approved by the Ethics Committees of Barwon Health, Bayside Health, Eastern Health, Melbourne Health and Southern Health.
Results
There were 3857 MH presentations to the five sites during the study period. Data were available for 3702 subjects (96.0%).
Presentations occurred consistently across the week with no day-to-day variation. The pattern was similar across all five sites (p = 0.46). Table 2 shows that MH patients, compared with non-MH patients, were more likely to present after hours, especially between 20.00 hours and 04.00 hours. The pattern of presentations throughout the day was consistent across the five sites. There were few presentations where immediate assessment (triage category 1) was required. There was a higher proportion of patients triaged as category 3 and a lower proportion triaged as category 4 than for the non-MH ED population.
Comparison of MH and non-MH presentations to emergency departments
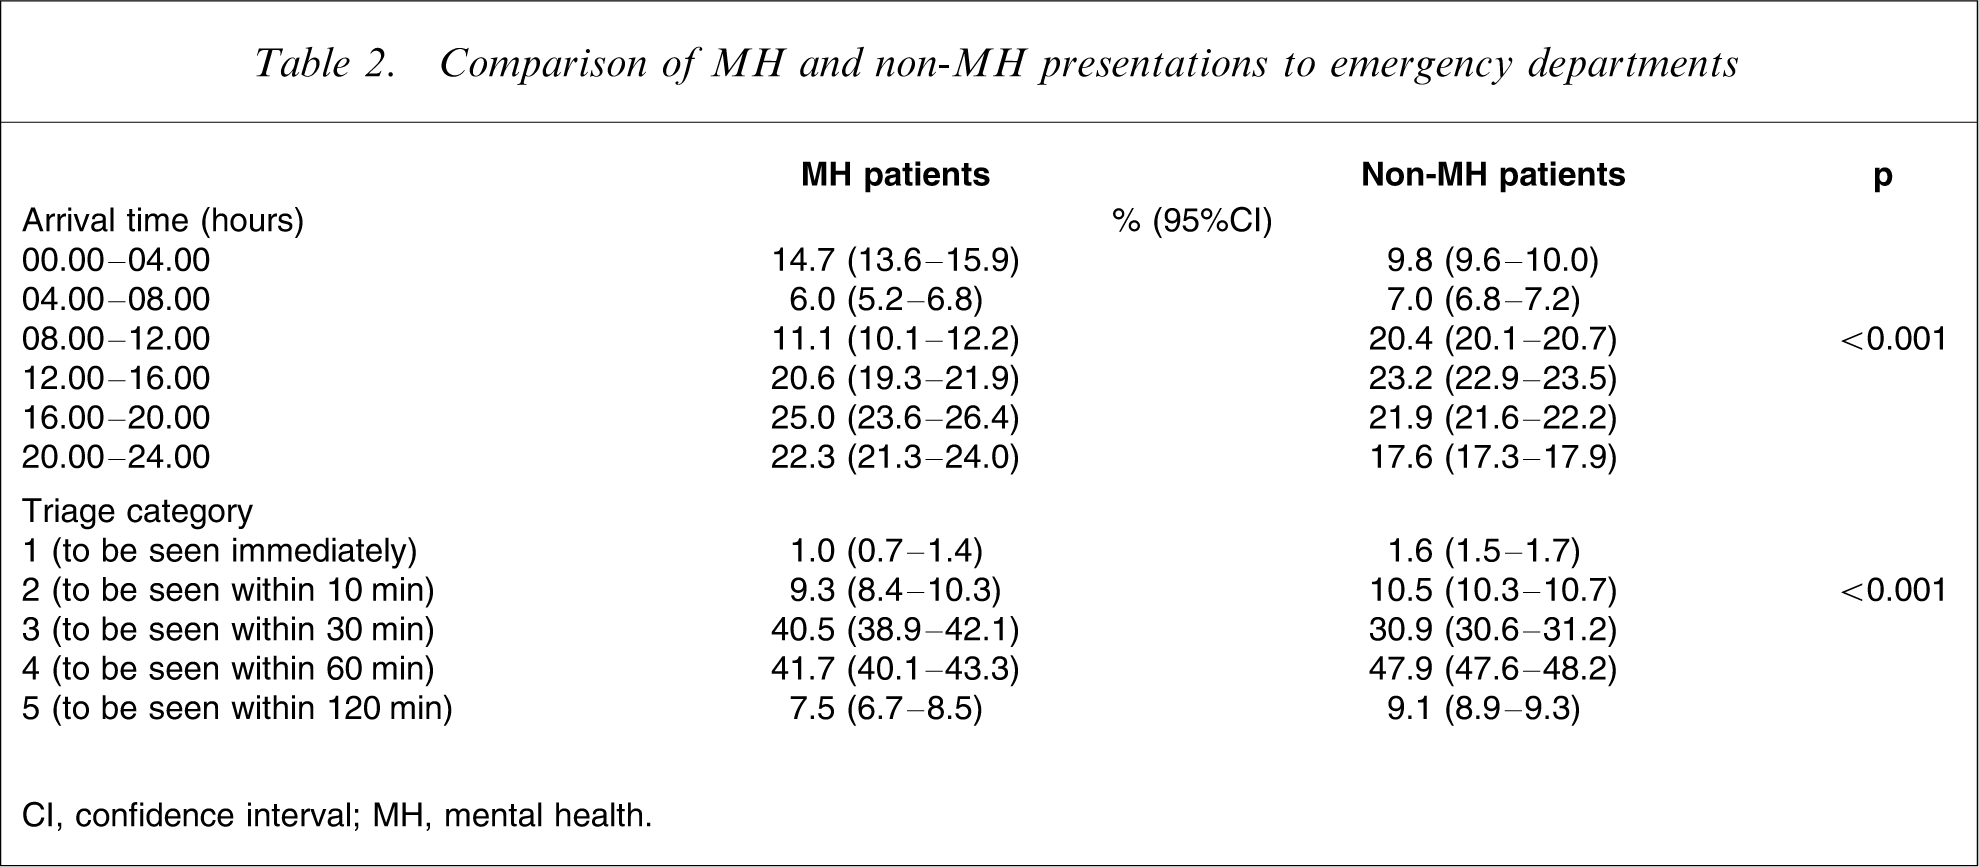
CI, confidence interval; MH, mental health.
Figure 1 shows the median time to see a clinician, usually a doctor. The overall median time was 26 min and 75% of all patients were seen in <1 h. Fewer than 1% waited >4 h to be seen.
Time to see clinician, by site (p < 0.001).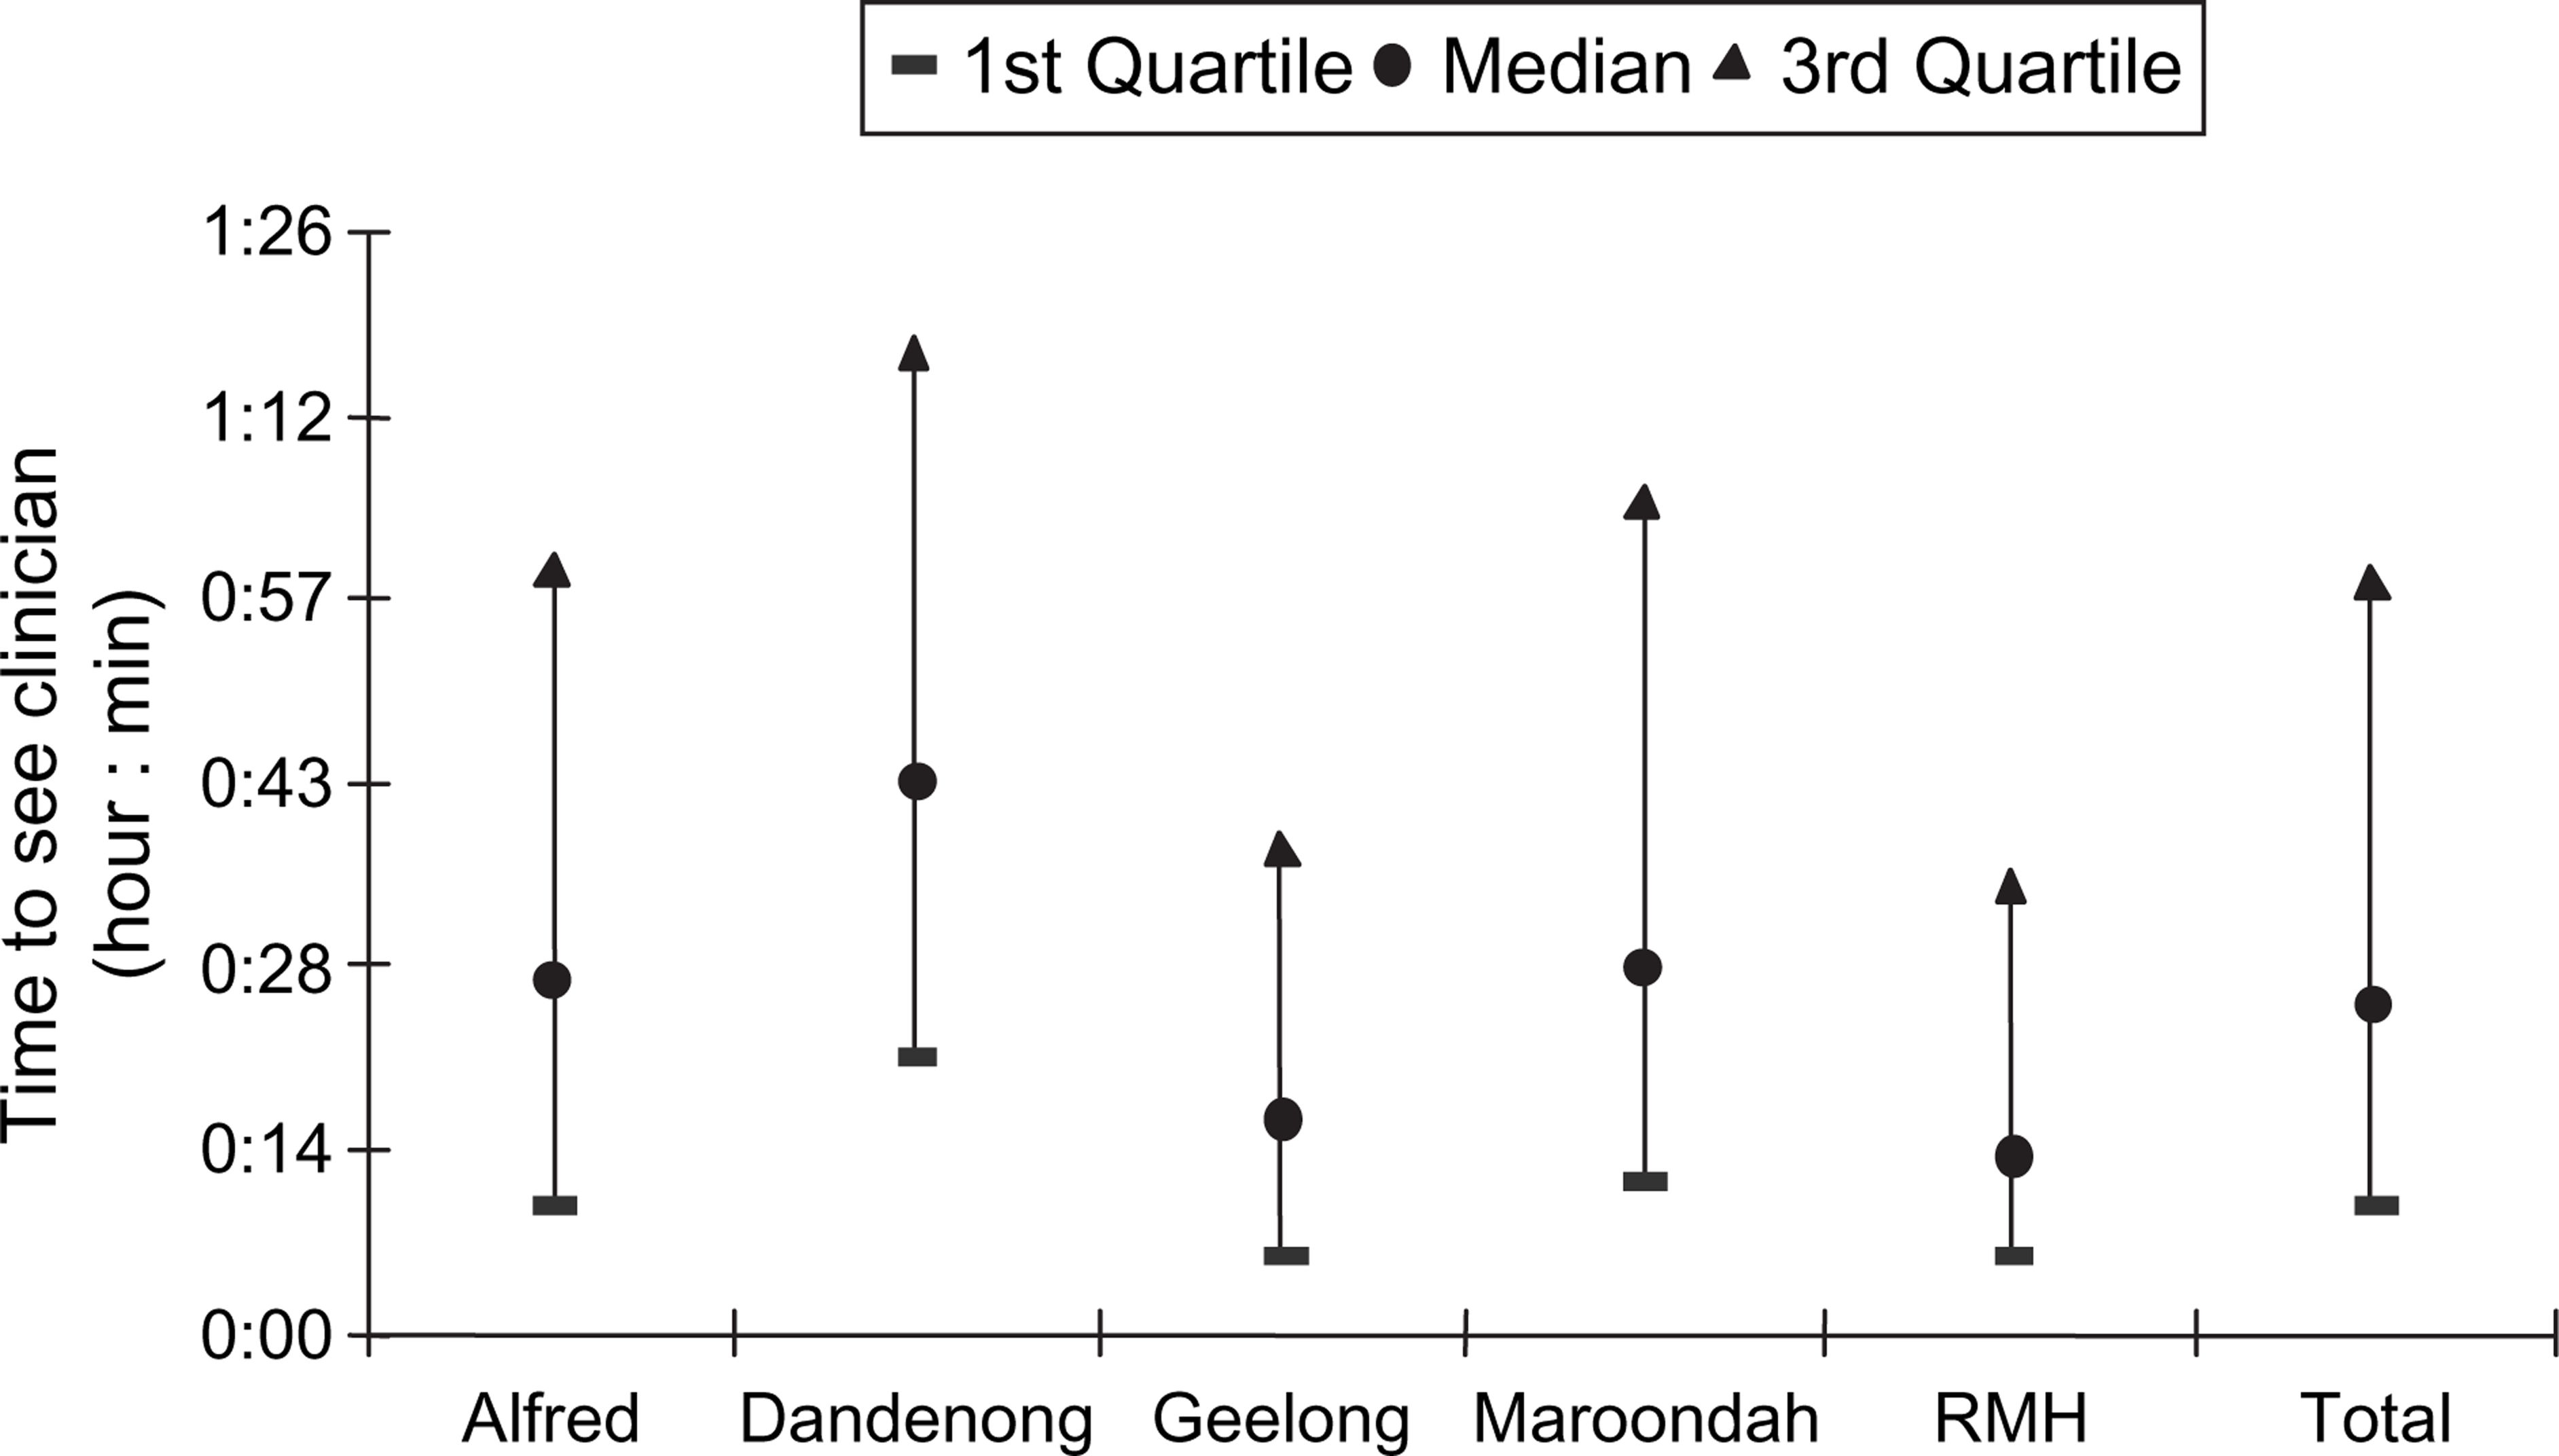
Most patients were young adults, a small majority male, and most lived with someone else (Table 3). Although more than one-quarter self-presented, the majority arrived by ambulance or with the police. Approximately one-third were current patients of MH services and three-quarters had had some contact.
Characteristics of mental health patients presenting to emergency departments
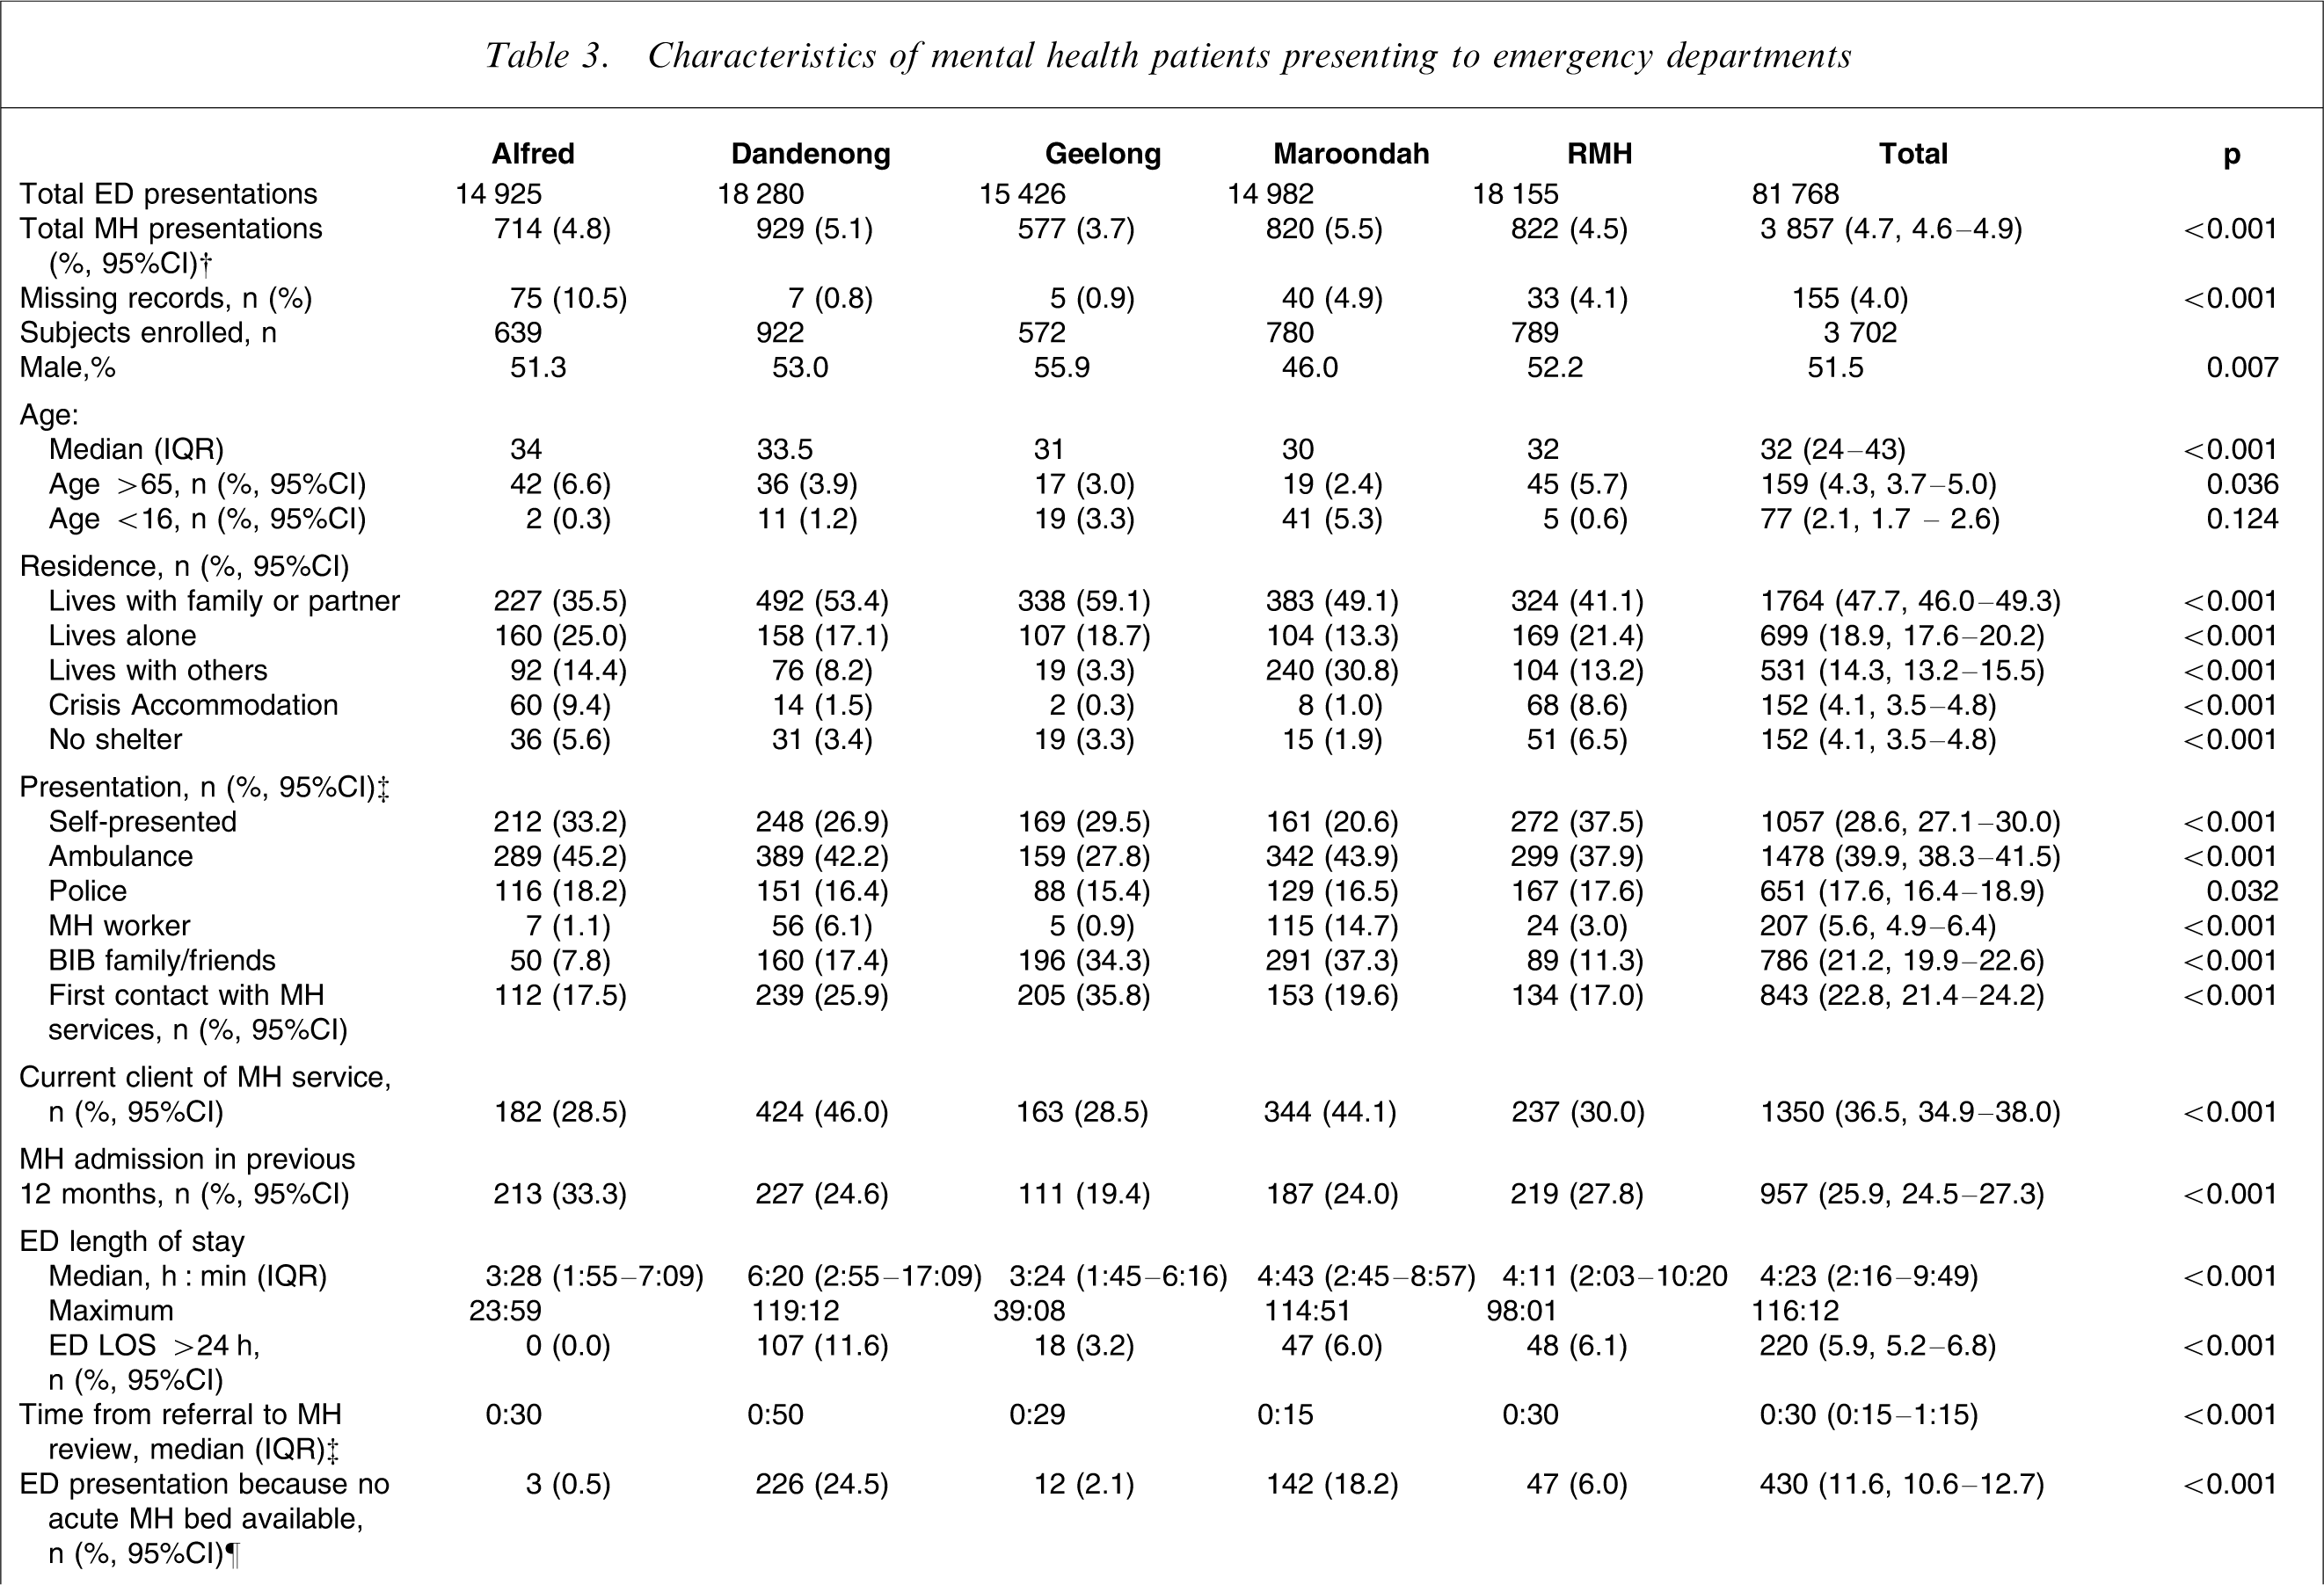
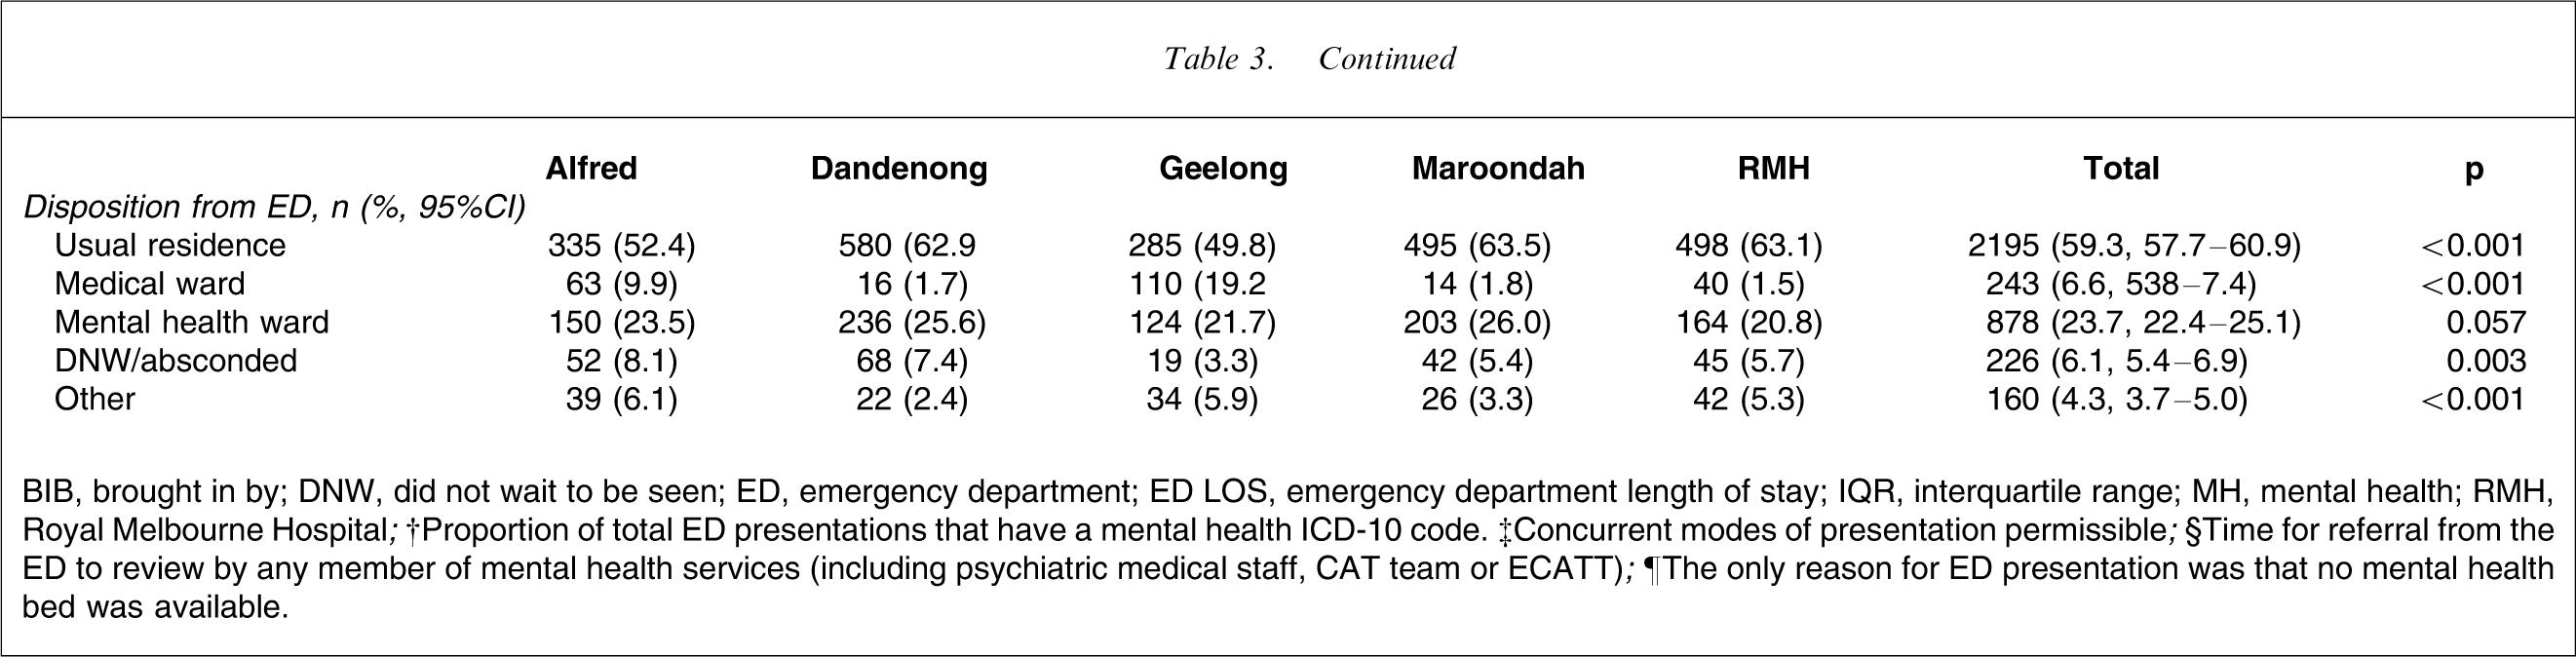
BIB, brought in by; DNW, did not wait to be seen; ED, emergency department; ED LOS, emergency department length of stay; IQR, interquartile range; MH, mental health; RMH, Royal Melbourne Hospital.
†Proportion of total ED presentations that have a mental health ICD-10 code. ‡Concurrent modes of presentation permissible.
§Time for referral from the ED to review by any member of mental health services (including psychiatric medical staff, CAT team or ECATT).
¶The only reason for ED presentation was that no mental health bed was available.
Table 3 shows that there was significant variation in the ED length of stay (LOS) across the five sites, with the proportion staying >24 h in ED varying from 0% to 11.6%. The proportion of presentations only because no MH bed was available also varied significantly between 0.5% and 24.5%. When the reason for presentation was only that no acute MH bed was available, the median ED LOS was 17 h 39 min (interquartile range (IQR) = 5:18–25:54), which is significantly longer than the whole sample (p < 0.001). The proportion of this subgroup who spent more than 24 h in the ED increased to 29.8% (95%CI = 25.5–34.4). Compared to the other MH patients arriving in the ED, this subgroup were less likely to be intoxicated (17.2%, 95%CI = 13.8–21.2 vs 33.0%, 95%CI = 31.5–34.5, p < 0.001), but more likely to arrive on a revoked community treatment order (7.9%, 95%CI = 5.6–11.0 vs 1.7%, 95%CI = 1.3–2.2, p < 0.001), require a nursing special (51.6%, 95%CI = 46.8–56.4 vs 9.7%, 95%CI = 8.8–10.7, p < 0.001), admission to a psychiatric ward (87.4%, 95%CI = 83.9–90.4 vs 23.7%, 95%CI = 22.4–25.1, p < 0.001) or involuntary admission (58.4%, 95%CI = 53.5–63.1 vs 14.6%, 95%CI = 13.5–15.8, p < 0.001).
Following ED assessment, 90.6% of patients were referred to an MH service (CAT, ECAT or inpatient unit). The median time to review was 30 min (IQR = 15–85). Dandenong Hospital had the longest median time to review. There was a delay to review by MH services of >6 h for 3.2% of patients (95%CI = 2.7–3.8). This group had an increased rate of documented intoxication compared to the whole sample (66.1% vs 32.9%, p < 0.001) and were more likely to present after hours (16.00–08:00 hours; 81.4% vs 68.3%, p = 0.003).
Table 3 also shows that there was variability in the disposition of MH patients across the five sites with significant differences in the proportions admitted to medical wards or who left before treatment commenced or finished. By comparison, 61.7% of non-MH ED presentations over the same period were discharged to their usual residence, 24.7% were admitted to a ward, 3.6% were admitted to SSU (Short Stay Unit), 4.7% did not wait to be seen and 0.8% absconded after treatment commenced [10].
A security code for an unarmed threat (Code Grey) was called for 303 patients (8.2%, 95%CI = 7.3–9.1). Physical restraint was required for 151 patients (4.1%, 95%CI = 3.5–4.8) but there was significant site variability from 1.8% at Dandenong Hospital to 9.5% at Royal Melbourne Hospital (p < 0.001). The median time that physical restraint was required was 180 min (IQR = 60–360), with a maximum time of 2340 min (39 h). Chemical restraint was required for 394 patients (10.6%, 95%CI = 9.7–11.7) using one or more drugs. Diazepam (41.9% of chemical restraint, 95%CI = 37.0–47.0) and midazolam (36.3%, 95%CI = 31.6–41.3) were most commonly used, followed by droperidol (24.9%, 95%CI = 20.8–29.5). The most common of the newer atypical neuroleptics used was olanzepine (11.4%, 95%CI = 8.5–15.1), which surpassed one of the traditional agents used for chemical restraint, haloperidol (6.3%, 95%CI = 4.2–9.3) [12]. Overall, 359 patients (9.7%, 95%CI = 8.8–10.7) required nurse specialling.
Table 4 shows that most patients were not intoxicated. Of those who were, the commonest drug was alcohol and the usual drugs of abuse were well represented. Table 4 also shows that the majority of patients required no investigation, and radiological testing or urine drug screens were rarely performed.
Proportions of mental health patients intoxicated and investigated in the emergency department
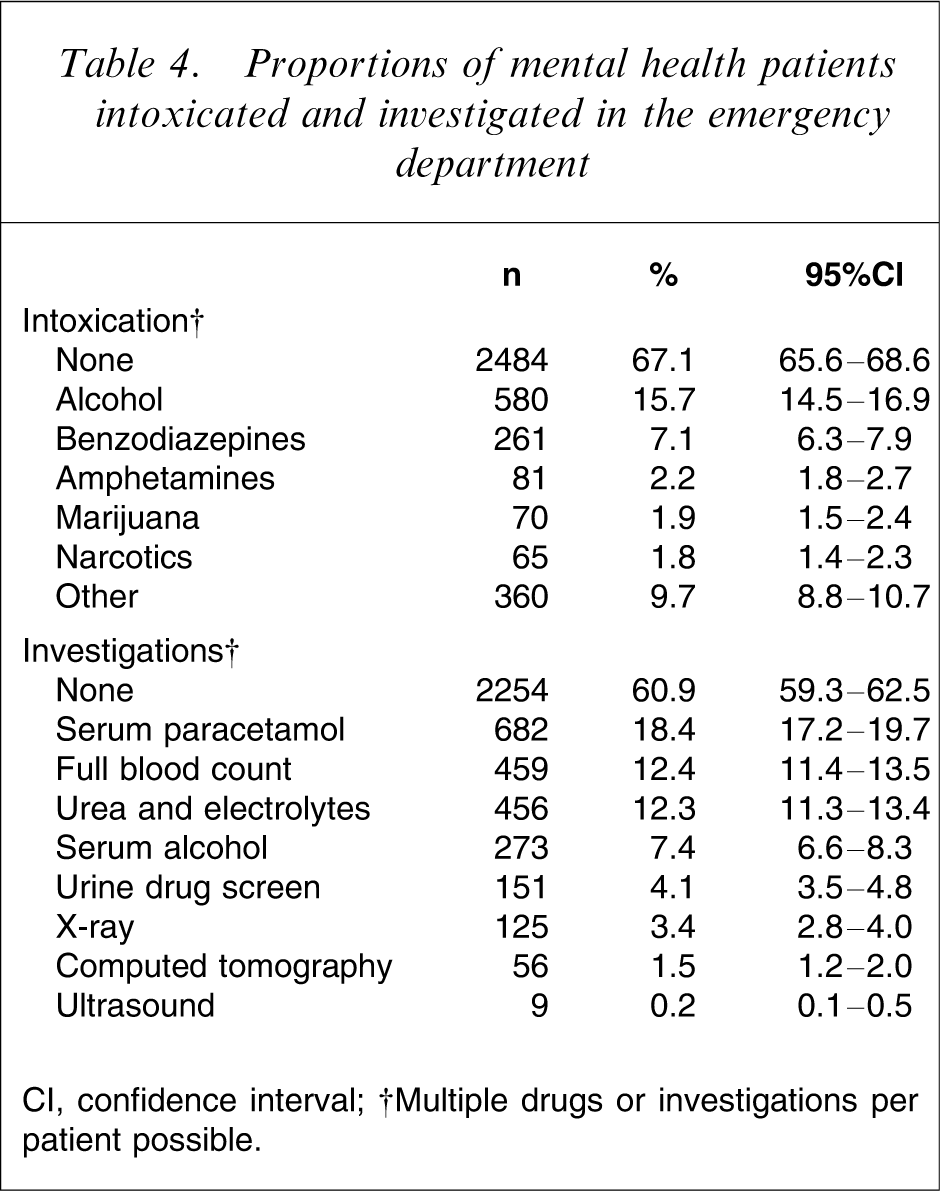
CI, confidence interval.
†Multiple drugs or investigations per patient possible.
The causes for MH presentation to the ED were classified using 18 pre-determined categories; these are presented in Table 5. The most common causes for presentation are related to depression and self-harm, although nearly 20% had some form of psychosis.
Mental health issues leading to emergency department presentation
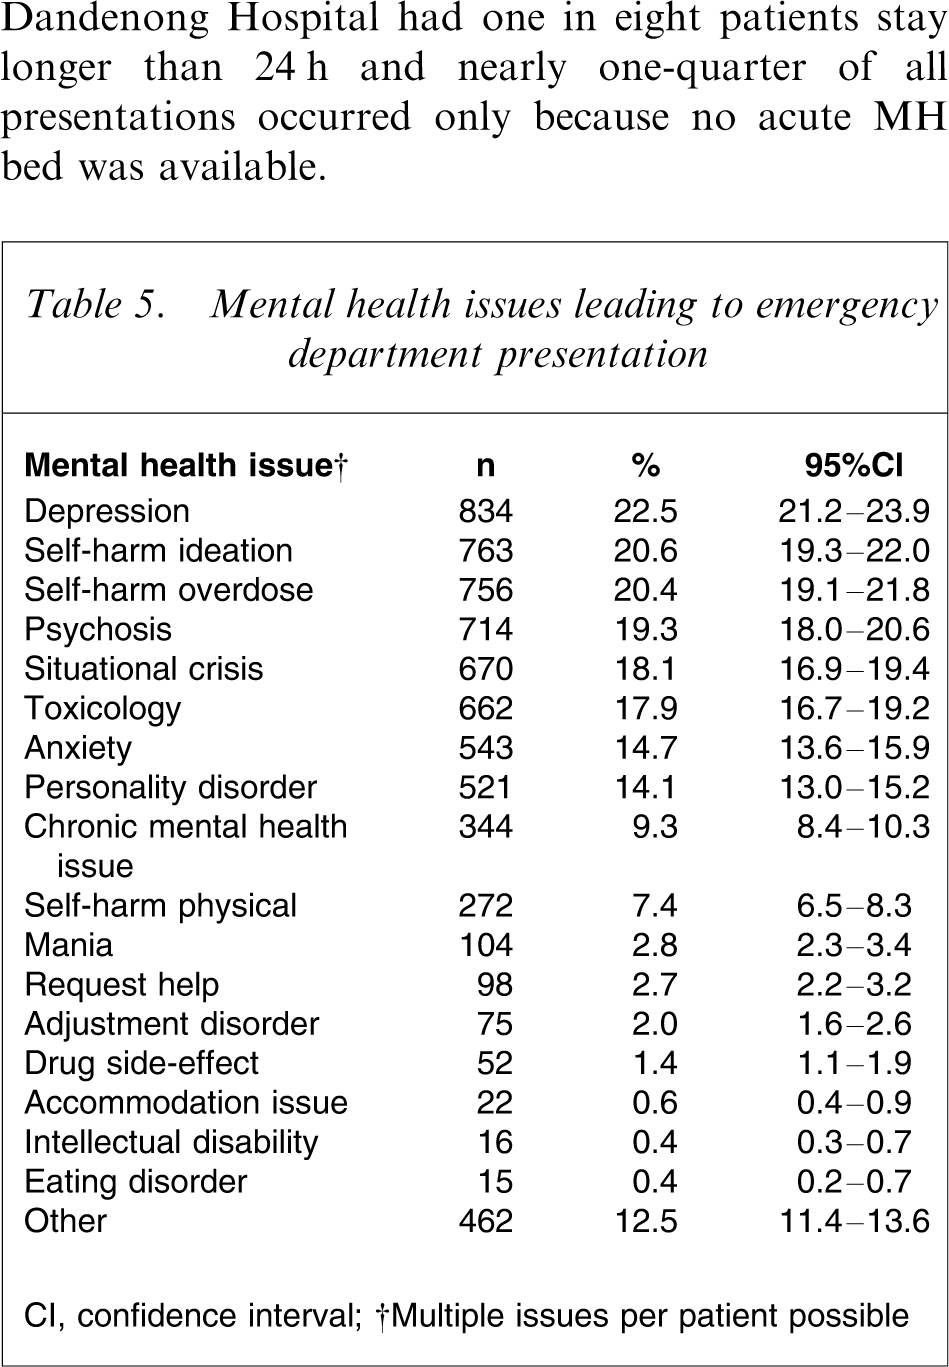
CI, confidence interval.
†Multiple issues per patient possible
Discussion
The present study describes the practice in five Victorian EDs due to MH presentations. It identified considerable variation in patient management and prolonged ED stays.
The 2005 report Not for service published by the Mental Health Council of Australia notes that Victoria performs well on the macro scale having embraced de-institutionalization and increased community MH funding over the last decade [13]. However, two issues of greatest concern to MH patients and their carers were identified as: (i) continued and widespread difficulties in accessing acute care services, particularly through EDs of general hospitals; and (ii) a critical lack of MH beds, including not only acute care beds but also medium-term services [13].
The median ED LOS was 4½ h. However, considerable variation was evident across the sites and three sites recorded total LOS of >4 days. Those patients who stayed longer than 24 h were less likely to be intoxicated on arrival, suggesting that intoxication was not a factor for the prolonged stay. The proportion of patients who stayed longer than 24 h varied from 0% to 12%. Because sites had similar short waiting times to be seen, this factor is unlikely to have affected total LOS. Although sites with a higher proportion of patients staying longer than 24 h also had an increased delay to MH review, the median increase was only 20 min and unlikely to have an important impact on total LOS. The likely cause for the prolonged stay was inability to access inpatient beds.
The proportion of presentations only because no acute MH bed was available also varied considerably across the five sites. This subgroup of patients had high rates of ED resource utilization and greatly increased LOS. This subgroup represents a clear system failure where there is a recognized need for an inpatient bed but none is available. Geelong and Alfred Hospitals appeared to have better access to beds and consequently overall shorter ED LOS. These sites had very few presentations only because no acute MH bed was available. Conversely, Dandenong Hospital had one in eight patients stay longer than 24 h and nearly one-quarter of all presentations occurred only because no acute MH bed was available.
A considerable proportion of patients were known to MH services. It is reasonable to expect that they had been advised how to access MH services in times of crisis. Attendance at the ED by those known to MH services may be due to non-adherence with advice, lack of timely access to those services or a perceived need by either the patient or MH provider that the ED was the preferred environment for this episode. However, because a majority of MH presentations arrived by either ambulance or police, it is possible that intervention by emergency services prevented community management of the mental health issue.
The median time to see a clinician was relatively short. This may have resulted in the small number of “did not waits” (DNW). However, it is also possible that this population had a lower threshold for leaving the ED if not promptly attended. The relatively small contribution of waiting time to total ED LOS is also noteworthy.
The level of drug and alcohol intoxication is consistent with previous studies [14, 15]. There was an increased incidence of intoxication for patients who stayed between 12 h and 24 h. Typically, ED management of MH patients precludes MH assessment when the patient is intoxicated. MH wards do not readily accept patients while intoxicated and medical wards may not be able to provide a secure environment for MH patients at risk. The ED currently provides a management setting for patients with a combination of MH issues and intoxication. Although this might be regarded as a core ED activity, if ED LOS >12 h is regarded as undesirable, alternative models and environments should be sought to allow co-management of MH issues and intoxication in order to improve patient flow.
The majority of patients did not have investigations in the ED. The tests that were performed included routine screening blood tests, alcohol or paracetamol levels. Few patients had radiological assessment or urine drug screening. Patients arriving without intoxication were even less likely to have investigations. Although some MH services refer patients to the ED to screen for organic illness, very few patients required tests that necessitated ED assessment. An alternative strategy may be to manage the patient at a site (home, clinic or ward) appropriate for the severity of their mental illness, perform local testing and refer to the ED only if warranted by the results.
The median time from referral to review by MH services was 30 min. Long delays (>6 h) were associated with intoxication and may indicate an inability or unwillingness to assess the patient earlier. Sites without 24 h ED-based MH services also had increased delays to review for after-hours presentations.
More than 10% of patients were specialled. This is an important resource issue for EDs because most are not secure environments for MH patients at risk of self-harm, harm to others or absconding. Future ED design may need to accommodate the longer duration of stay for these patients unless alternative strategies can be developed.
Several limitations of the present study are evident. A small proportion of histories were unavailable for review and this may have introduced selection bias. In addition, the study was conducted over a 5 month period from May to October and there may have been seasonal variation in MH presentations and subsequent management.
The ICD-10 code is the final diagnostic category given. There is only one code per presentation and this may not reflect the combination of factors that led to the presentations. In addition, a number of different codes can be used to describe similar presentations, for example attempted suicide by overdose could be coded as depression, poisoning or suicide, with or without intoxication. Patients with particular injuries secondary to self-harm may not have been identified if they were coded as trauma patients [16]. However, the ICD-10 code is the means by which institutions, including hospitals and State Government evaluate ED populations. In addition, a more detailed description of the presentations was provided by identifying one or more categories of mental illness for each patient (Table 5).
Because DNW indicates that no clinician assessed the patient, it was often not possible to provide an ICD-10 code. Hence, patients who were DNW were underrepresented.
These limitations aside, several recommendations can be made. Alternative models of care including MH short-stay units and bed substitution must be evaluated to prevent ED stays, on a trolley, of up to 5 days. These models need to provide a safe environment for patients and management of comorbidities, especially intoxication.
All EDs should have 24 h on-site MH services. In the present study the sites without 24 h access had the highest proportions of prolonged ED stays. Improved access to MH services may decrease the proportion of prolonged stays and also allow early intervention and management for patients who must remain in the ED.
Some sites have greater difficulty in maintaining the flow of MH patients through the ED. This may be related to variability in resources such as bed availability and on-site MH review. All components of MH care should be evaluated to determine where bottlenecks occur and why there is so much variation across sites. This will require cooperative input from State and Federal governments, institutions, community services, patients and their carers.
Footnotes
Acknowledgements
The authors wish to acknowledge the support of staff at each research site, Professor Peter Cameron and Ms Carmel Italiano at the Alfred Hospital, Johannes Wenzel and Ms Jill Simpson at Dandenong Hospital, Dr John Pasco and Ms Karen Spinks at Geelong Hospital and Dr Peter Archer and Ms Gina Lloyd-Thomas at Maroondah Hospital. This study was supported by an NHMRC scholarship and by a grant from the Victorian Department of Human Services.