
Abstract
Stephen T Hammett, Mark A Georgeson, Gillian S Barbieri-Hesse, 2003 “Motion, flash, and flicker: A unified spatiotemporal model of perceived edge sharpening” Perception
Figures 1a – 1c and 2 of this paper (page 1223) are incorrect as printed. Correct versions are shown below.
(a) The range of variation in luminance profiles of stimuli from square wave to sinusoid. The solid curve is a blur profile constructed by replacing the square-wave edges with sine-wave half-periods centred on the edges. Edge blur width is defined by this half-period, in minutes of arc. (b) Example of the sigmoidal transducer function defined by equation (1). (c) How a blurred grating (solid curve) is sharpened (dashed curve) by the transducer shown in (b). (d) Layout of the two stimulus windows on the display screen; shown to scale for an edge width of 60 min of arc (spatial frequency, 0.25 cycle deg−1).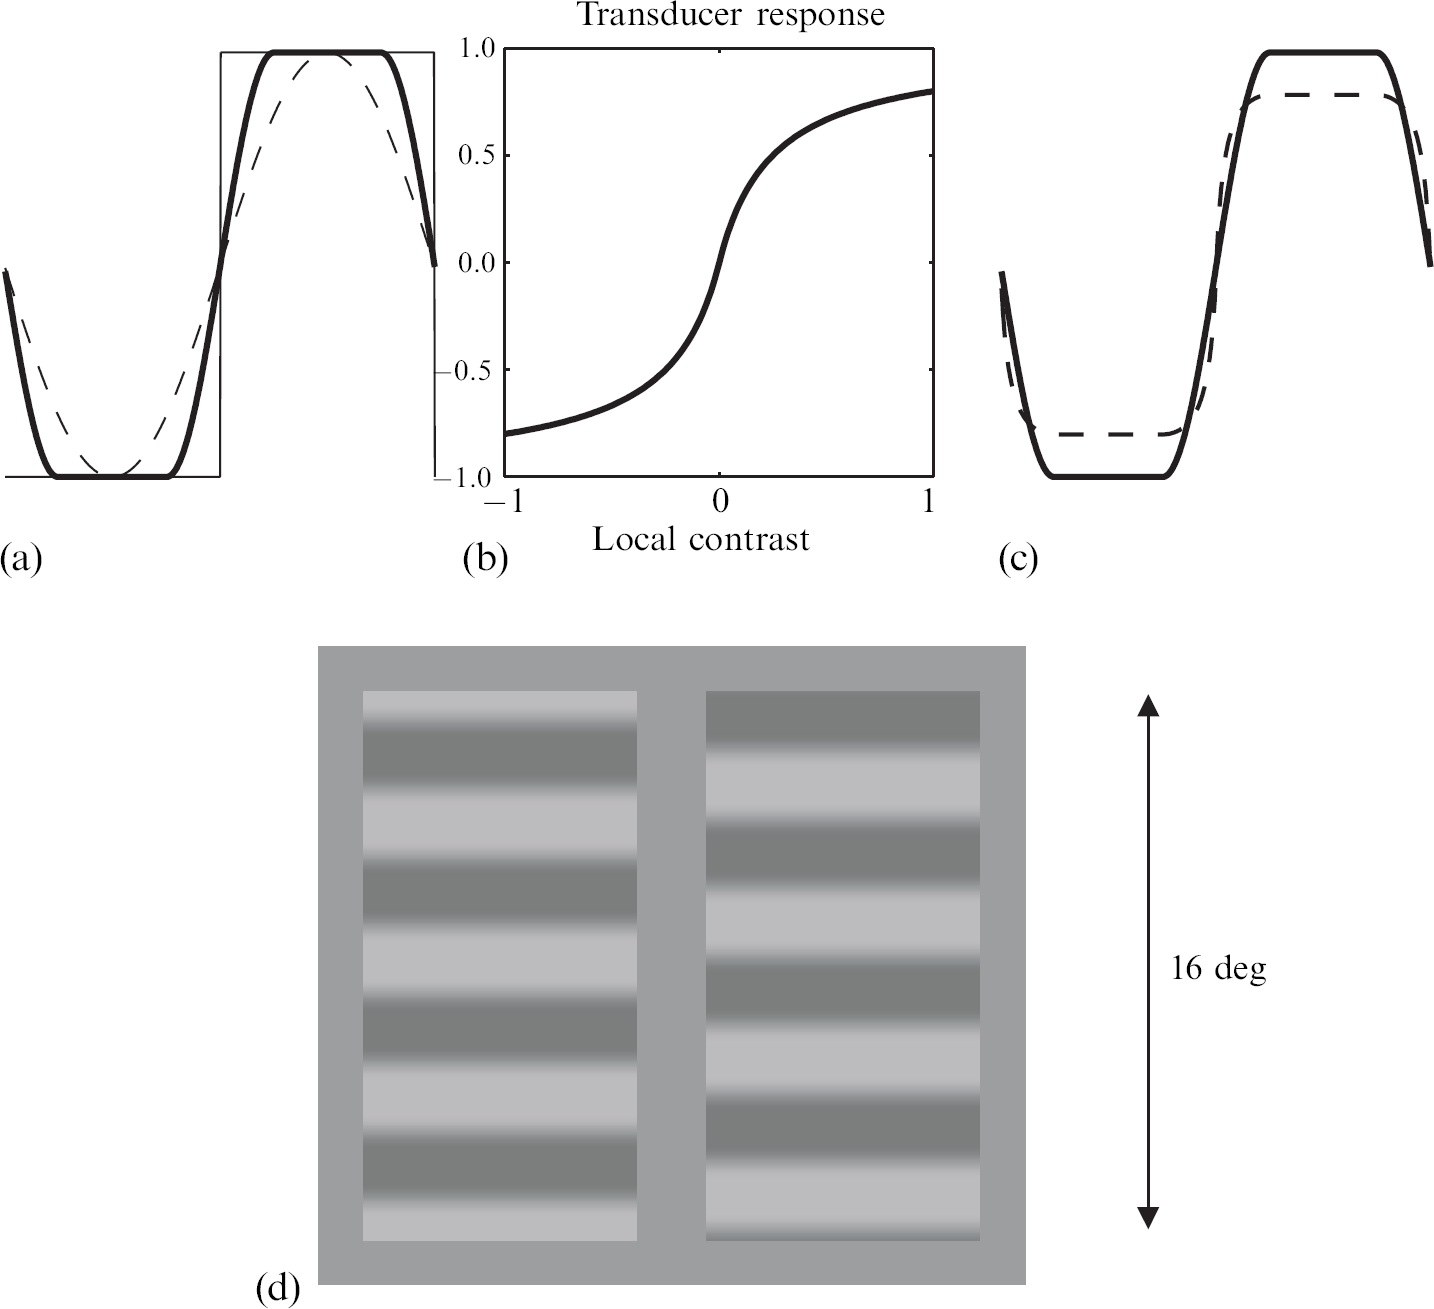
Block diagram of the transducer model, with dynamic contrast gain control (Hammett et al 2003).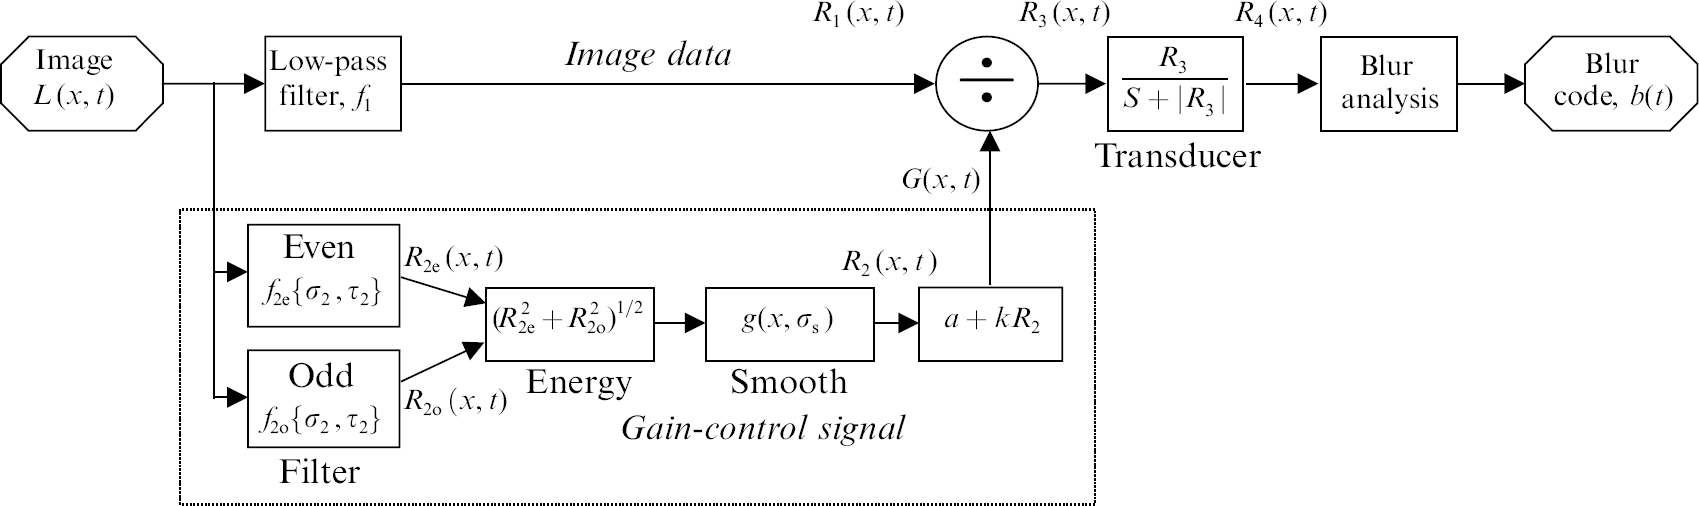
Get full access to this article
View all access options for this article.