
Abstract
The effect of dietary chromium supplementation on glucose and insulin metabolism in healthy, non-obese cats was evaluated. Thirty-two cats were randomly divided into four groups and fed experimental diets consisting of a standard diet with 0 ppb (control), 150 ppb, 300 ppb, or 600 ppb added chromium as chromium tripicolinate. Intravenous glucose tolerance, insulin tolerance and insulin sensitivity tests with minimal model analysis were performed before and after 6 weeks of feeding the test diets.
During the glucose tolerance test, glucose concentrations, area under the glucose concentration-time curve, and glucose half-life (300 ppb only), were significantly lower after the trial in cats supplemented with 300 ppb and 600 ppb chromium, compared with values before the trial. Fasting glucose concentrations measured on a different day in the biochemistry profile were also significantly lower after supplementation with 600 ppb chromium. There were no significant differences in insulin concentrations or indices in either the glucose or insulin tolerance tests following chromium supplementation, nor were there any differences between groups before or after the dietary trial.
Importantly, this study has shown a small but significant, dose-dependent improvement in glucose tolerance in healthy, non-obese cats supplemented with dietary chromium. Further long-term studies are warranted to determine if the addition of chromium to feline diets is advantageous. Cats most likely to benefit are those with glucose intolerance and insulin resistance from lack of exercise, obesity and old age. Healthy cats at risk of glucose intolerance and diabetes from underlying low insulin sensitivity or genetic factors may also benefit from long-term chromium supplementation.
Chromium is an essential trace element required for normal carbohydrate and lipid metabolism (Anderson 1986). Improvements in glucose tolerance in animals following chromium supplementation were first reported in 1959 (Mertz & Schwarz 1959). It is thought that chromium improves glucose tolerance by increasing or potentiating insulin's effects on glucose uptake and utilisation, that is, increasing insulin sensitivity (Anderson et al 1983). With greater insulin effectiveness, blood glucose concentrations decrease. Chromium supplementation has been shown to influence glucose metabolism in normal dogs, humans, growing pigs and calves (Riales & Albrink 1981, Bunting et al 1994, Amoikon et al 1995, Spears et al 1998). Improved glycaemic control has also been documented in obese humans and type 2 diabetics (Evans 1989, Djordjević et al 1995, Anderson et al 1997). Conversely, in studies of long-term total parenteral nutrition in humans, chromium deficiency led to the development of hyperglycaemia, impaired glucose tolerance and insulin resistance, which was reversed by administration of trivalent chromium (Jeejeebhoy et al 1977, Freund et al 1979, Brown et al 1986).
Markedly reduced insulin sensitivity, that is, insulin resistance, is a hallmark of type 2 diabetes in humans and is a feature of feline diabetes (Porte 1991, Feldhahn et al 1999). Obesity decreases insulin sensitivity, and is a recognised risk factor for impaired glucose tolerance and type 2 diabetes in cats and humans (Panciera et al 1990, Harris 1995, Scarlett & Donoghue 1998). Lack of exercise also decreases insulin sensitivity in humans, predisposing to diabetes (Regensteiner et al 1991, Harris 1995). Many urban cats, particularly indoor cats, are inactive and overweight, and their lifestyle changes parallel humans considered at risk for diabetes (Brand Miller & Colagiuri 1994). Like humans, some cats appear to have underlying low insulin sensitivity and are predisposed to develop glucose intolerance if they gain weight (Appleton et al 2001a). Mechanisms aimed at improving insulin sensitivity may be beneficial in delaying the onset of glucose intolerance and type 2 diabetes mellitus in at risk cats. If a simple, nutritional supplement such as chromium tripicolinate was found to enhance insulin action or improve glycaemic control, it could produce life-long health benefits for cats. Incorporation of chromium directly into the dietary formulation would avoid the inconvenience of direct dosing, and may be more effective.
Although chromium supplementation has been shown to be beneficial in other species, there are no studies reported in cats evaluating the effect chromium, incorporated in the dietary formulation, on glucose tolerance or insulin sensitivity. In addition, no minimal effective concentration has been identified for cats. Determination of these factors could be of significant clinical benefit, and lead to improvements in the formulation of feline diets to help prevent and manage obesity and diabetes in cats.
This study was undertaken to assess the effect of diets supplemented with chromium tripicolinate on glucose tolerance, insulin tolerance and insulin sensitivity in healthy, non-obese cats. Additionally, the study aimed to identify the minimal effective concentration of chromium required in feline diets to significantly effect carbohydrate metabolism.
Materials and methods
In a double-blind, randomised study, 32 non-obese cats were randomly allocated one of four test diets consisting of a standard diet either without added chromium (control diet), or supplemented with 150 ppb, 300 ppb, or 600 ppb added chromium as chromium tripicolinate. Glucose tolerance, insulin tolerance and insulin sensitivity tests with minimal model analysis were performed before, and after 6 weeks of feeding the test diets.
Animals and dietary treatments
Thirty-two healthy, non-obese cats (14 castrated males and 18 spayed females) were randomly sourced for use in the study. Accurate ages of the cats were unknown, however all were estimated by visual assessment and examination of dentition, to be between 1 and 5 years of age. The protocol for this study and the care and handling of cats were approved by the Animal Experimentation Ethics Committee of the University of Queensland.
For 2 weeks preceding the study, cats were fed a standard diet containing no additional chromium (control diet) prior to being randomised to one of four groups of eight cats. The four test diets were then randomly allocated to each group of cats. Each cat was individually housed and fed its allocated test diet once daily for 6 weeks.
Mean initial weight of the cats was 4.5 ± 0.79 kg, (range 3.3–6.25). Weight change was restricted to a maximum of 10% bodyweight over the 6-week trial. Cats were fed between 60 kcal/kg and 70 kcal/kg of bodyweight per day to maintain bodyweight within this range (Case et al 1995). Food bowls were weighed daily prior to, and after each feeding, to calculate the amount of food and chromium consumed. Cats were allowed free access to water at all times.
Experimental protocol
At least 24 h before testing, cats were anaesthetised with propofol (Diprivan 10 mg/ml; Zeneca Ltd), given as an initial bolus dose of 6 to 7 mg/kg followed by additional doses of 5 to 10 mg as required. Jugular catheters (18 gauge×8 cm polyurethane jugular catheters; Cook Veterinary Products), were placed into a single jugular vein while under general anesthesia. Catheters were flushed twice daily with heparinised saline to maintain patency. Blood was drawn from each cat before and after 6 weeks of feeding the test diets, for complete blood counts and serum biochemistry analyses.
Food bowls were removed a minimum of 12 h prior to each test. Glucose tolerance, insulin tolerance, and insulin sensitivity tests were performed on separate days in each cat, before and after 6 weeks of feeding the test diets. Insulin sensitivity tests were performed in the mornings, while insulin tolerance tests and glucose tolerance tests were performed in the early afternoons. Cats were fed immediately after each test was completed. Each cat underwent a maximum of one test per 24-h period.
Blood samples were collected at various times during each test. Prior to each blood collection, 1 ml of blood was removed to clear the catheter of saline-diluted blood. After each collection, this 1 ml of saline-diluted blood was reinjected. To maintain blood volume and to flush the catheter, a volume of saline solution equal to the volume of blood removed was injected. To maintain red blood cell mass, any red cells remaining in EDTA tubes after plasma was removed were washed and autotransfused instead of saline at certain collection times as previously described (Appleton et al 2001b).
Glucose tolerance tests
Blood samples (4 ml), were collected prior to (0 min) and at 2, 5, 10, 15, 30, 45, 60, 90, and 120 min after glucose (50% Glucose Injection B.P.; Astra Pharmaceuticals) was administered at 0.5 gm/kg as a bolus dose over 30 s (Appleton et al 2001b).
The rate of disappearance for glucose (Kglucose) and the glucose half-life (T1/2) were calculated by linear regression analysis of the semilogarithmic plot of glucose concentration vs time between 15 and 90 min after glucose administration (Link & Rand 1998). Absolute glucose concentrations at 0, 60, 90 and 120 min were also used as a criterion for determining glucose tolerance (National Diabetes Data Group 1979, Link et al 1997). Area under the glucose and insulin curves depicting glucose or insulin concentrations over time during the glucose tolerance test, were calculated by the trapezoidal method for the entire 120 min test period (Rowland & Tozer 1989). The areas under the curves for insulin are expressed as units above each cat's nadir. Areas under the glucose curves were calculated as the total area between the horizontal axis and the concentration curve.
Insulin tolerance tests
Blood samples (2 ml), were collected prior to (0 min), and at 2, 5, 10, 15, 30, 45, 60, 90, and 120 min after 0.1 U/kg of regular human insulin (Actrapid, 100 U/ml; Nova Nordisk A/S) was administered as an intravenous bolus (Appleton et al 2001b).
The rate constant for the disappearance rate of glucose (Kitt), estimated from the slope of the regression line of the logarithm of blood glucose against time between 2 and 15 min of the test, was calculated as a measure of insulin sensitivity (Bonora et al 1989). During this period, it has been shown in humans that glucose declines linearly without the influence of counter-regulatory hormones (Gerich et al 1980, Bonora et al 1989, Akinmokun et al 1992). The mean residence time for insulin (MRT) was calculated in minutes (Rowland & Tozer 1995). Areas under the glucose and insulin curves were calculated from the trapezoidal method for the entire 120 min of the test (Rowland & Tozer 1989). The areas under the curves for insulin are expressed as units above each cat's nadir. Areas under the glucose curves were calculated as the area between the horizontal axis and the glucose concentration curve.
Insulin sensitivity tests
Four baseline blood samples (1 ml), were collected over 15 min before 0.3 gm/kg of glucose (50% Glucose Injection B.P.; Astra Pharmaceuticals) was administered as an intravenous bolus. Twenty-seven 1 ml blood samples were collected over the next 3 h. Twenty minutes after glucose injection, 0.05 U/kg of regular human insulin (Actrapid, 100 U/ml; Novo Nordisk A/S) was injected intravenously via the jugular catheter (Appleton et al 2001b).
Insulin sensitivity was determined using Bergman's minimal model, where a mathematical model of glucose disappearance is used to estimate insulin sensitivity (Bergman et al 1979). This method accounts for the effect of insulin and glucose on glucose disappearance and is based on the frequently sampled intravenous glucose tolerance test, modified to include an injection of both glucose and insulin (Finegood et al 1990, Welch et al 1990). The model provides an insulin sensitivity index (SI), defined as the ability of insulin to enhance glucose disappearance and to inhibit hepatic glucose production (Bergman et al 1979). This index is a measure of how a given change in plasma insulin can increase the clearance of plasma glucose (Beard et al 1986). A decreasing index value indicates that the subject is less sensitive to insulin. Glucose effectiveness (SG) indicates the effect of glucose itself, at basal insulin levels, to promote its own disposal through uptake into the tissues and suppression of endogenous glucose production (Bergman et al 1986).
Sample handling and analysis
Blood samples from each of the tests were handled similarly. Samples were placed into sterile EDTA vacuettes containing the proteinase inhibitor, aprotinin (Trasylol, Kallikrein Inactivator, 10 000 U/ml; Bayer Australia Ltd), added to the vacuettes at 0.05 ml per ml of blood. After collection, samples were kept on ice for 15 to 30 min until centrifugation at 1500 g for 8 min. After separation, plasma samples were split and stored in 500 μl vials at −70°C until assayed for glucose and insulin.
Glucose was measured in plasma using an automated glucose analyser (YSI 2300 Stat Plus; Yellow Springs Instrument Co.). Insulin was measured using a commercially available kit (Phadeseph Insulin RIA; Pharmacia & Upjohn Diagnostics AB), which has been validated for the detection of feline insulin (Lutz & Rand 1993).
Statistical analysis
For the variables investigated, the differences between groups either before and after the test period were examined using a one-way analysis of variance (ANOVA) with a statistical software package (SigmaStat, Version 2.0 for windows; SPSS Inc.). When significant differences were determined, comparisons were made using the Tukey test. For non-normally distributed data, a one-way ANOVA on ranks was performed. One-tailed paired t-tests were used to examine whether post-diet values were significantly different from pre-diet values within individual groups. For non-normally distributed data, signed rank tests were performed.
The use of a one-tailed test was justified by the priori hypothesis that that glucose concentrations and indices would be lowered (or increased for SI, SG, Kglucose and Kitt), by chromium supplementation.
All data are reported as mean ± 1 standard deviation (SD), followed by range in parentheses. A P-value <0.05 was considered significant.
Results
Food and chromium intake, bodyweight and health profiles
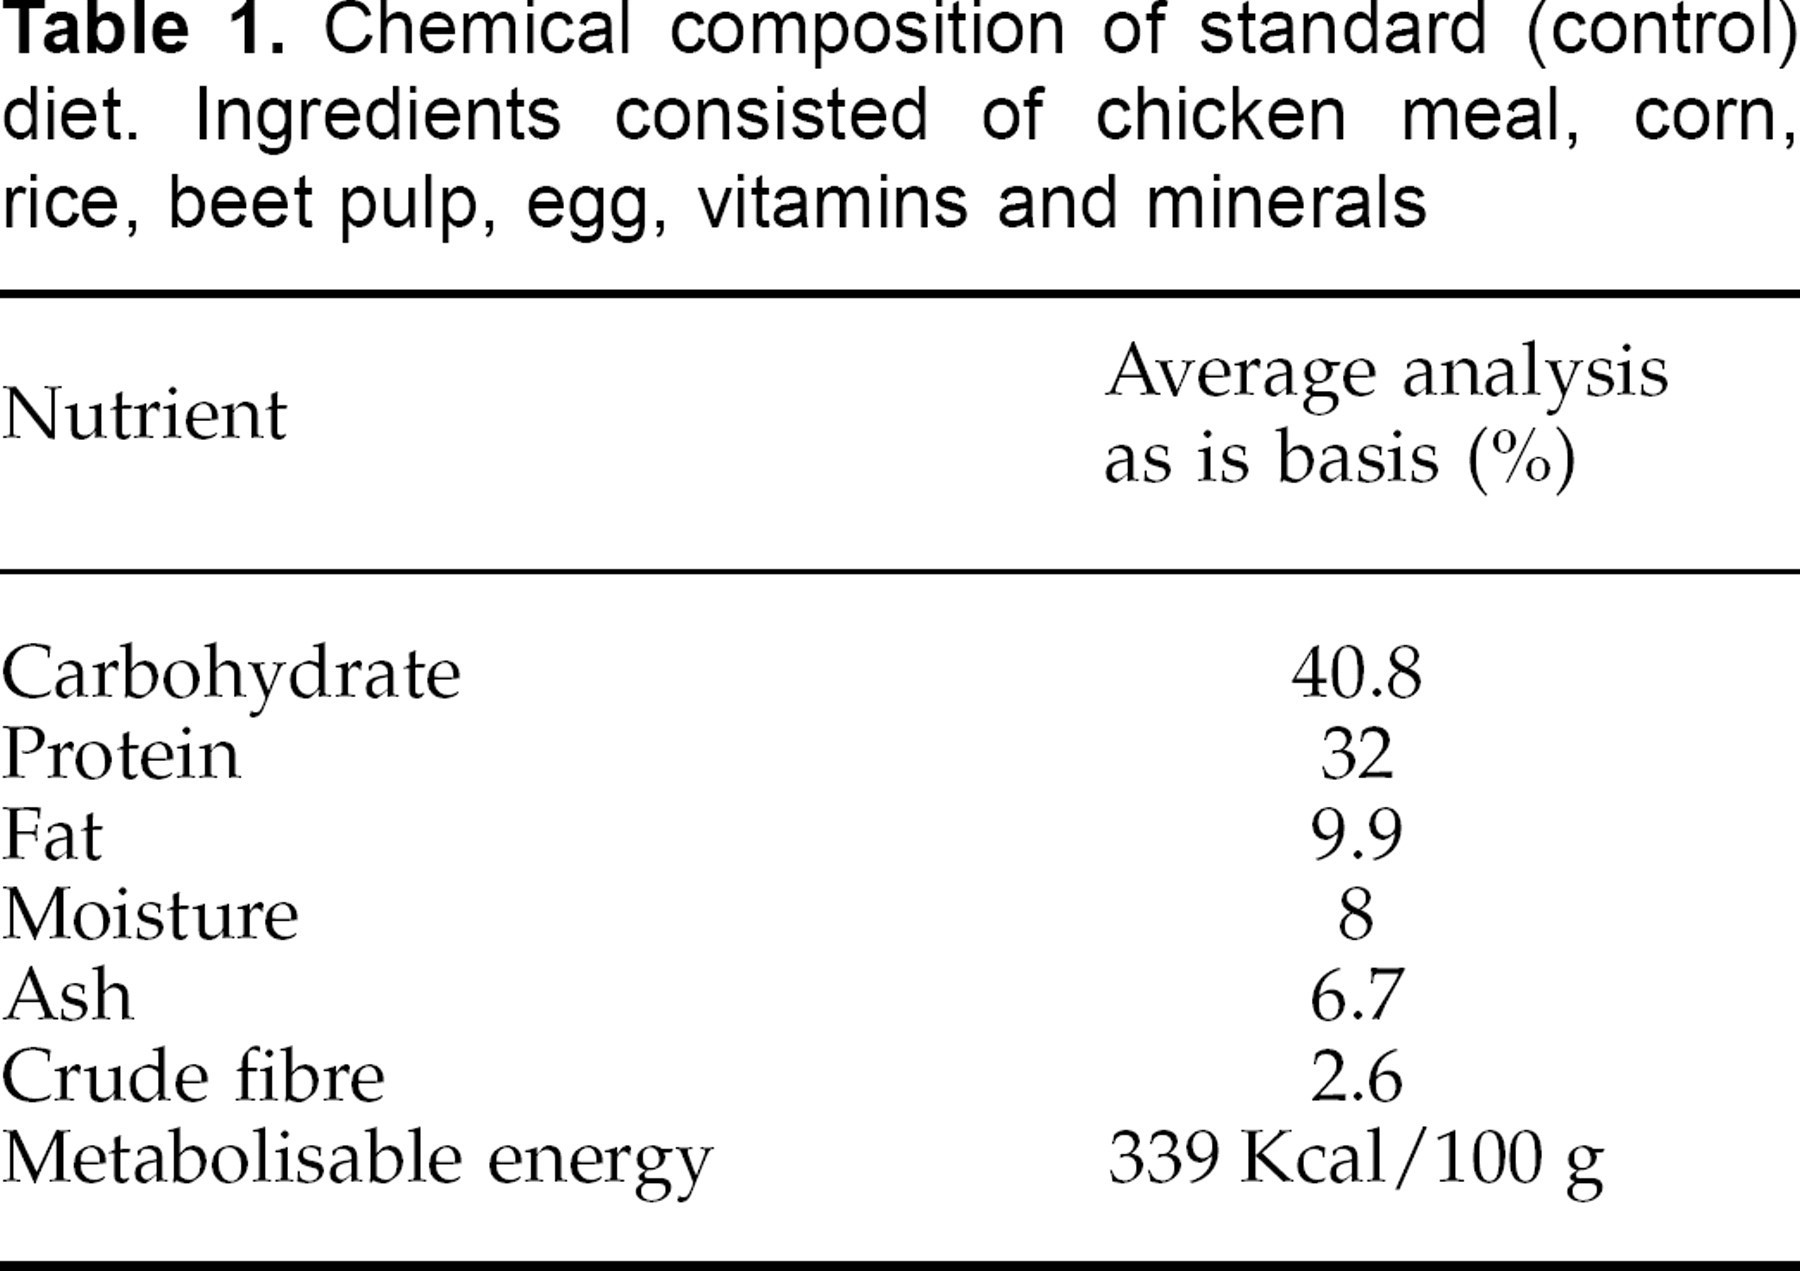
Nutritional composition of the standard (control) diet is shown in Table 1. Mean chromium intake per day over the 6-week trial differed between groups reflecting the difference in levels of dietary chromium supplementation (Table 2). Mean food intake per day was not significantly different between groups during the trial (Table 2).
Chemical composition of standard (control) diet. Ingredients consisted of chicken meal, corn, rice, beet pulp, egg, vitamins and minerals
Mean food intake over 6 weeks, chromium tripicolinate (CrPic) intake, and mean body weight gain for control cats, and cats supplemented with either 150, 300 or 600 ppb CrPic
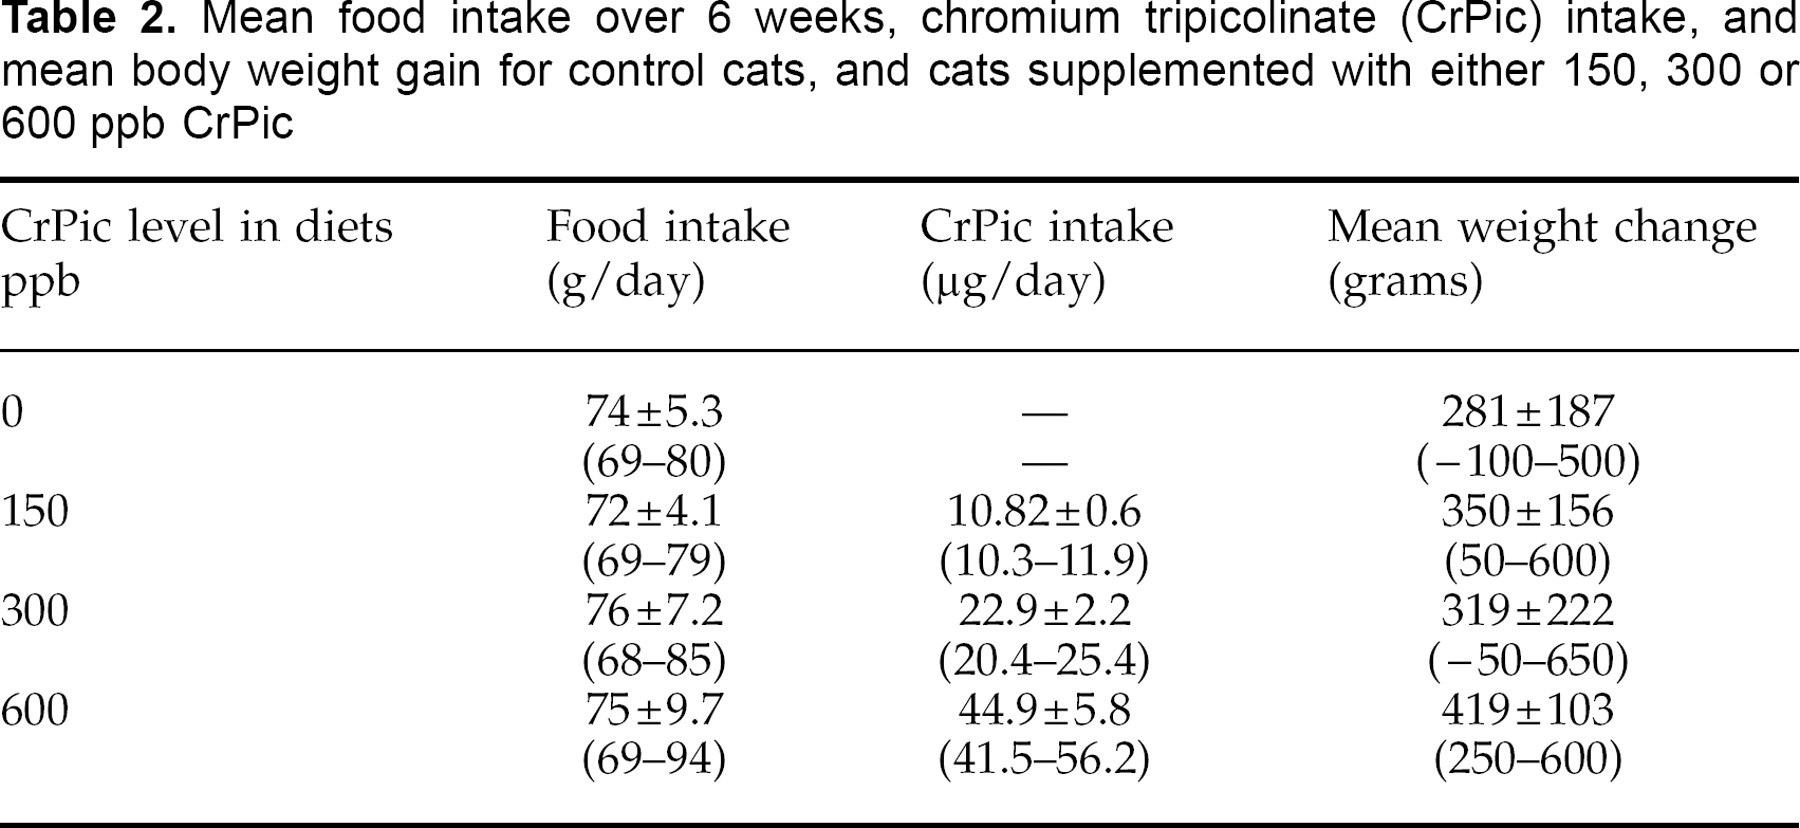
There was no significant difference between groups in bodyweight before or after the dietary trial. However, a significant increase in body weight occurred during the 6 weeks of the trial in every group, with the greatest increase in the 600 ppb-supplemented group (Table 2). The increase in weight was maintained at less than 10% for all cats, and mean bodyweight gain was 7.4% (0.33 kg per cat).
All biochemical and haematological parameters remained within the laboratory normal ranges during the 6 weeks of feeding the test diets (data not shown). Importantly, cats supplemented with chromium at 600 ppb had significantly lower serum glucose concentrations after the trial, compared to before the trial (7.72 ± 1.06 mg/dl and 8.31 ± 0.62 mg/dl, respectively). Mean fasting cholesterol remained unchanged after 6 weeks of chromium supplementation at any level.
Glucose Tolerance Test
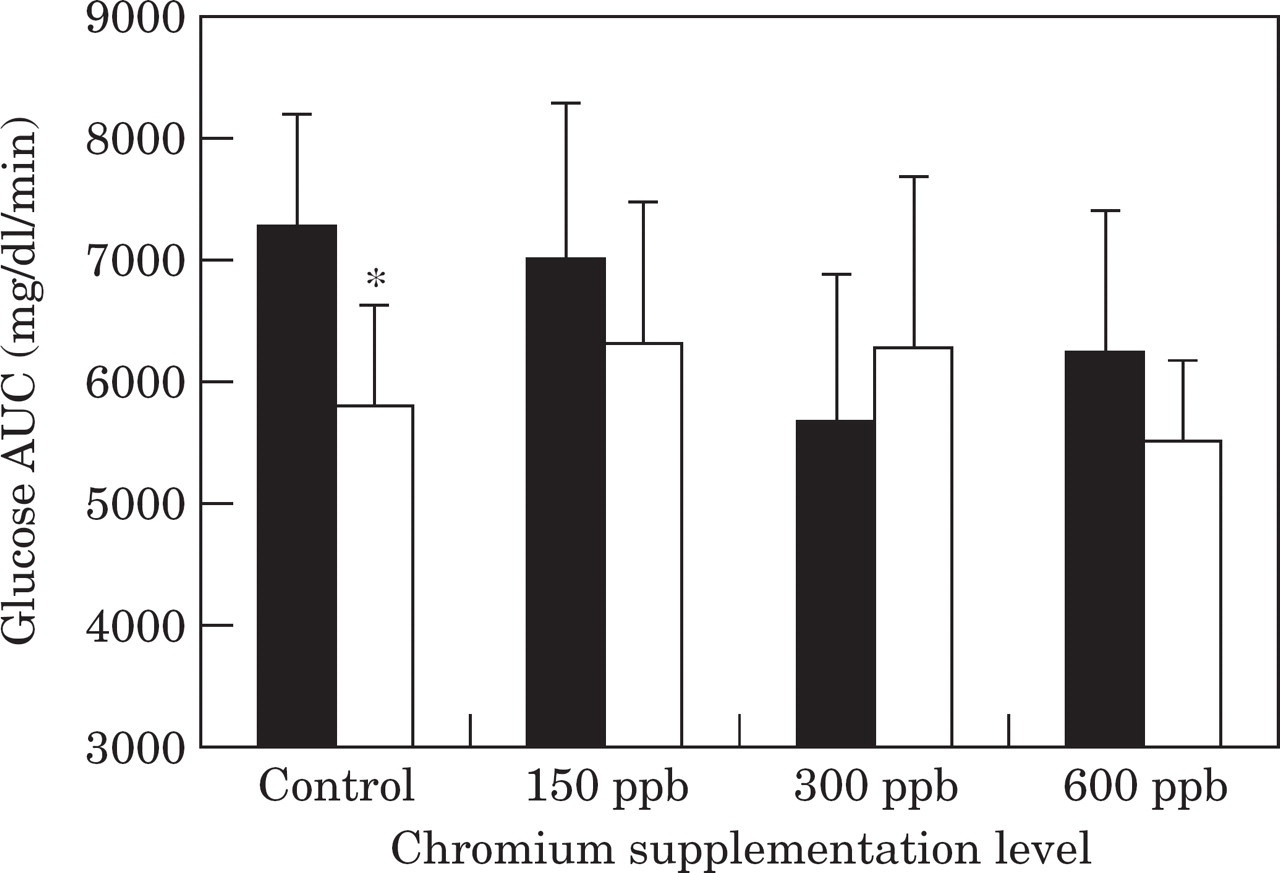
Plasma glucose concentrations at most time points, and area under the glucose curve (AUCglucose) in cats consuming 300 ppb and 600 ppb chromium, were significantly lower after 6 weeks of supplementation when compared to before the trial (Figs 1 and 2). In contrast, there was a non-significant trend to higher glucose concentrations and AUCglucose after the trial for control cats and cats fed the 150 ppb test diets compared to before the trial (Fig 2).

Mean plasma glucose concentrations during a glucose tolerance test before () and after ( ) the trial in control cats (a), and in cats supplemented with chromium at 150 ppb (b), 300 ppb (c), and 600 ppb (d). *Significantly (P<0.05) different values after the trial at timepoints indicated.
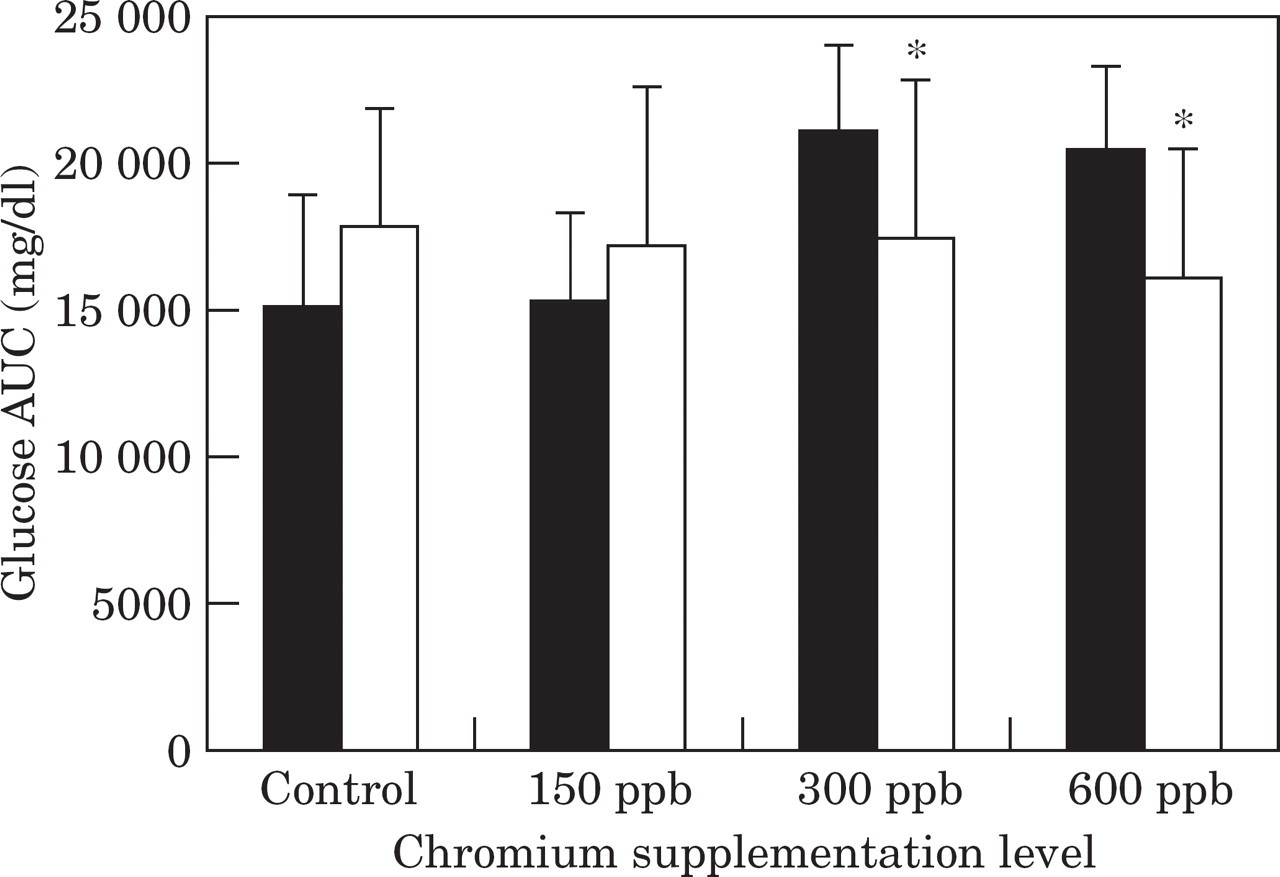
Mean area under the glucose curve (AUC) during a glucose tolerance test before (▄) and after (□) the trial in control cats, and cats supplemented with chromium at 150 ppb, 300 ppb, and 600 ppb. *Significantly (P<0.05) different values after the trial compared to before the trial.
Cats supplemented with 300 ppb chromium had a significantly (P=0.03) lower glucose half-life (T1/2) and significantly (P=0.03) higher glucose per cent disappearance per min (Kglucose) after the trial compared to before the trial (Fig. 3, Table 3). Although not significant at P<0.05, T1/2 also tended to be lower (P=0.058) and Kglucose tended to be higher (P=0.067) in the 600 ppb chromium supplemented group after the trial compared with before the trial (Fig. 3, Table 3).
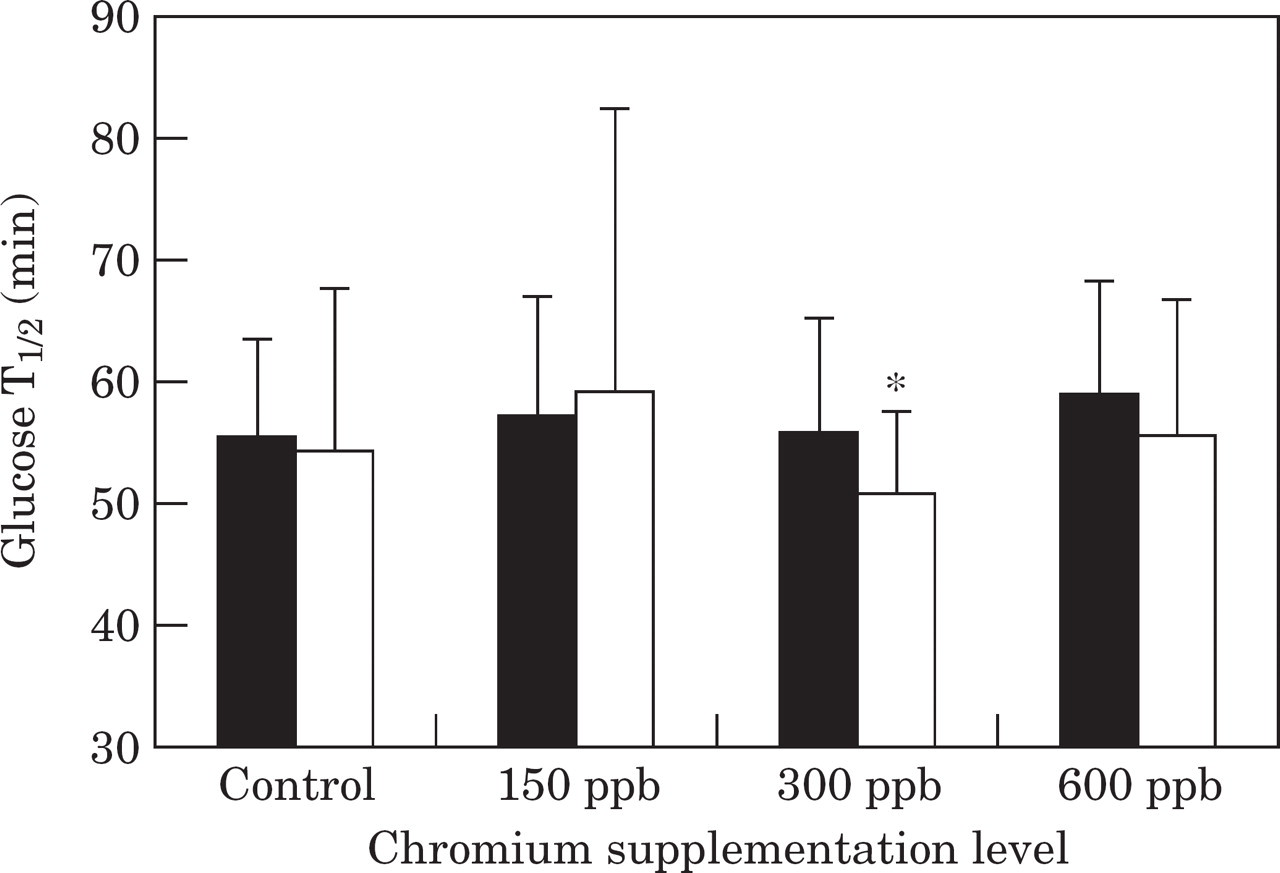
Mean glucose half-life (T1/2) during a glucose tolerance test before (▄) and after (□) the trial in control cats, and cats supplemented with chromium at 150 ppb, 300 ppb or 600 ppb. *Significantly (P<0.05) different values after the trial compared to before the trial.
Glucose percent disappearance per minute (Kglucose) and area under the insulin curve above nadir (AUC) during a glucose tolerance test in control cats and cats supplemented with either 150 ppb, 300 ppb or 600 ppb chromium tripicolinate (CrPic)
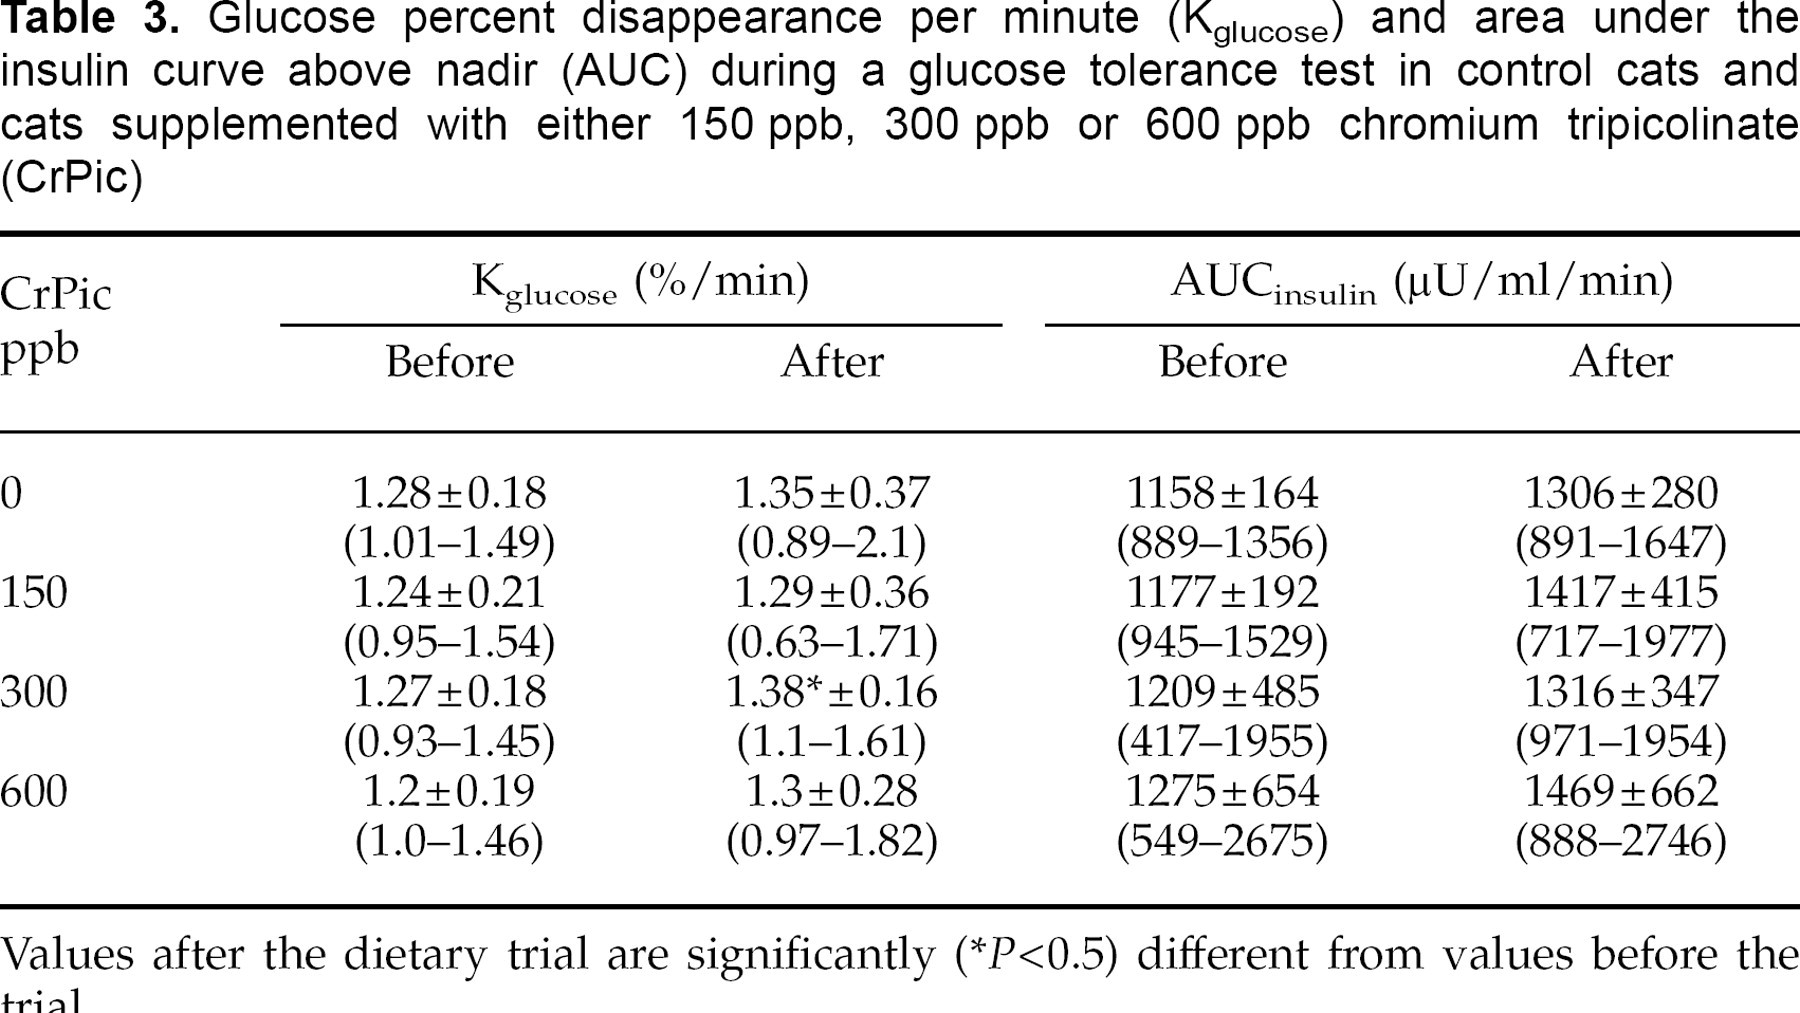
Values after the dietary trial are significantly
(P<0.5) different from values before the trial.
Neither mean plasma insulin concentrations nor AUCinsulin following chromium supplementation were significantly different from pretreatment levels in any group, nor were there any differences between groups before or after the dietary trial (Fig. 4, Table 3).
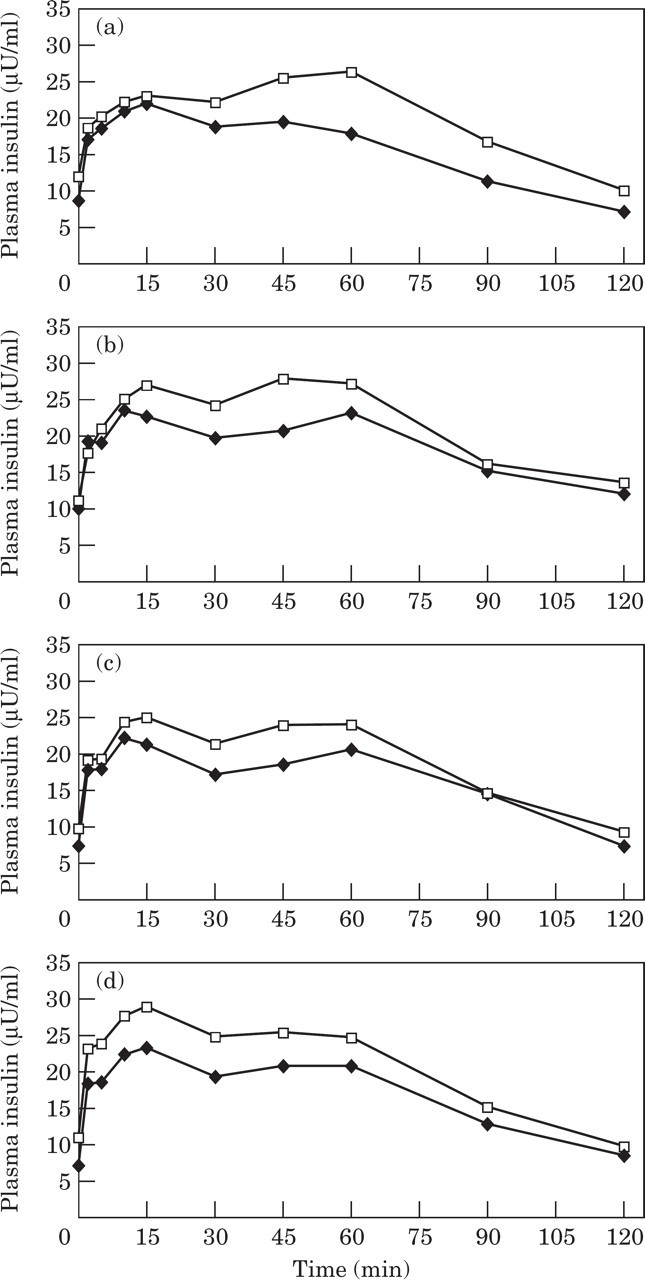
Mean insulin concentrations during a glucose tolerance test before (▪) and after (□) the trial in control cats (a), and cats supplemented with chromium at 150 ppb (b), 300 ppb (c) or 600 ppb (d).
Insulin Tolerance Test
In the insulin tolerance test, the smaller the area under the glucose curve (AUCglucose), the greater the drop in glucose in response to insulin, suggesting greater insulin sensitivity. Cats consuming the 150 and 600 ppb chromium test diets tended to have smaller AUCglucose values after the dietary trial compared with before the trial, although the results were not statistically significant (Fig. 5). However, the control group also had a significantly smaller AUCglucose value after the diet compared to before the diet (Fig. 5).
Mean area under the glucose curve (AUC) during an insulin tolerance test before (–♦–) and after (–□–) the trial in control cats, and in cats supplemented with chromium at 150 ppb, 300 ppb, or 600 ppb. *Significantly (P<0.05) different values after the trial compared to before the trial.
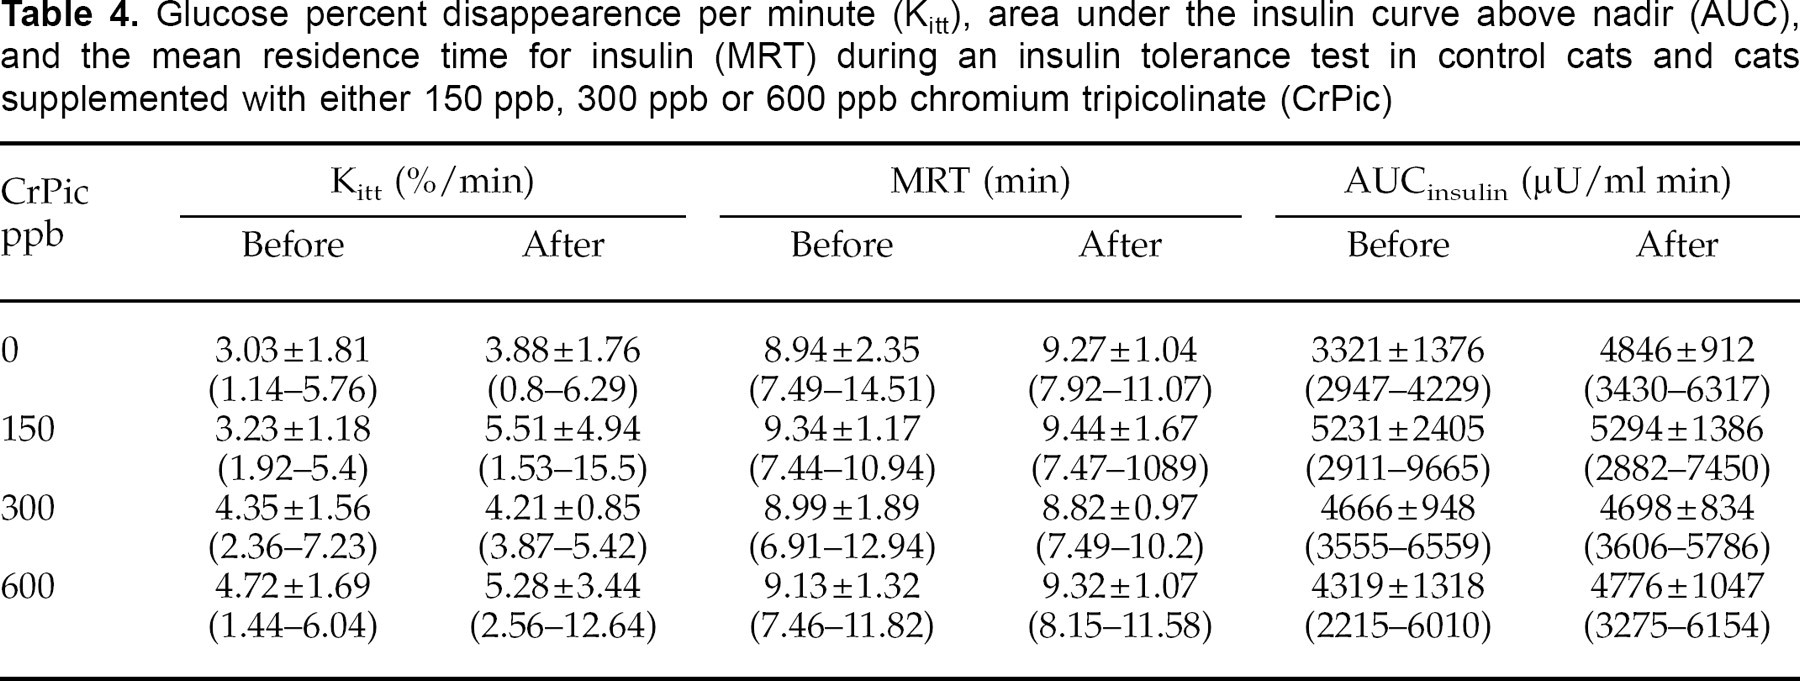
Glucose clearance rate (Kitt), mean residence time (MRT) for insulin and area above the insulin curve (AUCinsulin) were not significantly different for any group after 6 weeks of chromium supplementation, compared to before the trial (Table 4).
Glucose percent disappearence per minute (Kitt), area under the insulin curve above nadir (AUC), and the mean residence time for insulin (MRT) during an insulin tolerance test in control cats and cats supplemented with either 150 ppb, 300 ppb or 600 ppb chromium tripicolinate (CrPic)
Insulin Sensitivity Test
Supplementation with dietary chromium for 6 weeks did not significantly affect the minimal-model-derived insulin sensitivity index or glucose effectiveness in any of the groups (Fig. 6).
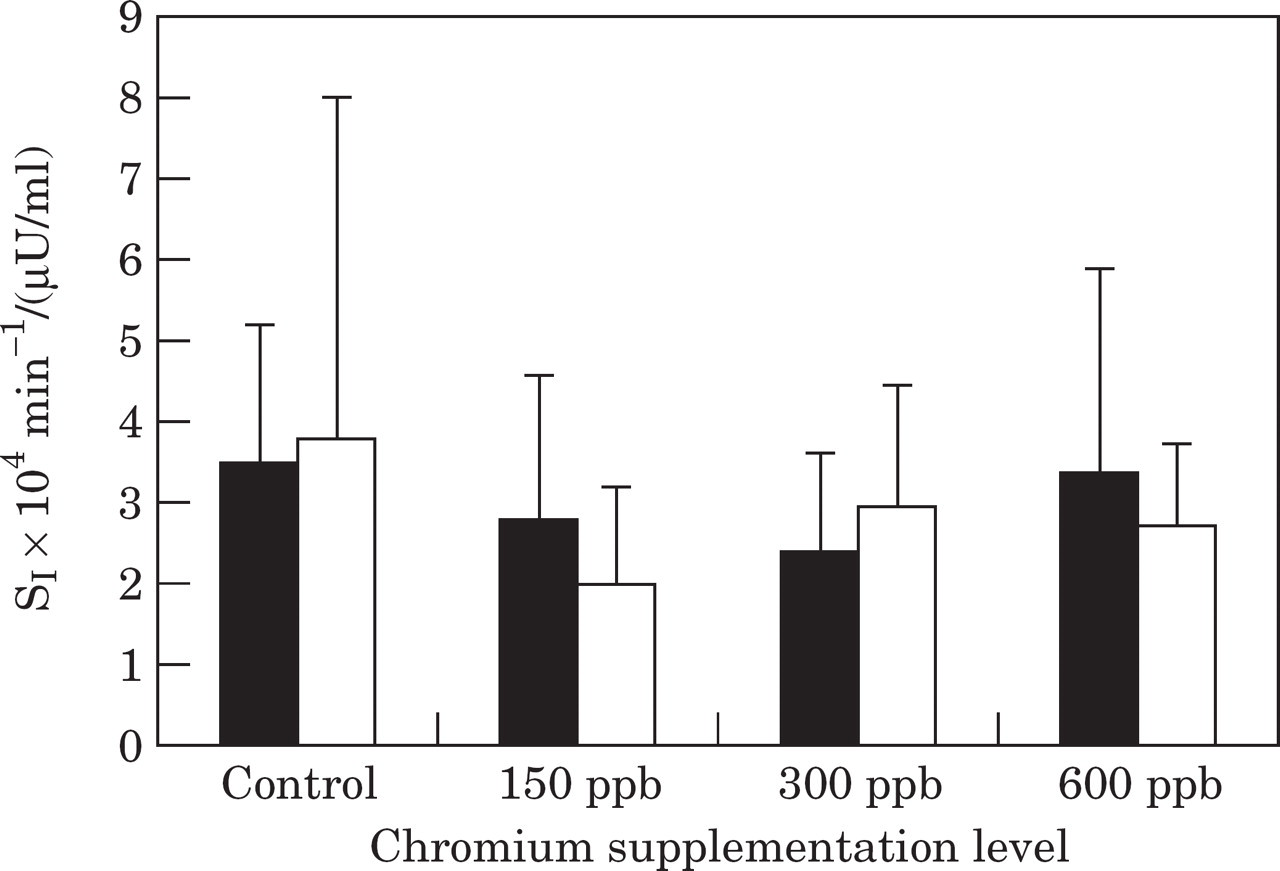
Insulin sensitivity index (SI) during an insulin sensitivity test before (▪) and after (□) the trial in control cats, and cats supplemented with chromium at 150 ppb, 300 ppb and 600 ppb.
Discussion
The most important finding of this study is that diets supplemented with chromium in the form of chromium tripicolinate, can improve glucose metabolism in healthy, non-obese cats. This was evidenced by statistically significant improvements in mean plasma glucose concentrations, T1/2, Kglucose and AUCglucose values during the glucose tolerance test, and fasting glucose measured in the biochemistry profile 24 h prior to metabolic testing. The greatest effects tended to occur at the higher supplemental concentrations (300 ppb and 600 ppb). The effect of chromium on glucose concentrations and glucose tolerance may have been greater had there not been a statistical increase in body weight during the trial, with the greatest increase in the 600 ppb-supplemented group.
In contrast to glucose, insulin concentrations during the glucose challenge were not altered by chromium supplementation. Thus, the same concentrations of insulin led to lower glucose concentrations, with a faster disappearance of glucose from plasma, suggesting increased efficiency of insulin. Improvements in glucose tolerance without consistent changes in insulin concentrations have also been reported in humans (Anderson et al 1983, Anderson et al 1987), pigs (Amoikon et al 1995), calves (Bunting et al 1994) and dogs (Spears et al 1998). The mechanism for chromium's effect on insulin action is still to be elucidated. It is postulated to enhance insulin binding via increased insulin receptor numbers (Anderson et al 1987, Evans & Bowman 1992, Morris et al 1993). It may also have a post-receptor effect involving activation of the insulin-receptor tyrosine kinase (Davis & Vincent 1997).
Although previous studies in humans have demonstrated an effect of chromium on insulin sensitivity (Elias et al 1984, Potter et al 1985, Cefalu et al 1999), the minimal model-derived insulin sensitivity index in our study was unchanged at all levels of chromium supplementation. There was, however, a large range of insulin sensitivity index values in all groups, which makes it unlikely that small changes would be detected in such a relatively small group of cats.
The insulin tolerance test has been used for many years as a simple test to estimate insulin sensitivity (Lucas et al 1986). In this test, glucose disappearance from plasma is measured after an intravenous insulin injection. In our study, the percent disappearance rate for glucose (Kitt), was unchanged in any of the groups after chromium supplementation. This result is similar to other studies in pigs (Amoikon et al 1995) and dogs (Spears et al 1998), in which no change in Kitt occurred during the insulin tolerance test despite significant improvements in glucose tolerance evident in a glucose tolerance test.
The major criticism of the insulin tolerance test is that hypoglycaemia occurs, which in turn triggers a counter-regulatory hormone response with the release of hormones such as catecholamines, cortisol, glucagon and growth hormone (Rizza 1981, Alberti et al 1987, Bonora et al 1989, Gelding et al 1994). These hormones potentially slow the disappearance rate of plasma glucose, so the rate is no longer a simple function of insulin action (Reaven 1983). Substantial hypoglycaemia occurred in cats in our study, which may have limited the usefulness of this test, and prevented the detection of chromium having a positive impact on insulin sensitivity.
Interestingly, there was a trend to greater weight gain in the chromium-supplemented groups, with the greatest gain in the 600 ppb-supplemented group. This was not matched by a similar trend in food intake between the groups. Other studies have demonstrated a trend towards increasing body weight and/or lean muscle mass, and reducing body fat after chromium supplementation in rats (Hasten et al 1993), humans (Evans 1989, Kaats 1991, Hasten et al 1992), and pigs (Page et al 1993). Insulin exerts an anabolic effect on skeletal muscle and other tissues, promoting amino acid uptake and protein synthesis (Jefferson 1980, Gelfand & Barrett 1987). Chromium, by increasing insulin efficiency, may potentiate this anabolic effect.
Chromium supplementation has repeatedly been shown to decrease cholesterol and/or triglycerides in humans (Riales & Albrink 1981, Mossop 1983, Anderson 1987, Evans 1989, Press et al 1990). Chromium supplementation had no effect on cholesterol concentrations in our non-obese cats. However, there is a lag period before effects on lipoproteins become apparent, and the 6-week duration of our study may have been too short. In humans, a decrease in cholesterol occurred after 12 weeks of chromium supplementation, but was not evident at 6 weeks (Wang et al 1989).
Reported responses to chromium supplementation have been variable and some investigators have found no effect of chromium on glucose tolerance in humans, dogs and cats (Cohn et al 1999, Schachter et al 2000, Trow et al 2000). Supplementation with 100 μg of chromium tripicolinate per day in normal weight and obese cats did not result in any beneficial effects on insulin peak response, the insulinogenic index (ΔI/ΔG), insulin secretion or T1/2 during a glucose tolerance test (Cohn et al 1999). It is difficult to make direct comparisons between this study and our own. Absolute glucose concentrations and area under the response curve for glucose during the glucose tolerance test were not reported, and these values changed significantly after chromium supplementation in our study. Interestingly, the published graphs of the glucose tolerance test in obese cats show a similar relative decrease in glucose concentrations after chromium to our graphs in the 300 ppb and 600 ppb groups (Cohn et al 1999). It is possible that with greater numbers of cats, and comparison of glucose concentrations and area under the glucose curves, Cohn's study would have also shown significant decreases in glucose concentrations after chromium supplementation in obese cats.
There are other possible reasons for the variation in response between Cohn's study and ours. These include improved efficacy of the chromium source in our study, where it was incorporated into the dietary formulation rather than dosed as a supplement. Differences in previous chromium intake of the cats may also have influenced the results. Based on the understanding that chromium is an essential nutrient and not a therapeutic drug, only individuals with sub-optimal chromium nutrition would be expected to respond (Anderson 1987). For both studies in cats, chromium tissue stores were unknown.
Other reasons for inconsistent results between the various chromium supplementation studies include differences in bioavailability of the form of chromium sources used, differences in the amount of chromium supplemented and/or the duration of supplementation. Chromium in the form of chromium tripicolinate is utilised more efficiently than other forms (Evans 1989, Anderson et al 1996).
Unfortunately, there is no practical method of identifying chromium status in individual animals prior to a supplementation study (Mertz 1993). The only practical measurement of chromium status is to monitor glucose metabolism before and after chromium supplementation (Anderson 1995). Currently, there are no guidelines for recommended daily chromium intake in cats (National Research Council 1986). Prior to and during the trial, cats in our study were consuming diets that met the Association of American Feed Control Officials (AAFCO) standards for adult cat maintenance, and would be expected to contain adequate chromium levels. However, it is difficult to accurately assess dietary chromium concentrations. Atomic absorption spectrometry has been used, but environmental contamination of the sample with inorganic chromium is often unavoidable, resulting in inaccurate estimations. The minimum recommended daily intake for dietary chromium in humans is 50 μg per day (range is 50–200 μg) (National Research Council 1989). However, more than 90% of typical diets consumed by people in the US contained daily chromium concentrations below this level (average intake, 25–33 μg/day) (Anderson & Kozlovsky 1985). Based on this study in humans, chromium intake from typical feline diets may also be marginal in some cats.
Interestingly, dietary carbohydrates that have a high glycaemic index and produce the greatest increase in insulin response, also cause the greatest loss of chromium in the urine (Kozlovsky et al 1986, Anderson et al 1990). Once chromium is mobilised into plasma from tissue stores in response to increased insulin concentrations, it is subsequently lost in the urine (Anderson 1986). Hyperinsulinaemic states such as obesity or type 2 diabetes may increase the loss of chromium from the body (Anderson et al 1990). Refining of carbohydrates also leads to loss of chromium from foods (Zook et al 1970), and heating during canning may render chromium unavailable for absorption (Schroeder 1968). Long-term effects of sub-optimal dietary chromium intake, coupled with diets that increase urinary loss of chromium could eventually lead to marginal chromium deficiency in cats. Insufficient chromium for the potentiation of insulin action may contribute to impaired glucose tolerance or type 2 diabetes mellitus in predisposed cats.
In normal-weight cats, feeding diets containing sorghum and corn have been shown to result in lower post-prandial insulin concentrations compared to rice-based diets (Bouchard & Sunvold 2000). Formulation of feline diets incorporating these types of starch in preference to rice, may therefore limit chromium depletion, help maintain tissue chromium stores, decrease the demand on beta cells to produce insulin and prevent deterioration in glucose tolerance. Addition of chromium to such diets may further increase the benefit to cats at risk of impaired glucose tolerance and diabetes. In its trivalent form, chromium has a low order of toxicity and a wide safety margin exists (Anderson 1987, Baruthio 1992). Cats have been reported to tolerate 1000 mg/day with no adverse effects (World Health Organisation 1973).
Age is the most important risk factor for the development of diabetes in cats. Approximately 75% of cats with diabetes are aged 7 years or older (Panciera et al 1990). Obesity also develops most commonly in cats between the ages of 6 and 11 years (Scarlett et al 1994). In humans, there is a highly significant, age-related decline in tissue chromium concentrations (Davies et al 1997). If the same is true for cats, life-long marginal chromium intake coupled with excessive chromium losses, may exacerbate the decline in chromium tissue stores as cats' age and gain weight, adding to their increased risk of diabetes.
Healthy cats with insulin sensitivity below the population median have three times the risk of developing impaired glucose tolerance with weight gain (Appleton et al 2001a). Obesity, physical inactivity and diets containing a relatively high level of processed carbohydrate are postulated to increase demand on pancreatic beta cells to secrete more insulin, and eventually lead to beta cell exhaustion and diabetes mellitus (Brand Miller & Colagiuri 1994). Because these lifestyle changes have also occurred in cats, chromium supplementation may be useful in some cats to improve insulin sensitivity and decrease the demand on beta cells. Cats most likely to benefit from chromium supplementation are those which are aged, inactive or obese, those with underlying low insulin sensitivity, or those genetically at risk of developing diabetes such as the Burmese breed in Australasia (Rand et al 1997, Wade et al 1999). Further studies in cats are required to test these hypotheses.
Conclusion
Importantly, incorporation of chromium tripicolinate at 300 and 600 ppb in the ration of healthy, non-obese cats produced small but significant improvements in glucose tolerance as measured by glucose half-life, area under the glucose curve and absolute glucose concentrations. Because insulin concentrations were unchanged, the results indicate a greater effectiveness of insulin in the presence of chromium. Supplementation at the higher concentrations appeared to exert the greatest effect on glucose control. It remains to be determined whether supplementing at even higher doses, will produce a greater response.
Assuming chromium is a nutrient, supplementation would only benefit those metabolic disturbances that are due to chromium deficiency. The response in our study suggests that cats consuming complete and balanced diets that meet AFFCO standards may still benefit from chromium supplementation. Future studies are required to determine if supplementation of chromium is beneficial for cats consuming some commercial diets, particularly those containing increased levels of highly digestible, high glycaemic index carbohydrates. These diets increase the demand for insulin, which may increase chromium mobilisation from tissue, and loss in the urine, accentuating a marginal chromium deficiency. It is unknown whether individuals consuming adequate chromium have maximal potentiation of their insulin action, or whether supra-nutritional intakes could improve insulin action further. Further studies are needed to establish the minimum recommended dietary chromium intake for healthy cats.
These findings indicate that future studies are warranted to investigate the effects of diets containing chromium on the long-term health in cats. Life-long supplementation of chromium has the potential to benefit healthy cats that are at risk of developing glucose intolerance and insulin resistance from overeating or physical inactivity, those with underlying low insulin sensitivity, or those genetically at risk (eg, Burmese cats) (Rand et al 1997, Wade et al 1999). Because of its trend to improve glucose tolerance, supplementation with chromium tripicolinate may also prove beneficial in cats with reduced glucose tolerance, which is a feature of ageing, obesity and diabetes. Further studies are needed to investigate these hypotheses.
Footnotes
Acknowledgements
Appreciation is expressed to Rebekah Wilson and Debbie Laws for their assistance with animal care and data collection, to Lyn Knott for her help with sample analysis, to Greg Martin for his technical assistance, to Jan Priest for her statistical advice and to the IAMS Company for funding this project.