
Abstract
Ten diabetic cats were studied at intervals for up to 12 months with twice-daily insulin injections. Ten clinically healthy cats were also studied. Diets fed were based on the individual cat's performance, using mainly commercial dry or canned cat foods and fresh meat. In most cases more than one food was offered. Food was given fresh twice daily, and the cats allowed to eat ad libitum.
The food intake and blood glucose were measured every 2 h in diabetic cats after insulin injection and in diabetic and normal cats without insulin injections. Food was quantified by the energy consumed (kJ ME), crude protein (g), crude fat (g), and carbohydrate (g). The blood glucose in 10 diabetic cats was measured for 2 h following a 20-min meal.
Both diabetic cats and normal cats showed similar patterns of eating, with a higher food intake in the 2 h after fresh food was placed. Both groups of cats ate multiple small meals spread through the day and night. There was little or no correlation between the blood glucose and the amount of food consumed over the previous 2-h period, in insulin- or non-insulin-treated diabetic cats, or in normal cats. An overnight fast did not significantly alter morning blood glucose in diabetic cats. No demonstrable appetite stimulation occurred following an occurrence of low blood glucose; however, recorded incidences were few. No post-prandial hyperglycaemia was seen in the 10 diabetic cats during a 2-h period following the ingestion of typical cat foods.
Humans with insulin-dependent diabetes mellitus (IDDM) usually coordinate insulin administration with food ingestion, so the peak glucose lowering effect of the insulin coincides with the maximal post-prandial blood glucose rise (Dimitriadis & Gerich 1983, Berger 1989). The relative ability of foods to increase blood glucose after ingestion has been measured for many foods in humans, and is called the ‘glycaemic index’. Human diabetics calculate the amount of insulin to inject, based on the expected blood glucose rise from the amount and type of food to be eaten (Wolever & Jenkins 1986).
In contrast to the eating patterns of humans, normal cats fed ad libitum eat 12–20 small meals throughout the day and night, rather than a few large meals at specific times (Kane 1989, Bradshaw & Thorne 1992). Because it is inconvenient to give cats multiple insulin injections each day, diabetic cats are usually given insulin once or twice daily. Diabetic cats are generally fed twice-daily meals; the first meal is given at the time of the morning insulin injection, and the second meal 9–12 h later when insulin is given once daily; or at the time of the evening insulin injection when twice-daily injections are given (Milne 1989, Wolf 1989, Nicholls 1992, Norsworthy 1993). More recently, it was recommended that small multiple meals be given to minimise post-prandial glycaemic excursions (Ihle 1995). However, there is little in the literature to demonstrate the validity of these recommendations. Previous studies in normal cats fed typical feline diets showed no post-prandial hyperglycaemia (Kettlehut et al 1980, Kienzle 1994). If post-prandial hyperglycaemia is absent in diabetic cats, it implies there is no need to coordinate feeding with insulin administration.
Few data have been published regarding the effect of food ingestion on blood glucose, or the effect of blood glucose on feeding in diabetic cats. Various statements in the literature such as ‘the insulin requirement will vary with the amount of food ingested’ (Norsworthy 1993), and ‘when diabetic cats are fasted overnight prior to surgery the insulin dose should be reduced by one half in the morning’ (Schaer 1995), have not been confirmed with studies in diabetic cats. Studies in normal cats suggest that low blood glucose or insulin excess stimulate appetite, but very few animals have been examined (Jalowiec et al 1973, Rowland 1981).
The purpose of this study was to investigate the pattern of eating in diabetic cats fed ad libitum, the effect of feeding on blood glucose in insulin-treated diabetic cats, and the occurrence of post-prandial hyperglycaemia in normal and diabetic cats fed typical feline diets. The appetite response of cats to hypoglycaemia was also examined.
Materials and methods
Animals
Experimental design
Blood glucose measurements were made using a pocket glucose meter (Accutrend, Boehringer Mannheim Ltd, Australia) which has been validated for the measurement of blood glucose in cats (Link et al 1997).
Food types used, and their energy, carbohydrate, protein, and fat contents (as fed)

Denotes foods used in the 2-h post-prandial study.
Sources: Manufacturer's data and Donoghue & Kronfeld (1994).
The weight of food ingested at each sample interval was calculated by measuring the net weight of each food bowl at each sample time. Scales used were Hana model HS 7000C (Hana Instrument Co., Ltd, R.O.K.). The amounts of energy, protein, fat and carbohydrate consumed were calculated for each food, using the composition data in Table 1. The total amounts of energy, protein, fat and carbohydrate consumed in each sample interval were calculated by totalling the values for each of the individual foods. These values were divided by the cat's bodyweight to standardise values for cats of differing bodyweights.
Food intake patterns and the effect of food intake on blood glucose concentration in normal and diabetic cats
Studies were undertaken in normal and diabetic cats to examine the relationship between the change in blood glucose levels and food consumed at 2-h intervals. A 2-h interval was chosen as it is known in diabetic humans that post-prandial hyperglycaemia is at a maximum about 60–120 min after eating (Kopf et al 1973).
The average percentage of the cat's total 24-h food intake (as energy, kJ ME/kg bodyweight) in each 2-h interval was calculated, as well as the average percentage intake for the day (0800–2000 hours) and night (2000–0800 hours). The patterns of food intake between normal and diabetic cats were then compared, using Kruskal-Wallis one-way ANOVA on ranks to compare the average percentage food intake at each time interval respectively. Data were averaged from a total of 41 separate 24-h periods for the 10 diabetic cats, and from 10 separate 24-h intervals for the 10 normal cats (one 24-h period per cat).
To determine if significantly more food was eaten in the 2-h period following the placement of fresh food, the average percentage eaten between 0800 and 1000 hours was compared to the average percentage eaten during the 2-h intervals through the remainder of the day (1000–2000 hours), for the normal and the diabetic cats respectively. Similarly, the average percentage eaten between 2000 and 2200 hours was compared to the average percentage eaten during the 2-h intervals through the remainder of the night (2200–0800 hours), for the normal and diabetic cats respectively. The average values were compared using Kruskal-Wallis one-way ANOVA on ranks.
Blood glucose changes over the 2 h after a single 20-min meal in diabetic cats
To examine whether blood glucose was elevated within a 2-h period of food ingestion, this study measured blood glucose over a 2-h post-prandial period after a single 20-min meal in 10 diabetic cats. Cats were fasted for 4–6 h before the study began. Blood glucose was measured prior to feeding (time=-20 min), to establish a baseline blood glucose concentration. Food bowls were weighed, the foods were given to the cats, and the cats were allowed to eat ad libitum for 20 min. The foods were then removed and the amounts consumed measured by weighing the food bowls. The blood glucose was measured immediately (time 0 min), then at six 20-min intervals, until 2 h after food removal (at times 20, 40, 60, 80, 100 and 120 min).
To determine if a significant change in blood glucose concentration occurred over the 2-h period, the area under the curve above the baseline for blood glucose concentration (AUCg) for each cat was calculated using the trapezoidal method (Rowland & Tozer 1989). Positive values of the AUCg indicate that the amount of glucose in the plasma over the duration of the study increased, whereas negative values of AUCg indicate a decrease in the amount of glucose in the plasma (Ritschol 1992).
To determine if food consumed had influenced the blood glucose during the 2-h study period, food ingestion values (total energy, protein, fat and carbohydrate) consumed in the 20-min period were calculated and were correlated with the AUCg for the 10 cats, using Spearman rank-order correlation.
To determine if a consistent pattern of change in blood glucose concentration occurred, the change in blood glucose concentration with respect to the baseline was calculated by subtracting the blood glucose concentration measured at each sample time from the baseline blood glucose concentration. The mean changes in blood glucose concentration at each time point was then calculated over the group of cats. The mean changes in blood glucose concentration from each time point were compared using a one-way repeated measures ANOVA.
The effect of a 12-h fast on blood glucose in diabetic cats
Seven diabetic cats were studied on three consecutive days, referred to as days 1, 2 and 3, during the first week of insulin treatment. Blood glucose was measured at 0800 hours on each of the three consecutive days. Insulin was given in the mornings of the study days only; no insulin was given on the evenings prior to the study days. Overnight prior to days 1 and 3, cats were given fresh food at 2000 hours and allowed to eat ad libitum overnight (all cats studied ate during this period). Overnight prior to day 2, food was removed from the cats at 2000 hours. The 0800 hours blood glucose values for days 1, 2 and 3 were compared with paired t-tests, to determine if the overnight fast had significantly altered the morning blood glucose.
The effect of low blood glucose on appetite in diabetic cats
This study measured food intake over the 2-h period subsequent to a blood glucose of <3.5 mmol/l in the 10 diabetic cats on insulin treatment. Food intake per kg bodyweight during this period was compared to the mean 2-hourly food intake per kg bodyweight for that cat at the time of day at which the hypoglycaemia had occurred (Rowland 1981). Eleven instances of low blood glucose (blood glucose <3.5 mmol/l) were recorded in three of the insulin-treated diabetic cats studied.
Data analysis
Data and statistical analyses were performed using Microsoft Excel 97 and Visual Basic for Applications (Microsoft, USA), and SigmaStat version 2.0 (SPSS Inc., USA).
Results
Food intake and eating patterns in normal and diabetic cats fed ad libitum
Normal cats consumed a median of 338 kJ ME (range 183–449) per kg bodyweight daily, and diabetic cats a median of 284 kJ ME (range 109–760) per kg bodyweight daily (Fig 1). There was no significant difference between the median daily energy intake of normal versus diabetic cats (P=0.34, Mann–Whitney rank-sum test).

Box plot of energy intake for normal and diabetic cats over a 24-h period. The ‘box’ shows the 25–75% interquartile range, with the horizontal line in the box showing the median. The ‘whiskers’ show the 5–95% range, with dots showing outlying data points.
There was no significant difference in the median number of times the normal (median 9.0, range 5.0–12.0) and diabetic (median 8.8, range 7.5–11.4) cats ate over a 24-h period (P=0.91, Kruskal–Wallis one-way ANOVA on ranks) (Fig 2).
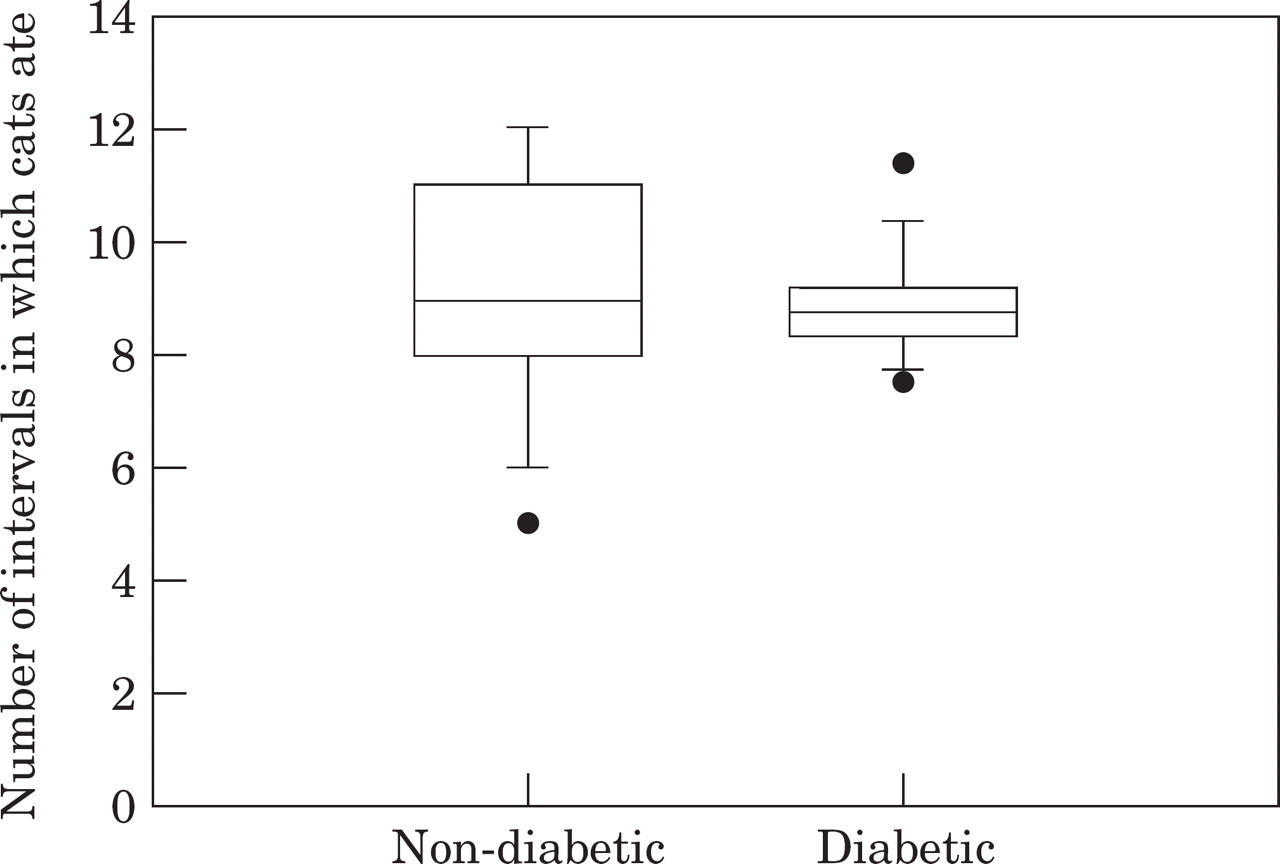
Box plot of the number of 2-h intervals during which non-diabetic and diabetic cats ate food over a 24-h period. For description of box format, see Fig 1.
No significant difference in the average percentage of total daily food intake consumed during each 2-h time period occurred when the insulin-treated diabetic and normal cats were compared (P>0.05, Kruskal–Wallis one-way ANOVA on ranks), with the exception of the time period between 0400 and 0600 hours, during which, on average, the normal cats (median 0.0%, range 0.0–9.8%) ate significantly less than the diabetic cats (median 6.4%, range 0.0–25.2%) (P<0.01, Kruskal–Wallis one-way ANOVA on ranks) (Fig 3).
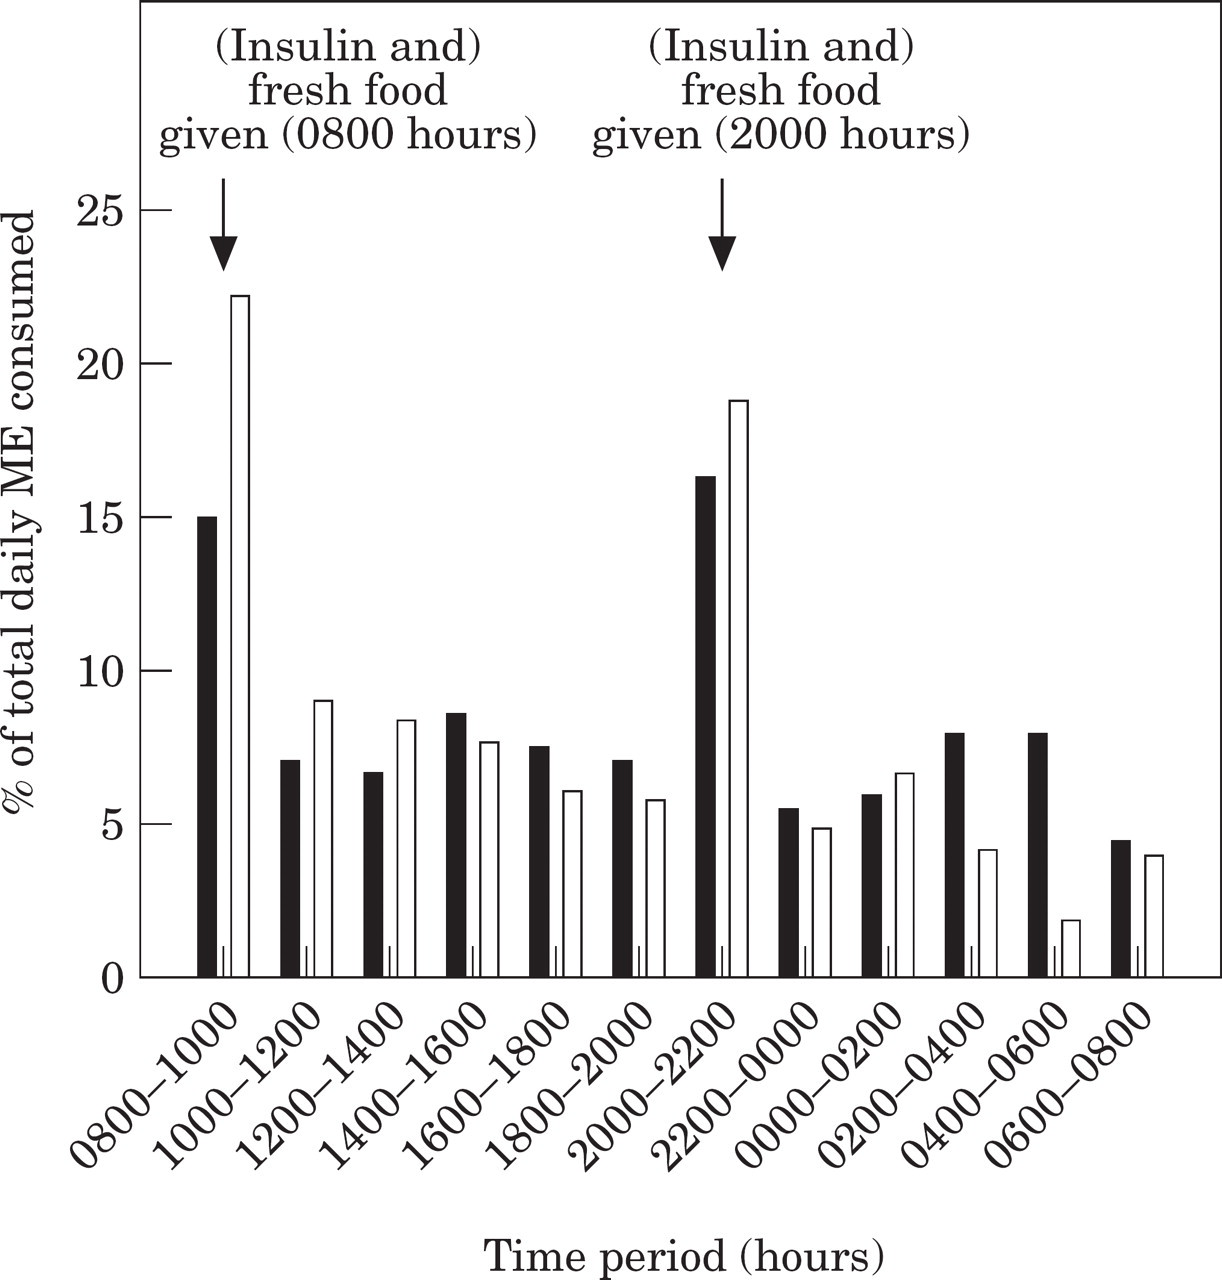
Median percentage of total daily food intake in 10 twice-daily insulin-treated diabetic cats (▪) and 10 non-diabetic cats (□), given fresh food daily.
The diabetic cats ate on average 52% of their daily intake during the day and 48% during the night. There was no significant difference between day and night for the diabetic cats (P=0.14, one-way ANOVA). However, normal cats consumed 59% during the day, and 41% during the night, which was significantly less at night (P<0.001, one-way ANOVA).
Both the normal and diabetic cats showed a significantly higher percentage food intake in the period 2 h after feeding (0800–1000, and 2000–2200 hours) than over the subsequent 10 h (1000–2000, and 2200–0800 hours) (P<0.001, Kruskal–Wallis one-way ANOVA on ranks) (Fig 3).
Correlation between blood glucose and the food intake in the previous 2-h period in normal cats
In the group of normal cats, there was no significant correlation between the blood glucose change and amount of energy, protein, fat or carbohydrate ingested in the previous 2 h (P>0.05, Spearman rank-order correlation). When individual cats were compared, one cat showed a significant correlation between blood glucose change and the energy, protein and carbohydrate ingested in the previous 2 h (P=0.017 and r=0.69; P=0.017 and r=0.69; and P=0.008, and r=0.74, respectively). In this cat the fat intake did not correlate significantly with the blood glucose change (P=0.056). Another cat showed a significant negative correlation between blood glucose change and the fat intake in the previous 2 h (P=0.011 and r=–0.72). However, in this cat the energy, protein and carbohydrate ingested did not significantly correlate with the blood glucose change (P=0.23; P=0.12; and P=0.45, respectively).
Correlation between blood glucose and the food intake in the previous 2-h period in insulin-treated diabetic cats
A typical day's results from one of the insulin-treated diabetic cats are shown in Fig 4. The pattern of blood glucose change appears to be generated by the injected insulin rather than the ingested food.

Typical pattern of blood glucose (——) and food intake (as energy ingested, □) over 24 h in an insulin-treated diabetic cat.
In the insulin-treated diabetic cats, there was no significant correlation between the blood glucose change and the ingestion over the preceding 2 h of energy (P=0.86), protein (P= 0.58), fat (P=0.68) and carbohydrate (P=0.41, Spearman rank-order correlation). A significant correlation was seen in two of the cats when data were correlated individually for each cat. In the first of these cats the ME, protein, fat and carbohydrate intake per kg bodyweight were weakly but significantly positively correlated with the subsequent blood glucose change (P=0.013, r=0.37; P=0.013, r=0.38; P=0.014, r=0.37; and P=0.018, r=0.35, respectively). In the second of these cats, the ME, protein and fat intake per kg bodyweight were negatively correlated with the subsequent blood glucose change (P=0.011, r=–0.28; P=0.016, r=–0.27; and P=0.011, and r=–0.28, respectively). In this cat, the carbohydrate was not significantly correlated with blood glucose change (P=0.74).
Correlation between blood glucose and the food intake in the previous 2-h period in diabetic cats, when insulin was withheld
When insulin was withheld in the diabetic cats, the ME, protein and fat intake per kg body-weight were not significantly correlated with the change in blood glucose (P=0.09; P=0.08; and P=0.1, respectively, Spearman rank-order correlation). The carbohydrate intake per kg body-weight was weakly but significantly correlated with the change in blood glucose (P=0.03, r=0.28). None of the food intake values showed a significant correlation with the change in blood glucose for any of the individual cats (P>0.05).
The effect of a 20-min meal on blood glucose over the subsequent 2 h in diabetic cats
The amounts of food ingested by the diabetic cats in the study of 2-h post-prandial blood glucose are shown in Table 2. The AUCg values ranged from–268 to 292 mmol/l/min−1, with a median of–31.5 mmol/l/min−1. No correlation was found between the energy intake (P=0.45, Pearson's moment correlation), the protein intake (P=0.15, Pearson's moment correlation), the fat intake (P=0.5, Pearson's moment correlation) or the carbohydrate intake (P=0.81, Spearman rank-order correlation), and the subsequent AUCg.
Amount of food consumed in the 20-min prandial period, prior to measuring post-prandial blood glucose. Subsequent 2-h baseline-adjusted AUC-glucose values are also listed

No significant change in blood glucose values from baseline occurred at any of the sample times (P=0.62, one-way repeated measures ANOVA) (Fig 5).

Box plot of variation in blood glucose from baseline after a 20-min meal in 10 diabetic cats. For description of box format, see Fig 1.
The effect of a 12-h fast on blood glucose in diabetic cats
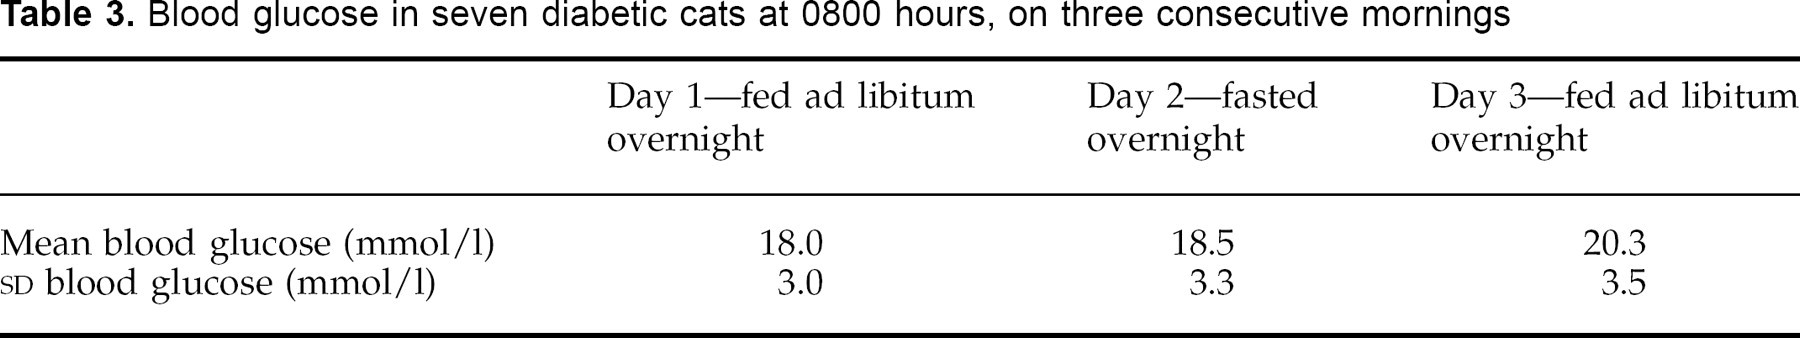
There were no significant differences between the mean 0800 hours blood glucose on any of the 3 days of testing (Table 3). Statistics were: day 1 (fed overnight) vs day 2 (fasted overnight) (P=0.746, paired t-test); day 2 (fasted overnight) vs day 3 (fed overnight) (P=0.09, paired t-test). There was no significant difference between the mean 0800 hours blood glucose between day 1 (fed overnight) and day 3 (fed overnight) (P=0.06, paired t-test), which demonstrated that the mean morning blood glucose remained constant through the duration of the test procedures.
Blood glucose in seven diabetic cats at 0800 hours, on three consecutive mornings
Food intake subsequent to instances of low blood glucose in insulin-treated diabetic cats

The effect of low blood glucose on appetite in diabetic cats
Eleven instances of low blood glucose (blood glucose <3.5 mmol/l) were recorded in three of the insulin-treated diabetic cats studied (Table 4). In four of these instances, the cat ate no food in the subsequent 2-h period. In five instances the cat ate more than its average food intake for that time of day (kJ ME/kg bodyweight). However, there was no average increase in the amount of food eaten in the 2 h after a low blood glucose occurred when the data were analysed collectively for all the cats (P>0.05, Wilcoxon signed-rank test).
Discussion
Energy intake and pattern of food intake in diabetic and normal cats fed typical cat foods
The normal and diabetic cats we studied showed a similar pattern of feeding when fed ad libitum, with median 24-h meal frequencies of 9 and 8.8, respectively. This is similar to previous reports of 12–20 small meals eaten in 24 h by normal cats fed ad libitum (McDonald et al 1984a, Kane 1989, Bradshaw & Thorne 1992). However, our sampling method of only measuring food consumption at intervals of 2 h for 24 h may have led to an underestimation of the number of times cats ate.
Both the normal and diabetic cats showed an increased food intake in the time period immediately following the placement of fresh food, which has been previously reported (MacDonald et al 1984b), although other studies show a more random pattern of feeding over 24 h (Bradshaw & Thorne 1992).
The normal cats in this study consumed more food during the day than during the night, which is in contrast to previous studies which show a more random pattern of feeding (Bradshaw & Thorne 1992). However, considerable variation is reported between cats, so the variation in the cats we studied may be due to individual variation, or possibly to the small sample size and short study duration (Kane et al 1987).
The normal and diabetic cats in this study had median daily energy intakes which were not significantly different (338 and 284 kJ ME per kg bodyweight per day, respectively) and this is similar to the daily energy intake for normal cats reported in previous studies (variously 257–283, 278–371, and 253 kJ ME per kg bodyweight per day) (MacDonald et al 1984b). This indicates that on average diabetic cats were not polyphagic, although one of the diabetic cats displayed marked polyphagia (>500 kJ ME per kg body-weight per day). Polyphagia is reported to occur in about 17% of diabetic cats pre-treatment (Crenshaw & Peterson 1996).
Absence of post-prandial hyperglycaemia in diabetic and normal cats fed typical cat foods
Both diabetic and normal cats in this study did not demonstrate post-prandial hyperglycaemia, either during a 2-h interval after feeding, or at 2-h intervals after feeding. This is in contrast to humans, in which diabetics show marked postprandial hyperglycaemia. The phenomenon is more pronounced in insulin-treated diabetics, but normal humans also demonstrate a degree of post-prandial hyperglycaemia (Kopf et al 1973). Post-prandial hyperglycaemia occurred in normal cats when fed a diet very high in glucose (39.8% glucose), but not when a carbohydrate-free, or a high starch (28.6, 34.5, or 37.2% starch), lactose (11.3 or 28.0%), or sucrose (36.1%) diet was fed (Kienzle 1994). The reason for cats in our study not demonstrating post-prandial hyperglycaemia when fed typical feline diets is unknown. It should be noted that the diabetic cats had blood glucose values which were markedly elevated above the normal range at most times during testing, apart from at times when injected insulin was exerting its most pronounced blood-glucose lowering effect.
The insulin-treated diabetic cats showed no significant correlation between the 2-h blood glucose change and food intake values. The insulin injections these cats received led to constantly rising and falling blood glucose levels, with eating occurring apparently randomly throughout the day (Fig 4). Therefore, it seems unlikely that food ingestion is a major cause of fluctuating blood glucose levels in insulin-treated diabetic cats.
Cats possess a high transport capacity for D-glucose across the intestinal brush border epithelium, but have a short small intestine limiting the absorptive surface, so their capacity for carbohydrate absorption is uncertain (Wolffram et al 1989). A factor which may limit the ability of cats to absorb carbohydrates is their inability to up-regulate intestinal monosaccharide transport in response to an increase in the carbohydrate content of the diet over several weeks (Buddington et al 1991). In keeping with the high protein content of the ‘natural’ feline diet, cats are able to up-regulate selectively the absorption of specific amino acids when high-protein diets are fed (Buddington et al 1991). It has been observed previously that the carbohydrate digestibility of cat foods decreases with increasing protein content (Hashimoto et al 1995), so the protein content of the cat foods we used may have been sufficient to inhibit carbohydrate absorption and hence no post-prandial blood glucose rise resulted. When cats were fed a high carbohydrate diet (70% carbohydrate) (Kettlehut et al 1980), the liver glycogen content increased significantly, so absorbed carbohydrate is possibly sequestered into the liver glycogen stores without reaching the systemic circulation.
Paradoxically, it is known that cats normally have a limited capacity to metabolise sugars (Kienzle 1994), which is characterised by a low hepatic glucose hexokinase activity and a low rate of D-glucose transport across cellular membranes in comparison with dogs. This indicates that cats have a comparatively lower capacity of the liver and other tissues to remove glucose from plasma (Arai et al 1992).
Effect of overnight fasting on blood glucose
Our study demonstrates that a similar level of morning glycaemia occurs in cats with insulin-dependent diabetes whether or not food is withheld overnight. It therefore seems unnecessary to adjust the insulin dose based on the amount of food fed or consumed in insulin-treated diabetic cats over the previous 12 h. As this study did not examine the effects on blood glucose concentration of a fast of longer than 12 h, no recommendations can be made regarding insulin doses if a diabetic cat fails to eat for more than 12 h.
Blood glucose falls to <6.0 mol/l in normal humans after an overnight fast (10–14 h) (Felig & Bergman 1995). An overnight fast causes a significant drop in blood glucose in humans with mild type 2 diabetes (Gannon et al 1996). Cats made glycosuric by partial pancreatectomy and the administration of anterior-pituitary extract became aglycosuric after fasting. However, blood glucose values were not measured and the resemblance of this experimental model to naturally occurring diabetes in cats is uncertain (Lukens & Dohan 1942). Fasting in clinically healthy cats previously fed a high carbohydrate diet (70% carbohydrate) led to a subsequent significant drop in blood glucose (mean reduction of approximately 0.7 mmol/l) after 24 h, whereas cats fed a high protein diet (63% protein) did not have a reduction in blood glucose after fasting, even after a 48-h fast (Kettlehut et al 1980). In each of these studies, the levels of carbohydrate and protein used were excessively high in comparison to a typical commercial cat food (Kettlehut et al 1980). In a similar report, a small but significant drop in blood glucose (mean approximately 0.5 mmol/l) was seen in normal cats fed a standard feline diet after a 48-h fast, with a greater drop in blood glucose (mean approximately 1 mmol/l) seen in cats previously fed a high carbohydrate diet (72% carbohydrate) then fasted for 48 h (Trulson et al 1983). It was suggested that the lack of change in fasting blood glucose levels after a high protein diet was fed was due to the high gluconeogenic capacity of cats (Kettlehut et al 1980). Despite this observation, there was no change in activities of enzymes involved in gluconeogenesis and carbohydrate metabolism in the livers of normal cats when fed high protein or carbohydrate vs low protein or carbohydrate diets (Rogers et al 1977).
The apparent lack of effect of a low blood glucose level on appetite in diabetic cats
In our study, low blood glucose did not stimulate appetite in diabetic cats. Due to the small number of instances seen and limitations of accuracy of the pocket glucose meter, a definite conclusion could not be drawn. However, the observation that hypoglycaemia did not stimulate appetite is consistent with the study's findings regarding the lack of post-prandial blood glucose rise, because food ingestion would not be expected to normalise blood glucose levels in cats which were hypoglycaemic.
The lack of feeding in normal cats in response to glucose deprivation was inferred from the lack of response to the glucose analogue 2-deoxy-D-glucose (2-DG), at a dose of 250–750 mg/kg (Jalowiec et al 1973). However, normal cats increased food intake after injection of a lower dose of 2-DG (50–100 mg/kg) (Rowland 1981). In the latter study normal cats increased food intake after injection of insulin and food deprivation; however, the sample size was small (two of three cats responded significantly) and blood glucose levels were not measured (Rowland 1981, N. Rowland, pers. comm.)
Hypoglycaemic unawareness is also a possible cause of the lack of appetite stimulation from hypoglycaemia in three feline diabetics which did not eat when blood glucose was low, as this phenomenon has been recorded in diabetics of other species (Mokan et al 1994, Duesberg et al 1995).
Based on the results of our study, it is concluded that meals do not need to be timed to coincide with insulin administration in diabetic cats and that diabetic cats can be fed ad libitum, due to the lack of post-prandial hyperglycaemia. This allows a typical feline food ingestion pattern of many small snacks throughout the day and night in diabetic cats. This may be unsuitable for the obese diabetic cat where control of energy intake is necessary to achieve weight loss.
The lack of post-prandial hyperglycaemia in normal and diabetic cats and the lack of change in morning blood glucose after an overnight fast indicate that an overnight fast is unnecessary prior to measuring a baseline blood glucose level in cats. The lack of change in morning blood glucose after an overnight fast indicates that insulin dose need not be altered if a diabetic cat eats less than its usual amount over a period of up to 12 h. The effect of fasting for longer than 12 h on blood glucose in diabetic cats is unknown.
If a diabetic cat is fed a typical feline diet, this study shows that the ingested food is unlikely to lead to a subsequent rise in blood glucose. Therefore, it cannot be assumed that ingestion of food will offset the blood glucose-lowering effect of injected insulin. This indicates a need for caution when treating diabetic cats with insulin, especially when using short or intermediate acting insulins which have a distinct peak of action.
Footnotes
Acknowledgements
The assistance of Intervet International, BV (The Netherlands) in performing this study is gratefully acknowledged.