
Abstract
Delay discounting refers to the reduction in the present value of a future reward as the delay to that reward increases, which is related to various problematic behaviors, such as substance abuse. In this study, we explored the neuroanatomical correlates of delay discounting by employing voxel-based morphometry and the individual difference approach. We found that participants’ delay discounting, measured by the Monetary Choice Questionnaire, was correlated with the gray matter volume (GMV) of two cortical regions. On the one hand, individuals with a larger GMV of the orbitofrontal cortex (OFC) were likely to discount future values less steeply and choose large but delayed rewards. On the other hand, individuals with a larger GMV of the anterior cingulate cortex (ACC) are likely to discount the future value more steeply and prefer small but immediate rewards. Our study revealed the neuroanatomical correlates of delay discounting across the whole brain, and may help to understand the delay discounting in the frame of the hot versus cool system, which demonstrates the dynamics of resisting present temptation for future rewards.
In our daily life, we frequently face conflicts in decision making between a small but immediate reward (SIR), such as eating high-cholesterol cheesecake, and a large but delayed reward (LDR), such as having a healthy body shape. The rational choice is simple, which is to choose LDR over SIR. However, in reality we find it difficult to resist SIR, because in our mind the present value of LDR is significantly reduced because of the delay in time. Kirby and Marakovic (1995) coined this phenomenon as “delay discounting”, which refers to the reduction in the present value of a future reward as a function of the delay to that reward. The consequence of the lack of delay discounting can be devastating, as individuals who prefer SIR are more likely to perform worse in scholastic tests (Mischel, Shoda, & Rodriguez, 1989), have more impulsive behaviors (Richards, Zhang, Mitchell, & Wit, 1999), and suffer misconducts such as gambling (Alessi & Petry, 2003), cigarette smoking (Bickel, Odum, & Madden, 1999), alcohol consumption (Vuchinich & Simpson, 1998), substance abuse (Bickel & Marsch, 2001; Madden, Petry, Badger, & Bickel, 1997; Petry, 2002, 2003; Petry & Casarella, 1999), and mental illness (Allen, Moeller, Rhoades, & Cherek, 1998; Crean, de Wit, & Richards, 2000). Here in this study, we examined the neuroanatomical correlates of delay discounting, which may shed light on its underlying mechanism.
A great number of studies have been conducted to study the neural correlates of delay discounting from neurophysiological (Kalenscher, Windmann, Diekamp, Rose, & Colombo, 2005; Montague & Berns, 2002), neuropsychological (Cardinal, Pennicott, Lakmali, Robbins, & Everitt, 2001; Sellitto, Ciaramelli, & di Pellegrino, 2010), and neuroimaging perspectives (brain structure: Bjork, Momenan, & Hommer, 2009; Yu, 2012; brain function: Casey et al., 2011; Shamosh et al., 2008; brain connectivity: Christakou, Brammer, & Rubia, 2011; Peters & Büchel, 2010). These studies have identified that multiple regions are involved in delay discounting, such as the hippocampus (Bar, 2009; van der Meer, Johnson, Schmitzer-Torbert, & Redish, 2010), the medial prefrontal cortex (Kable & Glimcher, 2007; Luhmann, Chun, Yi, Lee, & Wang, 2008; McClure, Ericson, Laibson, Loewenstein, & Cohen, 2007; McClure, Laibson, Loewenstein, & Cohen, 2004; Peters & Büchel, 2009; Weber & Huettel, 2008), the orbitofrontal cortex (OFC; Myerson, Green, Scott Hanson, Holt, & Estle, 2003; Roesch, Taylor, & Schoenbaum, 2006), the anterior cingulate cortex (ACC; Hoffman et al., 2008; Marco-Pallarés, Mohammadi, Samii, & Münte, 2010; McClure et al., 2007; Pine et al., 2009), the posterior cingulate cortex (Ballard & Knutson, 2009; Kable & Glimcher, 2007; Luhmann et al., 2008; McClure et al., 2007; McClure et al., 2004; Peters & Büchel, 2009; Weber & Huettel, 2008), the ventral striatum (Ballard & Knutson, 2009; Kable & Glimcher, 2007; Luhmann et al., 2008; McClure et al., 2007; McClure et al., 2004; Peters & Büchel, 2009; Weber & Huettel, 2008; Wittmann, Leland, & Paulus, 2007), and the dorsolateral prefrontal cortex (Leon & Shadlen, 1999; Roesch & Olson, 2003; Schultz, Tremblay, & Hollerman, 2000; Tanaka et al., 2004; Tsujimoto & Sawaguchi, 2005; Wallis & Miller, 2003). Specifically, the ACC and OFC are the two classic brain regions that are involved in delay discounting. The OFC is involved in delay discounting via representing the incentive value of rewards (Peters & Büchel, 2011), whereas the ACC is involved in delay discounting via conflict monitoring and strategy adaptation (Hoffman et al., 2008; Marco-Pallarés et al., 2010; Pine et al., 2009).
Most of these studies have focused on the functionality of these regions in delay discounting, and only three studies have explored the neuroanatomy (Bjork et al., 2009; Cho et al., 2013; Yu, 2012) that is the basis of the functionality. However, the findings from these three studies are not consistent. Bjork et al. (2009) used a region of interest approach and found greater discounting of delayed rewards was correlated with a small cluster of the inferolateral frontal cortex and the dorsolateral frontal cortex, whereas with a whole-brain, voxel-based analysis approach, Yu (2012) and Cho et al. (2013) failed to find any neuroanatomical correlates in the gray matter. The inconsistency possibly resulted from the lack of sufficient power to detect the neuroanatomical correlates. For example, Yu’s study (2012) reported several gray matter volumes (GMV) correlated with delay discounting, but the correlation did not reach significance after whole-brain correction. Cho et al. (2013) relied on small volume correction to identify the association between the GMV of the ACC and the OFC and delay discounting. This may explain why Bjork et al. (2009) chose to focus on a small portion of the brain (i.e., the frontal cortex), but this approach provides incomplete information for the relation between neuroanatomy and functionality in delay discounting in the whole brain.
To reveal the neuroanatomical correlates of delay discounting across the whole brain, here we measured the degree of delay discounting of a larger sample of participants (
Materials and Methods
Participants
We used G*Power to estimate the sample size needed in the present study (Faul, Erdfelder, Buchner, & Lang, 2009). Assuming small-to-moderate effect sizes (i.e.,
Assessment of delay discounting
The degree of delay discounting was assessed with the Monetary Choice Questionnaire (MCQ; Kirby, Petry, & Bickel, 1999). The MCQ is a self-report measure that consists of a set of 27 choices between pairs of two monetary rewards – one small but immediate reward (SIR) and one large but delayed reward (LDR), such as “Would you prefer ¥55 today or ¥75 in 61 days?”, and the participants indicated their preferred reward. In the questionnaire, the SIRs ranged from ¥11 to ¥80, whereas the LDRs ranged from ¥25 to ¥85, with delays ranging from 1 week to 6 months.
Each participant completed his/her own questionnaire separately. To ensure the participants made choices based on their genuine preference, besides the monetary compensation for the experiment, they also received the reward based on their choice randomly selected among 27 choices of the completed questionnaire. There was no time limit for finishing the MCQ.
The degree of delay discounting, also coined as a
The
MRI acquisition
Participants were scanned using a Siemens 3T-scanner (MAGENTOM Trio, a Tim system) with a 12-channel phased-array head coil at BNU Imaging Center for Brain Research, Beijing, China. Magnetic resonance (MR) structural images were acquired using a 3D magnetization-prepared rapid gradient-echo (MP-RAGE) T1-weighted sequence (TR/TE/TI = 2530/3.39/1100 ms, flip angle = 7 degrees, FOV = 256 × 256 mm). To cover the whole brain, 128 contiguous sagittal slices were acquired with 1 × 1 mm in-plane resolution and a 1.33-mm slab thickness.
Image processing for VBM
VBM was used to explore the neuroanatomical correlates of delay discounting. VBM provides a quantitative measure of tissue volume for each voxel (Ashburner & Friston, 2000), which was performed using SPM8 (Statistical Parametric Mapping, Wellcome Department of Imaging Neuroscience, London, UK), with an optimized VBM protocol (Good et al., 2001) on T1-weighted structural images. First, the quality of structural images was assessed manually by visual inspection. Six participants were removed from further analyses because of extraordinary scanner artifacts (e.g., head movement during MRI scanning) or abnormal brain structure (e.g., unusually large ventricles). Second, the brain origin for each participant was manually set to the anterior commissure. Third, using a unified segmentation approach, four distinct tissue classes: gray matter (GM), white matter, cerebrospinal fluid, and everything else (e.g., skull and scalp) were segmented from the structural images (Ashburner & Friston, 2005). Fourth, the GM images were spatially normalized to the Montreal Neurological Institute (MNI) 152 space using the Diffeomorphic Anatomical Registration through Exponential Lie algebra (DARTEL) registration method (Ashburner, 2007). DARTEL registration involves repetitively computing the study-specific template and warping the GM images to the generated template. Fifth, to preserve the original gray matter volume (GMV) for each participant, the normalized individual GM images were modulated by multiplying each voxel’s GM value with the voxel-specific Jacobian determinants derived from the spatial normalization. The modulated GM images, depicting a GMV measure for each voxel, were then smoothed using an 8-mm, full-width at half-maximum (FWHM) isotropic Gaussian kernel. Finally, the modulated GM images were masked using an absolute masking with a threshold of 0.2. That is, all voxels with a GMV value less than 0.2 were excluded. The masked-modulated GM images were further examined with a statistical analysis.
Statistical analysis
A whole-brain GMV analysis was performed to explore neuroanatomical correlates of delay discounting. Because four participants were excluded in the behavioral assessment on delay discounting and six participants showed unsatisfied MR image quality, 315 participants (96.9% of the total participant population) were included in this analysis (169 females, 18–25 years of age, mean age = 21.85 years,
Results
Participants’ Ln(
To explore the neuroanatomical correlates of delay discounting, we correlated the GMV of each voxel across the whole brain with the Ln(
Clusters of voxels correlated with delay discounting

Note: MNI = Montreal Neurological Institute.

Neuroanatomical correlates of delay discounting in the left OFC. A cluster with a negative correlation between GMV and the Ln(
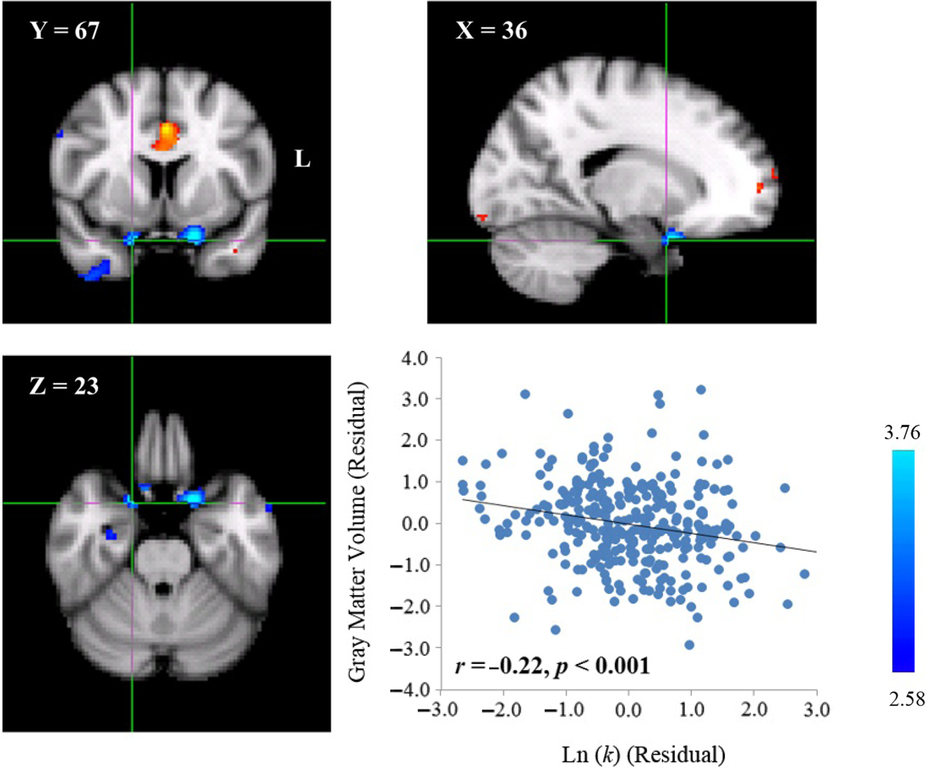
Neuroanatomical correlates of delay discounting in the right OFC. A cluster with a negative correlation between GMV and the Ln(
In contrast, the Ln(
Neuroanatomical correlates of delay discounting in the ACC. A cluster with a positive correlation between GMV and the Ln(
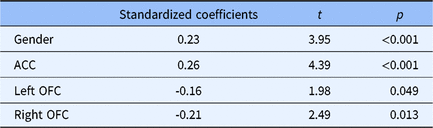
In summary, three brain regions have been found to be associated with delay discounting in this study: the ACC, the left OFC and the right OFC (Table 1). Here, we further asked how these three brain regions were related to delay discounting. Did they independently contribute to delay discounting, and how much did individual differences of these three regions explain individual differences of delay discounting? To answer these questions, we performed a stepwise multiple regression analysis, where the Ln(
The variables explained the individual differences in delay discounting
Discussion
In the present study, we used the individual difference approach to investigate the neuroanatomical correlates of delay discounting across the whole brain. First, we found negative correlations of the left and right OFC’s GMV with the Ln(
The finding that larger OFC’s GMV was associated with the preference to LDRs is consistent with previous studies. In neuropsychological studies, the lesion of the OFC in both humans (Berlin, Rolls, & Kischka, 2004; Sellitto et al., 2010) and animals (Mobini et al., 2002; Rudebeck, Walton, Smyth, Bannerman, & Rushworth, 2006) leads to steep discounting of future values and strongly prefers SIRs. In addition, a neuroimaging study reveals that the weaker the activation of the bilateral OFC is, the more likely that individuals choose SIRs (Boettiger et al., 2007). Our finding provides a possible interpretation on these studies because smaller OFC’s GMV suggests a smaller number or a smaller body size of neurons in the OFC. As a result, the OFC was unable to generate sufficient neural activation to serve its role properly as a part of the cool system (Metcalfe & Mischel, 1999) that represents the incentive value of rewards (Chib, Rangel, Shimojo, & O’Doherty, 2009; Kable & Glimcher, 2009; Kringelbach & Rolls, 2004; Peters & Büchel, 2010) and engages cognitive control to suppress impulsivity.
In contrast, as a part of the hot system (Metcalfe & Mischel, 1999), the ACC is located in the limbic system. The limbic system, which is a core region in representing rewards (Gregorios-Pippas, Tobler, & Schultz, 2009) and pleasure (Haines & Ard, 2006), has a great preference for instant gratification. Therefore, it is not surprising that individuals with larger ACC’s GMV prefer SIRs. Besides, the ACC is thought to be involved in delay discounting through conflict monitoring and strategy adaptation (Peters & Büchel, 2011). Indeed, the degree of decision conflicts is found to be correlated with the neural activation of the ACC, with higher activation for a harder decision (Hoffman et al., 2008; Marco-Pallarés et al., 2010; Pine et al., 2009). That is, for the same conflict between SIR and LDR, individuals with larger ACC’s GMV may consider the conflict more severe, which requires more resources to solve the conflict. Therefore, they may choose the SIR that consumes less amount of resources, which finally leads to a steep reduction in future values.
In sum, we demonstrated the neuroanatomical correlates of the OFC and the ACC in delay discounting. This finding relied heavily on a large number of participants because the correlation between the GMV of these two regions and the behavioral performance in delay discounting was moderate. Indeed, previous efforts with a whole-brain analysis in establishing such a relationship apparently suffered insufficient statistical power (Cho et al., 2013; Yu, 2012). For example, 112 participants in Yu’s (2012) and 36 participants in Cho et al.’s (2013) studies were much smaller than the number of participants suggested by the power analysis. Therefore, future studies in establishing neuroanatomical correlates may need a large number of participants or data gathered from multiple studies. Second, we also suggested the division of labor of these two regions, as their correlation to delay discounting is in the opposite direction. That is, the OFC is in the prefrontal cortex, which belongs to the cool system, whereas the ACC is a part of limbic system, which is the core of the hot system. Therefore, our finding fits nicely with the hot versus cool system, with the ACC competing for SIRs and the OFC suppressing impulsive behaviors with cognitive control (Hirsh, Guindon, Morisano, & Peterson, 2010). Future studies are needed to elucidate the role of the hot versus cool system in delay discounting on how a balanced hot and cool system leads to an optimal choice between presence and the future.
Footnotes
Acknowledgements
We thank Zonglei Zhen, Lijie Huang, Xiangzhen Kong, and Xu Wang for technical supports on data analyses.