
Abstract
To obtain rich information about the cognitive diagnosis of borderline personality disorder (BPD), this study attempted to retrofit a traditional borderline personality questionnaire so that the improved assessment (called CDA-BPD) could provide more diagnostic information. The retrofitting processes included the following steps: (1) applied an cognitive diagnosis model to analyze the psychometric characteristics of the traditional questionnaire; (2) under the guidance of cognitive diagnosis assessment (CDA), high-quality items were chosen to develop the CDA-BPD and tested on 1,097 subjects; (3) the quality of the CDA-BPD was evaluated; (4) the structure of the CDA-BPD was analyzed. Results indicated that: (1) the CDA-BPD had acceptable reliability and validity; (2) the CDA-BPD had sensitivity of 0.985 and specificity of 0.853 with area under curve (AUC) = 0.956; (3) the two structural factors of the traditional questionnaire were confirmed in the CDA-BPD; χ2 was 83.01 with df = 26, p < .0001, comparative fit index (CFI) = 0.97, root mean square error of approximation (RMSEA) = 0.045. It was concluded that the practice of retrofitting a traditional borderline personality assessment for cognitive diagnostic purpose was feasible. Most importantly, under the cognitive diagnosis model framework, CDA-BPD could simultaneously provide general-level information and the detailed symptom criteria-level information about the posterior probability of satisfying each symptom criterion in the Diagnostic and Statistical Manual of Mental Disorders (5th edition; DSM-5; American Psychiatric Association, 2013) for each individual, which gave further insight into tailoring individual-specific treatments for borderline personality disorder.
Keywords
Borderline personality disorder (BPD), one of the cluster B Axis II personality disorders in the Diagnostic and Statistical Manual of Mental Disorders (5th edition; DSM-5; American Psychiatric Association, 2013), is a pervasive pattern of instability of interpersonal relationships, self-image, affects, and marked impulsion, which begins in early adulthood and is considered to be the most prevalent personality disorder in an inpatient setting (Kröger, Huget, & Roepke, 2011). Nine diagnostic criteria of BPD are defined in the DSM-5, which specifies the core cognitive, behavioral and interpersonal characteristics for identifying and differentiating BPD from other personality and psychiatric disorders (Aggen, Neale, Røysamb, Reichborn-Kjennerud, & Kendler, 2009). Five or more of these nine criteria must be present for a diagnosis of BPD, according to the DSM-5.
To measure and assess BPD, a great number of self-reported instruments have been developed, including the McLean Screening Instrument for Borderline Personality Disorder (MSI-BPD; Zanarini et al., 2003), the Zanarini Rating Scale For Borderline Personality Disorder (ZAN-BPD; Zanarini, 2003), the Borderline Personality Questionnaire (BPQ; Poreh et al., 2006), and the Five Factor Borderline Inventory (FFBI; Mullins-Sweatt et al., 2012). These instruments were established using classical test theory (CTT), in which an individual’s test score is determined by recognizing his or her location along a single proficiency continuum (de la Torre & Minchen, 2014), and this score is available for general information about the overall level of symptoms in the spectrum of each instrument taker. Furthermore, these instruments have played an important role in psychological disorder assessments and thus have been popular, partly due to their utility relative to clinical use. However, as some individuals may have different symptoms of BPD although they received the same score, and because the score is only a rough indicator of whether a person has BPD, physicians could not obtain detailed information and were unable to provide targeted treatment for these individuals. Thus, the original intent and design of these assessments could not provide fine-grained diagnostic information and the assessments were not able to provide individual-specific treatments for BPD.
With the developing need for fine-grained information extractable from scale performance data, cognitive diagnosis is now drawing wide attention among researchers and practitioners in psychological disorder measurement, especially due to its potential for diagnosis of individual features and effective individual-specific treatments. Cognitive diagnostic assessments (CDAs; Roberts & Gierl, 2010) aim to provide formative diagnostic feedback through fine-grained reporting of an individual’s attributes (Jang, 2009). A key aspect of cognitive diagnostic assessments is that cognitive psychology and cognitive diagnosis models (CDMs) are combined within a single framework in these assessments, which enables researchers to assess both general-level diagnostic information and detailed criteria-level information of individuals in a particular assessment domain (Y.W. Lee & Sawaki, 2009). This trend also led to the development of various new psychometric models for cognitive diagnosis that allowed mathematical modeling of individual symptom patterns (de la Torre, 2009; Yi, 2017). Although most of the development and application of CDMs were carried out in the field of education, these models also had sufficient applicability and generality to be applied to the diagnosis of psychological disorders (de la Torre, van der Ark, & Rossi, 2018; Jaeger, Tatsuoka, Berns, & Varadi, 2006; Templin & Henson, 2006).
Nevertheless, it is noteworthy that designing a new cognitive diagnostic assessment for BPD is an expensive, time-consuming and cumbersome process. Because of this, retrofitting provides an effective way to obtain the benefits of CDMs that do not have existing BPD assessments designed directly for cognitive diagnosis purposes. Retrofitting the existing BPD assessments under the CDM framework was a possible approach to improve the original assessment for the cognitive diagnoses to provide more useful information (Chen & Chen, 2016; Liu, Huggins-Manley, & Bulut, 2018; Tu, Gao, Wang, & Cai, 2017).
To investigate how CDM applications could offer specific information for the diagnosis of BPD, the present study aimed to retrofit the traditional BPD questionnaire under the CDM framework. The improved BPD assessment with cognitive diagnostic properties (called CDA-BPD) is the focus of this article: it was able to obtain both general and accurate information for diagnosis and symptom spectrum of BPD, and therapy for BPD. Compared with the conventional self-reported assessments of BPD, the improved assessment in this study was expected to not only estimate the posterior probability of borderline personality disorder (PPBPD) according to the DSM-5, but also estimate each individual’s unique symptom profile or symptom spectrum, which could potentially increase clinical treatments’ effectiveness.
CDM framework for retrofitting
General information for retrofitting the traditional BPD Questionnaire
As mentioned, early self-reported assessments did not provide any further insights into the specific areas of BPD. In order to address this problem, the present study aimed to retrofit the traditional BPD questionnaire under the CDM framework. The improved BPD assessment with cognitive diagnostic properties (CDA-BPD) can measure and evaluate BPD using the symptoms in the DSM-5, and offer cognitive diagnosis information beyond what a single test score could provide using these criterion profiles.
The CDA-BPD was initially administered using the traditional BPD instrument – the Borderline Personality Questionnaire (BPQ; Poreh et al., 2006) – an 80-item true/false self-report scale that comprises nine subscales corresponding to the nine BPD criteria of the Diagnostic and Statistical Manual of Mental Disorders (4th ed., text-rev.; DSM-IV-TR; American Psychiatric Association, 2000). This study chose the BPQ questionnaire for the following reasons: (1) The BPQ is a representative and widely used questionnaire, and researchers have confirmed that it is a reliable and valid tool to assess borderline personality features (Fonseca-Pedrero, Paino, Lemos-Giráldez, Sierra-Baigrie, & Muñiz, 2011); (2) The BPQ is a true/false self-reported instrument that exactly meets the requirement of the CDM for dichotomic data. Although the BPQ is based on DSM-IV-TR criteria, many studies report that there are no differences between the definitions of the nine symptoms of BPD in the DSM-IV-TR and DSM-5 (Conway, Hammen, & Brennan, 2012; Iacono, 2013), so the BPQ was still of significance for the current measurement of BPD.
Additionally, a crucial step to conduct the CDA-BPD was to construct a Q-matrix, which played an important role because it describes what attributes or symptom criteria are measured by each item. Let qjk denote the element in row j and column k of a J × K Q-matrix, where J and K represented the numbers of items and attributes/symptom criteria respectively. The element qjk was specified to be 1 if the kth attribute was required to answer item j correctly, and zero otherwise. The quality of the Q-matrix determines the quality of the estimated diagnostic model, and a poorly created Q-matrix provides less informative diagnostic or classification indices (Tatsuoka, 1990). In the present study, in order to guarantee the highest quality, the Q-matrix of the CDA-BPD was directly based on the primal BPQ scale (Poreh et al., 2006), which describes the relationship between 80 items and nine attributes/symptom criteria. Appendix A shows the initial Q-matrix of the BPQ scale used in this article. Each row of the Q-matrix pertains to an item, and each column to a symptom. For example, the first row denotes that item 1, “I often do things without thinking them through”, measures “Impulsivity in at least two areas that are potentially self-damaging (e.g. spending, sex, substance abuse, reckless driving, binge eating)” (Symptom 4), while item 2, “I often become depressed or anxious out of blue”, measures “Affective instability due to a marked reactivity of mood (e.g. intense episodic dysphoria, irritability, or anxiety usually lasting a few hours and only rarely more than a few days)” (Symptom 6). It is critical that all CDMs are equivalent when all items have a simple structure.
Cognitive diagnosis model: G-DINA model
The aim of CDMs is to build close connections between individuals’ item responses and their attribute patterns or symptom profiles. In the last few years, several CDMs have been proposed (Templin & Henson, 2010). Those vary in the way that attributes are combined and formalized to estimate the probability of item responses. Most of the applications of CDMs in psychological assessment in particular have involved deterministic inputs, the noisy “and” gate model (DINA; Junker & Sijtsma, 2001), the addictive cognitive model (ACDM; de la Torre, 2011), and the reduced reparametrized unified model (RRUM; Hartz, 2002). To synthesize the various CDMs, de la Torre (2011) proposed a general model, the G-DINA (generalized deterministic inputs, noisy “and” gate) model, which allowed reformulating many of the existing CDMs as special cases of this general model.
In the G-DINA model, the required attributes for item could be represented by the reduced vector 


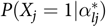
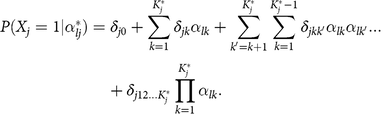
The function above was the sum of the effects based on the presence of specific attributes and their interactions. Specifically, δ
j
0 represented the baseline probability of a correct response when none of the required attributes was mastered; δ
jk
was the main effect due to attribute α
k
, or the change in the probability of a correct (or most effective) response when a single attribute (i.e. α
k
) was mastered; δ
jkk
’, a first-order interaction effect, represented the change in the probability of a correct response when both α
k
and α
k
’ were mastered; and 
The saturated model based on the above function covered all possible item effects (e.g. intercept, main, and interaction effects). By constraining some item effects of the saturated forms, the G-DINA model could be transformed into different reduced CDMs. For example, the DINA model (Junker & Sijtsma, 2001) only included the intercept and final interaction effects, and it was expressed as
The ACDM model (de la Torre, 2011) is a special case of the G-DINA model by supposing no interaction effects, and it was formulated as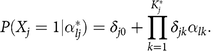
The RRUM model (Hartz et al., 2002) is the log-link G-DINA model without interaction terms, and it was defined as
More technical details about the saturated and reduced CDMs can be found in de la Torre (2011) and de la Torre and Chen (2011).
Symptom criteria of BPD in the DSM-5
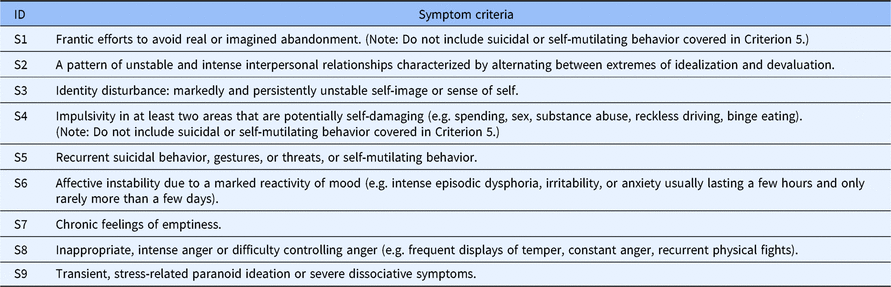
The DSM-5 defines the main features of BPD, and for an individual to be classified as BPD, he or she must satisfy five or more symptom criteria in Table 1. It should be emphasized that the DSM-5 diagnostic criteria for BPD has been widely used in academic research and clinical diagnostic practice (Bach, Sellbom, Bo, & Simonsen, 2016; Ferrer et al., 2018; Miller, Morse, Nolf, Stepp, & Pilkonis, 2012).
Symptom criteria of BPD defined in the DSM-5
In this context, with the response data, CDM could estimate two kinds of probabilities for each individual, specifying the posterior probability of satisfying each criterion according to the DSM-5 (Templin & Henson, 2006), and the posterior probability of meeting five or more criteria of borderline personality disorder (PPBPD), which was also the probability of BPD in the DSM-5. Specifically, if an individual had a PPBPD greater than .5, then the individual could be classified as BPD. It should be noted that the posterior probability of satisfying each criterion for each individual showed differences in why an individual received a diagnosis of BPD; for example, two individuals who were both diagnosed as BPD may have diverse pathogeny paths for the disorder because they had different probabilities of symptom criteria. Specifically, except when several other criteria of BPD are met, the first individual may be very sensitive to environmental circumstances, and they may experience intense abandonment fears and inappropriate anger even when faced with a realistic time-limited separation or when there are unavoidable changes in plans (S1). The first individual also may display recurrent suicidal behavior, gestures, threats, or self-mutilating behavior (S5). The second individual may differ from the first individual in that he or she may be troubled by chronic feelings of emptiness (S7) and may frequently express inappropriate, intense anger or have difficulty controlling their anger (S8). Both individuals may be diagnosed as BPD, but the expressions of their disorders are the result of distinct behaviors. The probability of any individual meeting any defined criterion could be estimated by the CDM.
A cognitive diagnosis structure of symptom criteria for the CDA-BPD
The present study not only focused on the evaluation of BPD, but also investigated the potential structure of psychological traits. The underlying structure of the CDA-BPD was based on one explored by Poreh et al. (2006). According to Poreh et al., BPD has two underlying traits: identity/interpersonal and impulsivity. The identity/interpersonal factor includes abandonment (S1), relationships (S2), self-image (S3), affective instability (S6), emptiness (S7), and quasi-psychotic states (S9). The impulsivity factor includes impulsivity (S4), suicide (S5), and intense anger (S8). This study applied a CDM to verify the structure between the two factors and nine symptom criteria. Because the CDM could estimate the presence or absence of a set of criteria, it was possible to model the association between these criteria and verify the structure suggested by Poreh et al. (2006). According to Templin and Henson (2006), a method to model the probability of class membership is the concept of tetrachoric correlations to place the structure on the joint distribution of the attributes. A tetrachoric correlation is the correlation between two underlying normally distributed variables that have both been dichotomized by respective cut-point parameters. This study dichotomized each criterion by using the marginal probability of all participants for each criterion as a cut-point. Therefore, a set of cut-point parameters was estimated. The cut-point parameters were essential because they could be converted to a proportion (or percentage) representing the marginal level of presence for each attribute (or, in the study, satisfaction of each criterion). Such parameters provided information regarding the base rate of each attribute in the population represented by the data set (Templin & Henson, 2006).
Measures
The present study used the Chinese version of the MIS-BPD (Wang et al., 2008) and PDQ-4-BPD (Yang et al., 2000) as an evidence to support the convergent validity of the CDA-BPD for two reasons: (1) they are both self-reported scales of BPD based on the DSM diagnostic system and are widely used in Chinese BPD research; (2) the Chinese version of the MIS-BPD (Wang et al., 2008) and the PDQ-4-BPD (Yang et al., 2000) have good reliability and validity that have been demonstrated in many studies (H. Chen, Zhong, & Liu, 2011; Huang et al., 2014).
Participants
The total sample came from 20 Chinese universities and consisted of 1,097 participants who agreed to take part in the study after being informed that their personal information would be kept secret and the test would occupy them for about half an hour. The sample had a mean age of 20.63 years (SD = 1.524, range = 18–24) and included 431 males (39.3%) and 666 females (60.7%). The total sample included two parts: one part had 1,029 participants who were used to calibrate the item parameters of the CDA-BPD via CDM; the other part was comprised of 68 participants who were used as a validation sample to assess the sensitivity and specificity of the CDA-BPD.
The validation sample included two paired groups according to the demographic characteristics: BPD group (N 1 = 34) and health group (N 2 = 34).
Statistical analysis
The statistical analysis consisted of five steps as follows.


In the above function, sj
(slip parameters) referred to the probability that an individual with all required attributes provided an incorrect response, gj
(guessing parameters) referred to the probability that an individual without all required attributes provided a correct response. 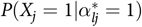

In the current study, the method used to analyze the structure of the CDA-BPD was different from Poreh et al (2006). Specifically, the nine criteria were treated as dichotomous variables by nine respective cut-point parameters (the study dichotomized each criterion by using the marginal probability of all participants for each criterion as a cut-point). These cut-point parameters were able to be converted to a proportion representing the marginal level of presence each criterion. Then the tetrachoric correlations among pairs of nine criteria were analyzed and this was used to verify the structure of symptom criteria for the CDA-BPD. And the method mentioned above was referred to Templin and Henson (2006).
The ratio of chi-square to the degrees of freedom (df) was calculated in addition to chi-square to evaluate model fitting, with ratios between 1.5 and 5.0 indicating acceptable fit (Byrne, 2012). Additional parameters for fit estimation were: the normal fit index (NFI), the non-normal fit index (NNFI), the comparative fit index (CFI), the root mean square error of approximation (RMSEA), the goodness of fit index (GFI), the adjusted goodness of fit index (AGFI). RMSEA values of 0.08 or lower and NFI, NNFI, CFI, GFI, AGFI values of 0.90 or higher were considered acceptable (Browne & Cudeck, 1993; Hu & Bentler, 1999). Criterion level confirmatory factor analysis (CFA) was carried out with LISREL 8.0 (Joreskog & Sorbom, 1996) in the current study.
Results
Item analysis of the CDA-BPD
Following the removal of items according to the statistical guidelines (see Step 2 in the statistical analysis section), 55 items were finally included for the CDA-BPD, which are displayed in Table 2. The final 55 items fitted the CDM (i.e. G-DINA model) well (p > .01), had no DIF (p > .01) on sex group or region group, and had a mean discrimination of 0.37 (SD = 0.08). Out of 55 items, 38.2% items had an “excellent” level of discrimination (≥0.40) and 40.0% items had a “good” level of discrimination (0.30~0.39), which indicated that the remaining 55 items of the CDA-BPD had a high discrimination of item response probability between participants who met or did not meet symptom criteria assessed by these items. Furthermore, the final CDA-BPD assessed all nine symptom criteria for BPD defined in the DSM-5. The number of items assessed each symptom level ranged from 4 to 10 with an average of 7.
The 55 selected items of the final CDA-BPD
Reliability and validity
The reliability of the CDA-BPD was investigated based on both CTT and CDM frameworks. Under the CTT framework, the Cronbach’s alpha coefficient of the CDA-BPD was .914 and the Guttman split-half was .880. However, in the CTT framework, the traditional statistical methods could not estimate the reliability for each symptom criterion. CDM represented a new way for estimating the reliability of these nine symptom criteria in DSM-5. Results showed that under the CDM framework, the classification consistency reliability of nine attributes ranged from 0.919 to 0.946 with an average of 0.933, and the classification accuracy reliability of nine attributes ranged from 0.929 to 0.955 with an average of 0.941. Besides, Templin’s attribute reliability of nine attributes ranged from 0.925 to 0.980 with an average of 0.964. These results indicate that the reliability of CDA-BPD was acceptable.
As for the convergent validity of the CDA-BPD, the test score of the CDA-BPD was significantly correlated with the scores of the MIS-BPD (r = .629, p < .01) and PDQ-4 (r = .664, p < .01). It was also found that the estimated PPBPD of the CDA-BPD was significantly correlated with the scores of the MIS-BPD (r = .613, p < .01) and PDQ-4 (r = .637, p < .01).
To further examine the CDA-BPD validity, cross-validation was examined using a validation sample that consisted of a healthy control group (N 1 = 34) and a BPD group (N 2 = 34). Figure 1 reveals the error bar of the test scores and the PPBPD for the two groups. In comparison with the healthy group, the BPD group had a higher mean score and mean PPBPD on the CDA-BPD. Specifically, the healthy group had a mean CDA-BPD score of 15.76 (SD = 9.595) and a mean PPBPD of 0.184 (SD = 0.355), while the BPD group had a mean score of 45.12 (SD = 7.231) and a mean PPBPD of 0.985 (SD = 0.084). In addition, paired-sample t tests were conducted to determine the significance of paired-group differences in mean score and PPBPD of the CDA-BPD. The paired-sample t-test statistic of the mean CDA-BPD score of the two groups was −14.246 (df = 33, p < .001, and Cohen’s d = 3.330) and the t-test statistic of the mean PPBPD of the two groups was −12.854 (df = 33, p < .001 and Cohen’s d = 3.083). To sum up, there were different CDA-BPD scores and PPBPD between the two groups, and the distributions were also reasonably symmetric within the two groups. These results indicate that the CDA-BPD could effectively separate the healthy group from the BPD group.
Error bar of the CDA-BPD test scores and PPBPD for validation sample. Note: 95% CI = 95% confidence interval. PPBPD = posterior probability of borderline personality disorder, which was measured based on the CDA-BPD and the diagnostic criteria in the DSM-5 via CDMs.
Moreover, the content validity was also investigated in this article. Just like the BPQ scale (Poreh et al., 2006), the CDA-BPD also contained two underlying factors: identity/interpersonal and impulsivity. In the CDA-BPD, there were 38 items to measure the identity/interpersonal trait and 17 items to measure impulsivity trait. Furthermore, the identity/interpersonal factor assessed abandonment (S1, included 4 items), relationships (S2, included 6 items), self-image (S3, included 6 items), affective instability (S6, included 8 items), emptiness (S7, included 10 items) and quasi-psychotic states (S9, included 4 items). The impulsivity factor assessed impulsivity (S4, included 4 items), suicide (S5, included 6 items), and intense anger (S8, included 7 items). Beyond that, the CFA results of the CDA-BPD (see section of structural parameter results) also showed that CDA-BPD covered all the domains that were suggested by the BPQ (Poreh et al., 2006).
Sensitivity and specificity
Based on the validation sample, diagnostic accuracy of the CDA-BPD was assessed by the nonparametric measure of area under a ROC curve. Results showed that the area under the ROC curve (AUC) was 0.956 (95% CI [0.901, 0.989]), and the CDA-BPD had high sensitivity of 0.985 and high specificity of 0.853 for identifying the diagnostic accuracy of the CDA-BPD. These results indicate that the CDA-BPD had acceptable power to distinguish healthy individuals and BPD individuals.
Diagnostic score reporting
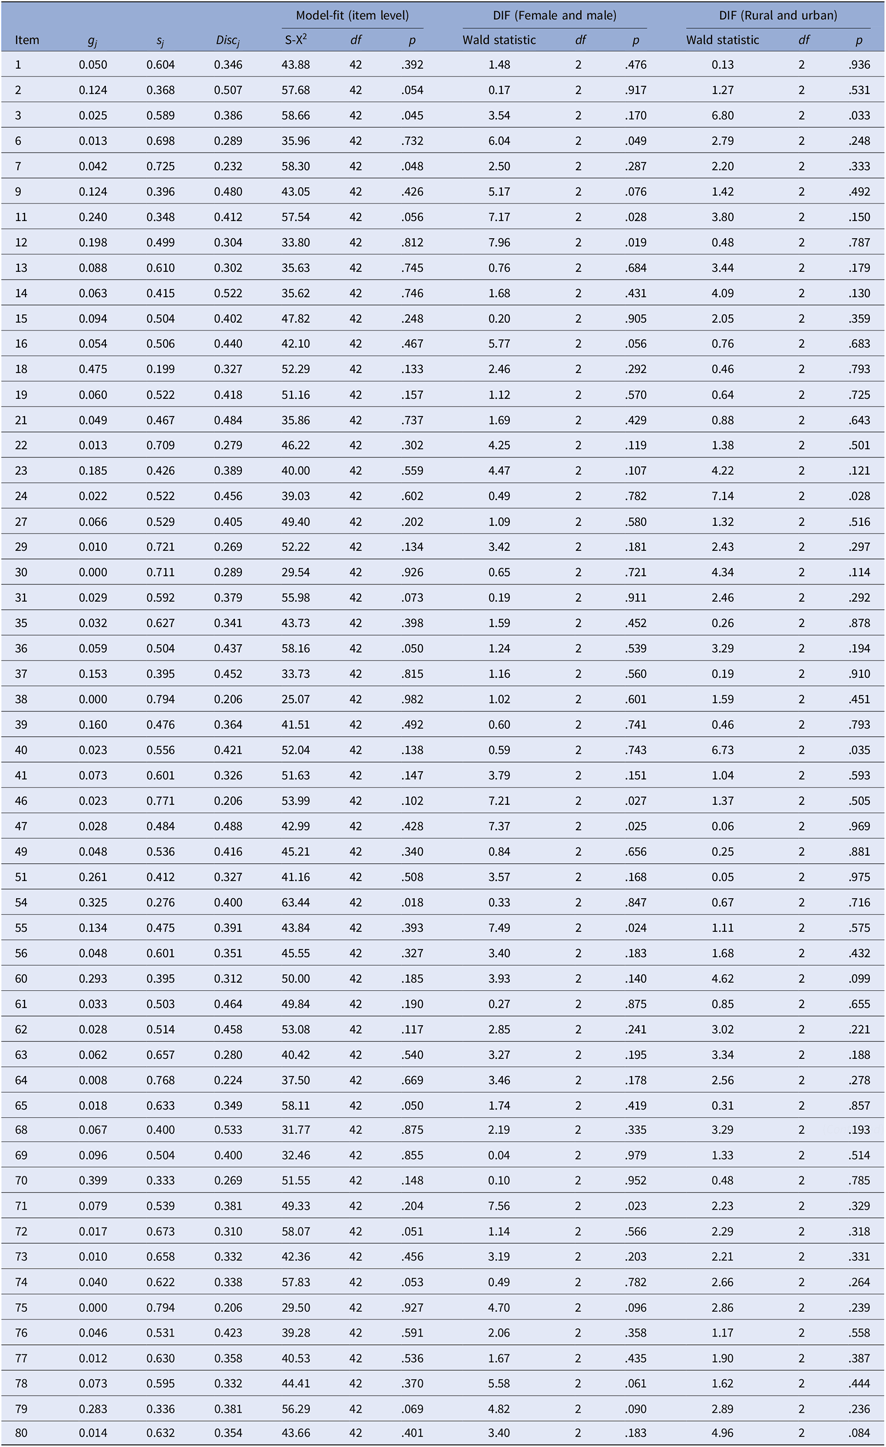
Table 3 and Figure 2 provide details of the three individuals’ nine symptom criteria information based on the DSM-5 and their PPBPD reports, which is an example to illustrate the unique information provided by the CDM. Although these individuals had the same total score in the MIS-BPD and BPQ, and they were all defined as BPD by the MIS-BPD and the BPQ, their posterior probability of meeting each symptom criterion varied considerably (see Table 3) as a result of individual differences. Based on these probabilities, the PPBPD for each individual could be estimated.
Symptom spectrum of borderline personality disorder for three individuals. Note: S1–S9 represent nine symptom criteria for BPD in the DSM-5 shown in Table 1.
Individual example estimates
Note: S1–S9 represent nine symptom criteria for BPD defined in the DSM-5 in Table 1; PPBPD = the posterior probability of borderline personality disorder, which was measured based on the CDA-BPD and the diagnostic criteria in the DSM-5 via CDMs.
More specifically, individuals A, B and C were all diagnosed as BPD by the CDA-BPD with the PPBPD of 0.987, 0.991, and 1.00 respectively, which was consistent with the diagnosis of the MIS-BPD and BPQ, but with variance in their symptom profiles. As seen in Table 3 and Figure 2, Individual A (female, 20 years old and from the country) had a probability of over .5 on symptoms 1, 2, 3, 6, 7, 9 but not on symptoms 4, 5 and 8; Individual B (male, 21 years old and from the country) had a probability of over .5 on symptoms 1, 2, 4, 5, 6, 8, 9 but not on symptoms 3 and 7; and Individual C (female, 19 years old and from the city) had a probability of over 0.5 for all the symptoms. This detailed information may be useful for individual-specific diagnostic and interventional treatment.
Structural parameter results
The structure of the CDA-BPD was confirmed: χ2 was 83.01 with df = 26, p < .0001, χ2/df = 3.19, NFI = 0.93, NNFI = 0.95, CFI = 0.97, GFI = 0.98, ACFI = 0.97, and RMSEA = 0.045. According to these results, all goodness-of-fit indicators were in the range of acceptability. Figure 3 displays the results of the structural model estimation of the CDA-BPD. In Figure 3, the correlation between two latent continuous factors was high at .940, which suggested that the presence or absence of one component would have a significant impact on the existence or absence of the other. The nine symptom criteria had high factor loadings with values typically above 0.60 (p < .01). These results indicated that the nine latent criteria of BPD were highly correlated with the two factors, which provided more information for the etiology and was valuable for the diagnosis of BPD.
CDA-BPD analysis structural model estimates.
Additionally, Figure 3 displays the results of the cut-point parameters estimation. These cut-point parameters offered some insights into the percentages of individuals meeting each DSM-5 criterion in the present sample. To be specific, an estimated 38.9% of respondents satisfied symptom 7 (“Chronic feelings of emptiness”). Furthermore, an estimated 37.6% of respondents met symptom 3 (“Identity disturbance: markedly and persistently unstable self-image or sense of self”). These results suggest that individuals in the current sample who probably had BPD often felt chronic emptiness and had an unstable self-image. The structure results analyzed in the study provided a way to research the pathological diagnosis and etiological manifestation. The combination of marginal criteria information from the cut-point parameters and pairwise criteria association information from the factor loadings made the two-factor structural model an informative addition to the measurement component of the CDM.
Discussion
The present study reported on the process of retrofitting the traditional borderline personality disorder questionnaire and initial validation of the CDA-BPD. The CDA-BPD was improved under the CDM framework based on the DSM-5, and the results of this study suggested that the CDA-BPD was a reliable self-report instrument to evaluate BPD. In particular, the retrofitting process of the CDA-BPD showed an innovative statistical and psychometric approach ready to provide effective formative information at a more fine-grained level than currently offered by the ubiquitous unidimensional instrument.
Compared with the previous researches on BPD assessments, this study had some major implications, which are listed as follows.
Why was the CDA-BPD better than traditional BPD assessments? First, although all the items of the CDA-BPD were directly based on the traditional BPQ questionnaire (Poreh et al., 2006), the 55 items that consisted of the final CDA-BPD were carefully selected according to the statistical indicators of a CDM. In the present study, most items of the CDA-BPD had a strong power to discriminate individuals who present the attributes on an item and are absent the attributes. The S-X2 statistic of all remaining 55 items were acceptable and indicated a good fit between the estimated G-DINA model and the observed data on item level. The CDA-BPD deleted the items with DIF under the CDM framework so as to remove any bias in the current assessment. Besides, analysis results also showed that the CDA-BPD not only had good reliability, convergent validity and content validity, but also had high sensitivity and specificity. These convincing evidences indicate that the CDA-BPD was a high-quality BPD assessment. Second, the retrofitting process of the CDA-BPD was under the CDM framework. The CDM as a combination of psychological assessment and clinical diagnosis can be used not only to evaluate psychometric properties for test and items but also to provide diagnostic information at both the generic level and symptom level of diagnostic information. Based on the above, the CDA-BPD is a high-quality assessment, and compared with the traditional BPD scale, it can also provide detailed cognitive diagnostic information. So, the CDA-BPD can be regarded as an improved assessment tool.
What is the difference between the proposed method of CDM and latent class analysis for the same purposes? Latent class analysis is a statistical method used to identify a set of discrete, mutually exclusive latent classes of individuals based on their responses to a set of observed categorical variables. It can classify individuals from a heterogeneous population into smaller, relatively homogenous unobserved subgroups. CDMs are special cases of latent class models but with some differences between them. On the one hand, unlike unrestricted latent class models, CDMs apply a hypothesized set of constraints to measure a set of preconceived dichotomous latent variables or dichotomous attributes. These constraints specify the attributes required to positively respond to each item, and in CDMs are reflected in the Q-matrix. Due to such constraints (Q-matrix), the general response characteristics of each individual are known in CDMs. On the other hand, latent class analysis is regarded as the baseline model for a hypothesis model; that is, latent class analysis assumes that there is complete independence between observed variables, then increases the number of potential classes gradually from baseline model and selects the appropriate number of classes (normally, the number of classifications would not be so large) and maximizes the model fit. But in CDMs, the number of classes are fixed and the meaning of class membership for the analysis is also defined when the number of attributes is known (e.g. if there are K attributes, the sample can be divided into 2 K ). Future studies may apply unrestricted latent class models to investigate BPD and to compare with the CDM results in the CDA-BPD.
Could the proposed method of retrofitting a traditional BPD scale under the CDM be applied to interval scale variables? As mentioned above, CDMs were latent variable models developed primarily to describe the relationship between observable data (typically in the form of questionnaire responses) and a set of categorical latent variables (typically dichotomous or binary-valued [0/1]). It should be pointed out that the initial observation data and Q matrix of the CDA-BPD were both dichotomous in the present study. But, if researchers want to apply CDMs to investigate interval scale variables, there are still some viable solutions. As the items of the instrument are in the form of a Likert-type scale, researchers could follow Templin and Henson (2006), who converted the partial-credit items to dichotomous items by considering full credit as success (recorded as 1), and the remaining scores as failure (recorded as 0). Another way is that the score of zero does not change but a score of more than zero is converted to 1 (Y.S. Lee, Park, & Taylan, 2011). Note that using the seq-GDINA model (Ma & de la Torre, 2016) directly is an acceptable way to deal with Likert-type scale data. As the attribute of the Q-matrix was polytomous, more detailed information could also be referred to in Chen and de la Torre (2013).
Accordingly, the main contributions of this study were that: (1) For the first time, a traditional BPD questionnaire was retrofitted for diagnostic purposes under the CDM framework. The process of retrofitting in this article could serve as an important step in advancing BPD assessment research when it has been too difficult to develop a cognitive diagnostic BPD instrument due to practical constraints and as researchers want to obtain more accurate and rich information for diagnosis. In terms of the new psychometric method used in this article, the CDM is an effective statistical method for use in psychological research. It may be able to enhance research into other personality disorders, in which the dichotomous attribute nature of the CDM can help researchers understand the detailed components of personality traits. (2) As an improved BPD assessment in this study, the CDA-BPD could provide both general diagnostic information (e.g. BPD vs. non-BPD) and detailed information about how each individual meets the definition for diagnosis. The criterion-level information gives insight into tailoring individual-specific treatments for BPD, potentially increasing these treatments’ effectiveness. (3) In the study, we investigated the structure of underlying personality factors in BPD to provide diagnostic information for each criterion. Using the factor structure estimation from a CDM, we were able to provide avenues to research the evaluation and etiological manifestations of BPD.
Although the results were promising, there are also several limitations to acknowledge. First, the participants in this study were college students who were from a narrow population distribution. The etiology of BPD may be different for young adults. Second, in the validation sample, the BPD group was recruited from students who were defined as BPD by the MIS-BPD and PDQ-4-BPD; however, it is more reasonable that the BPD group should be strictly regarded clinically as having BPD. Third, the CDM used in this study was more intricate than other methods, and it needed to estimate many parameters. Any interested reader could refer to Ma, Iaconangelo, and de la Torre (2016) or Sorrel, Abad, Olea, de la Torre, and Barrada, (2017) to learn how to overcome the limitations. Finally, while retrofitting under the CDM framework showed a feasible method to gain more effective information from existing BPD assessments, researchers should be careful about using this method if the instruments do not specify a correct Q-matrix.
Conclusion
This article introduced the process of retrofitting the BPD assessment under the CDM framework, and the results provided sufficient evidence for the CDA-BPD as an improved BPD assessment. The CDA-BPD may also be a valuable tool to provide rich diagnosis information that the traditional BPD assessment could not. With this assessment, the researchers could estimate each individual’s symptom profile and the PPBPD according to the DSM-5. This rich diagnostic information could potentially increase clinical treatments’ effectiveness.
Footnotes
Financial Support
This study was funded by National Natural Science Foundation of China (31660278, 31760288).
Appendix A
The initial Q-matrix of the BPQ scale
Note: S1–S9 represented nine symptom criteria for borderline personality disorder defined in DSM-5. Items marked with an asterisk (#) were retained in the final 55-items of the CDA-BPD.
Item
Q-matrix
S1
S2
S3
S4
S5
S6
S7
S8
S9
1#
0
0
0
1
0
0
0
0
0
2#
0
0
0
0
0
1
0
0
0
3#
1
0
0
0
0
0
0
0
0
4
0
1
0
0
0
0
0
0
0
5
0
0
1
0
0
0
0
0
0
6#
0
0
0
0
1
0
0
0
0
7#
0
0
0
0
0
0
1
0
0
8
0
0
0
0
0
0
0
1
0
9#
0
0
0
0
0
0
0
0
1
10
0
0
0
1
0
0
0
0
0
11#
0
0
0
0
0
1
0
0
0
12#
1
0
0
0
0
0
0
0
0
13#
0
1
0
0
0
0
0
0
0
14#
0
0
1
0
0
0
0
0
0
15#
0
0
0
0
1
0
0
0
0
16#
0
0
0
0
0
0
1
0
0
17
0
0
0
0
0
0
0
1
0
18#
0
0
0
0
0
0
0
0
1
19#
0
0
0
0
0
1
0
0
0
20
1
0
0
0
0
0
0
0
0
21#
0
1
0
0
0
0
0
0
0
22#
0
0
0
0
1
0
0
0
0
23#
0
0
0
0
0
0
1
0
0
24#
0
0
0
0
0
0
0
1
0
25
0
0
0
0
0
0
0
0
1
26
0
0
0
1
0
0
0
0
0
27#
0
0
0
0
0
1
0
0
0
28
1
0
0
0
0
0
0
0
0
29#
0
1
0
0
0
0
0
0
0
30#
0
0
0
0
1
0
0
0
0
31#
0
0
0
0
0
0
1
0
0
32
0
0
0
0
0
0
0
1
0
33
0
0
0
0
0
0
0
0
1
34
0
0
0
1
0
0
0
0
0
35#
0
0
0
0
0
1
0
0
0
36#
0
1
0
0
0
0
0
0
0
37#
0
0
1
0
0
0
0
0
0
38#
0
0
0
0
1
0
0
0
0
39#
0
0
0
0
0
0
1
0
0
40#
0
0
0
0
0
0
0
1
0
41#
0
0
0
0
0
0
0
0
1
42
0
0
0
1
0
0
0
0
0
43
0
0
0
0
0
1
0
0
0
44
1
0
0
0
0
0
0
0
0
45
0
1
0
0
0
0
0
0
0
46#
0
0
1
0
0
0
0
0
0
47#
0
0
0
0
0
0
0
1
0
48
0
0
0
0
0
0
0
0
1
49#
0
0
0
0
0
1
0
0
0
50
1
0
0
0
0
0
0
0
0
51#
0
1
0
0
0
0
0
0
0
52
0
0
1
0
0
0
0
0
0
53
0
0
0
0
1
0
0
0
0
54#
0
0
0
0
0
0
1
0
0
55#
0
0
0
0
0
0
0
1
0
56#
0
0
0
0
0
0
0
0
1
57
0
0
0
1
0
0
0
0
0
58
0
0
0
0
0
1
0
0
0
59
1
0
0
0
0
0
0
0
0
60#
0
1
0
0
0
0
0
0
0
61#
0
0
1
0
0
0
0
0
0
62#
0
0
0
0
0
0
1
0
0
63#
0
0
0
0
0
0
0
1
0
64#
0
0
0
1
0
0
0
0
0
65#
0
0
0
0
0
1
0
0
0
66
1
0
0
0
0
0
0
0
0
67
0
0
1
0
0
0
0
0
0
68#
0
0
0
1
0
0
0
0
0
69#
0
0
0
0
0
0
1
0
0
70#
0
0
1
0
0
0
0
0
0
71#
0
0
0
1
0
0
0
0
0
72#
0
0
0
0
0
1
0
0
0
73#
1
0
0
0
0
0
0
0
0
74#
0
0
1
0
0
0
0
0
0
75#
0
0
0
0
1
0
0
0
0
76#
0
0
0
0
0
0
1
0
0
77#
0
0
0
0
0
0
0
1
0
78#
1
0
0
0
0
0
0
0
0
79#
0
0
0
0
0
0
1
0
0
80#
0
0
0
0
0
0
0
1
0
Appendix B
Note that items marked with an asterisk (*) are reverse scored.