
Abstract
This study applied a bifactor approach to investigate the structures and simultaneously compare the psychometric properties of three popular self-report internet addiction (IA) instruments. A bifactor confirmatory factor analysis was used to address the structures of the three scales, while the bifactor multidimensional item response model was employed to compare the psychometric properties of the three scales. Results of bifactor confirmatory factor analysis (CFA) showed that the bifactor structures were suitable for the three scales. These corresponding bifactor structures were used in the subsequent bifactor multidimensional item response theory (MIRT) analysis. Results of the bifactor MIRT showed that: three instruments of IA performed well as a whole; the Generalised Problematic Internet Use Scale (GPIUS) and Internet Addiction Test (IAT) provided more test information and had less standard error of measurement, which ranged from −3 to −1 standard deviations of theta or IA severity; the Game Addiction Scale (GAS) performed better than the other two scales in that it can provide more test information in the large area of IA severity (from −1 to +3 SDs). These suggest that the GPIUS and IAT may be the best choice for epidemiological IA studies and for measuring those with lower IA severity. Meanwhile, the GAS may be a good choice when we recruit those with various levels of IA severity.
More recently, as the fast and pervasive transformation of the internet has offered an interactive social platform for many people, the issue of internet addiction (IA) has evolved, together with the rapid development and spread of the internet (Servidio, 2017). IA is a common psychological disorder in the 5th edition of the Diagnostic and Statistical Manual of Mental Disorders (DSM-5; American Psychiatric Association, 2013). Neglect of academic, job and domestic responsibilities, disruption of social relationships, and financial problems have all been considered as consequences of IA (Morahan-Martin, 2008; Pawlikowski, Altstötter-Gleich, & Brand, 2013; Widyanto, Griffiths, Brunsden, & McMurran, 2008). Furthermore, results obtained from different screening approaches (e.g., self-rating questionnaires, neurological analysis, clinical interviews) indicate that adolescents — specifically, college students — are most at risk for developing IA (Hsu, Lin, Chang, Tseng, & Chiu, 2015; Li et al., 2016). From the perspective of social psychology, college students are particularly vulnerable to IA risks since they report higher levels of computer ownership, daily internet access, and absence of self-control (Jelenchick, Becker, & Moreno, 2012; Lu & Yeo, 2015). Accordingly, it is extremely critical to have an accurate assessment and diagnosis of those with IA and provide timely treatment.
Over time, a considerable number of self-rating instruments have been developed to diagnose IA, including the widely used Internet Addiction Test (IAT; Young, 1998, 1999), the Generalised Problematic Internet Use Scale (GPIUS; Caplan, 2002), the Online Cognition Scale (OCS; Davis, Flett, & Besser, 2002), and the Game Addiction Scale (GAS; Lemmens, Valkenburg, & Peter, 2008). In the past, psychological constructs of most self-rating instruments have been assessed by employing classical test theory (CTT), which focuses on test–retest reliability, internal consistency, and construct validity (Hunsley & Mash, 2007, 2008). Moreover, CTT methods classify individuals as IA mainly based on the total score or transformed total score, which does not offer respondents more information about their IA severity (Tu, Gao, Wang, & Cai, 2017). Knowledge about the range of severity evaluated by an instrument is critically important for tailoring measurements to solve specific questions and to solve them in specific settings (Embretson & Reise, 2000; Olino et al., 2012). This goal is likely to be achieved through the application of approaches from item response theory (IRT).
IRT methods are the basis of modern psychometric techniques, which can offer estimations about the latent trait (e.g., IA severity) and item characteristics, such as item discrimination parameters and difficulty parameters. Parameter estimation in IRT models can be integrated to generate item- and test-information functions that precisely evaluate the regions of the latent trait continuum (Olino et al., 2012). In IRT, item- and test-information functions are assessed on the same latent trait instrument (standardised to have a mean of zero and a SD of 1) to generate information that is comparable across inventories (Reise & Henson, 2003). Therefore, results of IRT analyses can be employed to simultaneously compare multiple instruments on a single and common metric.
There has been an increasing number of studies on the exploration of psychometric properties and structures of IA instruments (Caplan, 2002; Fernández-villa et al., 2015; Jelenchick, Becker, & Moreno, 2012; Karim & Nigar, 2014; Khazaal et al., 2008; Korkeila, Kaarlas, Jääskeläinen, Vahlberg, & Taiminen, 2010; Lee et al., 2013; Lemmens et al., 2008; Mak et al., 2014; Panayides & Walker; 2012; Pawlikowski et al., 2013; Sahin, 2014; Tsimtsiou et al., 2014; Widyanto & McMurran, 2004). However, there are still some issues that need to be further addressed, as follows. First, regarding factor structure, investigations of structures of IA instruments suggest that the factor structures of IA scales are not always clear and, in most cases, may be multidimensional (Caplan, 2002; Korkeila et al., 2010; Lee et al., 2013; Lemmens et al., 2008; Tsimtsiou et al., 2014; Widyanto & McMurran, 2004). These can not only make IA instruments less effective and less reliable in evaluating the risk of problematic internet use, but it can also be difficult to score and interpret the results of IA instruments. Second, methodologically, the exploration of the psychometric properties of IA instruments has been conducted under the framework of CTT methods or unidimensional IRT (UIRT) methods (Fernández-villa et al., 2015; Jelenchick et al., 2012; Karim & Nigar, 2014; Khazaal et al., 2008; Lee et al., 2013; Mak et al., 2014; Pawlikowski et al., 2013; Sahin, 2014). However, CTT methods cannot offer specific information on the severity of IA symptomatology with respect to different ability levels. In addition, unidimensionality is an important assumption in IRT, and it is difficult to be satisfied for IA scales. If the unidimensional model is applied to estimate the item parameters of multidimensional instruments, it is likely to yield inaccuracy in parameters estimation. Third, although plenty of instruments are available, the agreement between them is less than optimal and no scale can be considered as a gold standard (Caplan, 2002; Fernández-villa et al., 2015; Jelenchick et al., 2012; Karim & Nigar, 2014; Khazaal et al., 2008; Lee et al., 2013; Lemmens et al., 2008; Panayides & Walker; 2012; Widyanto & McMurran, 2004). Therefore, it may be difficult for researchers and clinicians to choose an optimal instrument when assessing for IA. To address this gap, new approaches to analyzing multidimensional structure scales are essential and should be applied to reanalyze the IA scales.
This study sought to address the aforementioned issues by (1) investigating the structures and (2) simultaneously comparing the psychometric properties of several widely used IA scales under the framework of a multidimensional structure approach. To fairly compare the psychometric properties for the three scales, the IA scales used here include the IAT, GPIUS, and GAS. The reasons why these were chosen for this study are as follows: (1) The three instruments are widely used in several fields of psychological research. In recent decades, the IAT has been applied to social psychology (Dowling & Brown, 2010) and clinical diagnosis (Tu et al., 2017). The GPIUS is commonly used in some aspects of psychological health (Bermas, Ghaziyani, & Ebad Asgari, 2013). Meanwhile, the GAS had attracted widespread attention in counseling, educational and clinical domains (Haghbin, Shaterian, Hosseinzadeh, & Griffiths, 2013). (2) Some critical evidence has indicated that the three scales have high reliability and validity. For example, Jelenchick et al. (2012) pointed out that each subscale of the IAT had a good Cronbach’s alpha (α1 = .83; α2 = .91) and high scale construct validity. Caplan (2002) found each subscale of the GPIUS had good internal consistency (range between 0.78 and 0.85) and high scale construct validity. Lemmens et al. (2008) suggested the GAS had good Cronbach’s reliability (α > .90) and high concurrent validity. (3) The same scoring methods ensured that psychometric properties of three IA instruments could be compared fairly (5-point Likert scales each; Caplan, 2002; Lemmens et al., 2008; Young, 1998). This study is expected to provide suggestions for selecting and applying the most optimal and precise measures for researchers with different study purposes (Umegaki & Todo, 2017). For instance, the scale may be designed to be used in studies of epidemiology where it can provide the most information at the lower IA severity level; or it may be useful for assessing changes in IA severity in treatment studies where it can more precisely measure the mean of IA severity. It may also be designed to obtain information about a clinical diagnosis for the best assessment at the higher IA severity level. Furthermore, a multidimensional approach — the bifactor multidimensional item response theory (MIRT) model — was first used here to analyze and compare three widely used IA scales, which is expected to derive more appropriate parameters estimation of items and individuals than unidimensional approaches. This article might play a significant role in the selection, development and revision of IA measures.
Factor Structures
To date, many factor-analytic studies have been performed with the original IA measures, and the majority of IA instruments have been demonstrated to be a multidimensional construct. All previous assessments of psychometric properties for IA instruments have demonstrated a common, consistent result regarding the various number of the factor solutions, which have ranged from one (Hawi, 2013; Khazaal et al., 2008) to as complex as seven factors (Caplan, 2002). Furthermore, when similar numbers of factors were extracted, diversities were observed in the items distribution on the factors (Jelenchick et al., 2012; Khazaal et al., 2016; Watters, Keefer, Kloosterman, Summerfeldt, & Parker, 2013). Table 1 provides a summary of these findings.
Previous factor analysis studies of the IAT, GPIUS, and GAS

We posit several potential reasons for such diverse factor structures of IA scales, which include mainly theoretical, socio-cultural and methodological reasons. First, the structure itself has not been uniformly defined across the varied studies. Achieving a consensus definition is an important step before its actual factor structure can be detected, in that the definition would determine the domain of the construct and the item pool (Tobacyk, 1995). Furthermore, socio-cultural background, inasmuch as it might reflect different improvements in their use of new technologies and the subjects’ lifestyles, can not only influence the translation procedures but can also affect the factor structure. All these aspects make it complicated to investigate the nature and prevalence of IA (Hawi, Blachnio, & Przepiorka, 2015; Servidio, 2014; Teo & Kam, 2014). As for methodological issues, one that could be considered is the sample size affecting factorial solutions. In the existing studies’ samples, between n = 86 (Widyanto & McMurran, 2004) to n = 1825 (Korkeila et al., 2010) have been employed. In addition, the factorial complexity of IA can be attributed to the various item-reduction techniques when performing exploratory factor analyses (EFA), which could affect the number of factors extracted. For instance, studies using the maximum likelihood (ML) method (Khazaal et al., 2008; Korkeila et al., 2010) yielded fewer factors than studies employing the principal components (PC) procedure (Chang & Law, 2008; Ferraro, Caci, D’Amico, & Di, 2006; Widyanto & McMurran, 2004; Widyanto, Griffiths, & Brunsden, 2011). Consensus on an optimal structure for IA instruments is extremely important for IA studies (Jia & Jia, 2009), and achieving a consensus definition is an important step before its real factor structure can be determined. Though there have been several attempts at theory building (e.g., Davis, 2001), there is also a lack of frequently adopted construct definition or theoretical view. Moreover, because validation of the factor structure of an instrument is a process driven by theory as well as empirical data, rigorous methodological approaches will inform our effort toward a consensus view of IA.
More specifically, the complexity of IA factor structures may have several shortcomings. On the one hand, IA instruments that lack the best-fit factorial structure could make it less effective and less reliable in evaluating the risk of problematic internet use. On the other hand, the factor structure of the IA scales varies from study to study and from culture to culture, and even within the same culture; hence, it requires an instrument validation in any new culture. Moreover, the diversity of factor structure of the IA scales may cause the same item loading on the different dimensions in different populations, which results in different suggestions regarding how to best score and interpret IA instrument results.
Because the findings of previous factor-analytic studies have been highly inconsistent, the current study applied the traditional (simple-structure) as well as novel (bifactor) modelling approaches to obtain the optimal measurement structure of the IA instruments for college students. Using a novel approach, we hope not only to resolve the inconsistencies in prior factor-analytic results but also to help inform researchers and clinicians in their selection of measures when assessing for IA.
Bifactor Model and Bifactor MIRT Model
Bifactor Model
The bifactor model (Holzinger & Swineford, 1937) refers to a general-specific model. The idea first began with Spearman’s (1928) two-factor pattern, where abilities were divided into general abilities and specific abilities according to the degree of intellectual performance. The early bifactor model was only applied in the field of intelligence research (Spearman, 1928), but recently much attention has been directed to the fields of personality psychology, management psychology, and health psychology (Howard, Gagné, Morin, & Forest, 2018; Musek, 2007; Reise, Morizot, & Hays, 2007). A bifactor measurement model allows all items to load onto a common general dimension of psychopathology in addition to any specific symptom domains or “group” factors (Holzinger & Swineford, 1937). The loading pattern and factor structure of the bifactor model, consisting of nine items and three specific factors, is shown as an example in Figure 1.
A bifactor model with three specific factors.
Common method variance (CMV) is a possibly serious biasing threat in behavioral research, particularly with single informant surveys. According to Podsakoff, Mackenzie, Lee, and Podsakoff (2003), method bias could be controlled via both procedural and statistical remedies. We solved procedural remedies by protecting respondent anonymity, improving item wording, and reducing evaluation apprehension. We also employed the following statistical remedies.
First, we performed Harman’s one-factor test to check for common method variance. Evidence for common method bias presents when a single factor emerges from the exploratory factor analysis or when one general factor accounts for the majority of the covariance among the instruments (Podsakoff & Organ, 1986). Results indicated that four factors in the unrotated factor structure with eigenvalues higher than 1.0 were extracted for the IAT; meanwhile, the first factor only accounting for 32.7% of the total variance explained (total variance explained = 61.4%). Six factors in the unrotated factor structure with eigenvalues higher than 1.0 were extracted for the GPIUS; meanwhile, the first factor only accounted for 32.4% of the total variance explained (total variance explained = 62.0%). Four factors in the unrotated factor structure with eigenvalues higher than 1.0 were extracted for the GAS; meanwhile, the first factor only accounted for 38.3% of the total variance explained (total variance explained = 67.0%). The total variance explained for the first factor of the three scales is less than the cut-off value of 40% (Zhou & Long, 2004). These suggest that the current study does not appear to be influenced by common method bias.
Furthermore, when considering the importance of a general factor accounting for item
variance, one suggested method is to test the proportion of variance in the
instrument scores accounted for by the general factor. This method was applied to
estimate ω
h
(Zinbarg, Revelle, Yovel, & Li, 2005). The value of ω
h
varies between 0 and 1, and the larger ω
h
is, the more strongly instrument scores are affected by a general factor
common to all the indicators. In addition, we calculated the proportion of explained
common variance (ECV) that was attributable to the general factor and to specific
factors (Bentler, 2009; Reise,
Moore, & Haviland, 2010).
The cut-off value of ECV for the general factor in a bifactor model is generally
considered to be 60% (Reise, Scheines, Widaman, & Haviland, 2013). Results showed that the ECVs of the general
factor for the IAT, GPIUS, GAS were 63.4%, 61.3%, and 70.1% respectively; the ω
h
s of the general factor for the IAT, GPIUS, GAS were 82.2%, 82.7%, and 91.1%
respectively. This means that the general IA factor of the bifactor model for the
three instruments accounted for 61.3–70.1% of the common variance of all items. In
addition, 82.2–91.1% of the variance of this summed score is attributable to the
general factor. Therefore, with respect to the two-specific-factor bifactor structure
of IAT and the seven-specific-factor bifactor structure of GPIUS and GAS, common
variation of all items was mainly derived from the general factor and not from the
common method for both. The formula ω
h
and ECV are expressed as: 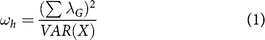


Bifactor MIRT Model
The bifactor MIRT model with the graded response model (Gibbons et al., 2007) is a normal ogive model. To
simplify the formula and easily understand it, we introduced and applied the logistic
version of the bifactor MIRT model based on the multidimensional graded response
model (MGRM; Muraki & Carlson, 1995) in this study, which is expressed as: 


Although the bifactor MIRT model is a specific case of multidimensional IRT models, it possesses some crucial strengths: (1) it can reveal the presence of a general factor/ability, not just the domain-specific factors (Patrick, Hicks, Nichol, & Krueger, 2007); (2) traditional MIRT models are usually limited to five dimensions while the bifactor model permits more dimensions; (3) importantly, a bifactor MIRT model is able to complement traditional dimensionality investigation by helping to resolve dimensionality issues.
Relations Between the Bifactor Model and the Bifactor MIRT Model
A bifactor model involves one general factor that accounts for shared variability between all items and several specific factors. The specific factors then account for any remaining systematic covariation among the items (Chen, West, & Sousa, 2006; Gomez & McLaren, 2015; Watters et al., 2013). In the bifactor model, the general and specific factors are uncorrelated, generating mutually orthogonal factors that account for unique shared variability among symptoms (Gibbons & Hedeker, 1992). In addition, the bifactor MIRT model is a special case of MIRT models (Cai, Yang, & Hansen, 2011). In the current study, this model is the bifactor counterpart of the logistic version of Muraki and Carlson’s (1995) MGRM and is mainly applied to multidimensional graded response data. The differences between a bifactor model and a bifactor MIRT model are as follows. On the one hand, thus far, all evaluations of a bifactor model have been conducted in the factor analytic framework using limited-information estimation methods, and all evaluations rely on a complete pairwise correlation matrix (Forero, Maydeu-Olivares, & Gallardo-Pujol, 2009; Sturm, McCracken, & Cai, 2017). However, many applications of bifactor MIRT are based on marginal maximum likelihood estimation with the expectation maximization algorithm (MML-EM; Bock & Aitkin, 1981) according to the IRT framework. This method often is called a “full-information” item-factor analysis because it employs the entire item response matrix as part of the calibration (Gibbons & Hedeker, 1992; Sturm et al., 2017). On the other hand, the bifactor model can be used to investigate the factor structure of psychological measures based on a number of indices of model fit (with data that demonstrates construct-relevant multidimensionality; Brouwer, Meijer, & Zevalkink, 2013). However, in bifactor MIRT analysis, we can estimate item characteristics such as item-discrimination parameters of a general factor and specific factors and difficulty parameters. Furthermore, using parameters generated from bifactor MIRT analysis, the psychometric properties of symptoms can be closely evaluated (Sturm et al., 2017; Yang et al., 2013).
Methods
Participants
A total of 1,067 participants (aged from 16 to 24, mean = 19.56, SD = 1.10) were recruited from six universities in China (88.0% response rate). The respondents were offered one pen or one notebook as incentives for their participation; of those who completed the questionnaire, 45.6% were males and 54.4% were females. In terms of region, 56.5%, 23.4%, and 20.1% of students were from the countryside, county town, and cities respectively. The current study was conducted in accordance with the recommendations of the ethics committee and the informed consent was gained for all participants.
Measurement Tools
Three IA scales, including the IAT, the GPIUS, and the GAS, were used in this study and were administrated together to the same sample. The IAT (Young, 1998) comprises 20 items, labelled here as question 1 to question 20. Sample questions include: “Do you find that you stay online longer than you intended?” and “Do you fear that life without the internet would be boring, empty, and joyless?” These items were from the Diagnostic and Statistical Manual of Mental Disorders (4th ed.; DSM-IV-TR; American Psychiatric Association, 2000) pathological gambling criteria. According to Yang, Choe, Baity, Lee, and Cho (2005), the IAT had great internal consistency (α = .92) and good test–retest reliability (r = .85). Afterwards, the IAT was revised into Chinese (Chang & Law, 2008) for college student and adult samples. Chang and Law’s (2008) findings indicated that the IAT had strong internal consistency (Cronbach’s α = .93). Moreover, evidence showed the IAT had satisfactory concurrent and convergent validity. In the present study, the Chinese version of the IAT has a Cronbach’s alpha of .89 and a split-half reliability of .81. The IAT is a 5-point, Likert-type scale ranging from 1 (never) to 5 (always). The total score of the test can range from 20 to 100, and a greater value shows a more problematic use of the internet. Young suggests that a score of 20–39 points refers to an average internet user, a score of 40–69 points represents a potentially problematic internet user, and a score of 70–100 points is a problematic internet user.
The second scale is the GPIUS (Caplan, 2002), which is composed of 29 items labelled here as questions 21 to 49. Sample questions include: “Use internet to make myself feel better when I’m down” and “Missed social event because of being online”. The GPIUS is a 5-point Likert-type scale ranging from 1 (strongly disagree) to 5 (strongly agree). It has no addiction classification and scoring criteria. According to Caplan (2002), each subscale of the GPIUS has great internal consistency (ranged between .78 and .85) and high scale construct validity. Li, Wang, and Wang (2008) modified the GPIUS in China and the results demonstrated that the split-half reliability, Cronbach’s alpha and test–retest reliability of the Chinese version of the GPIUS were .87, .91, and .73 respectively. As for validity, the Chinese version of the GPIUS had a significant correlation at .01 levels with the short form of the IAT (Young, 1999). The Chinese version of the GPIUS has a Cronbach’s alpha of .92 and a split-half reliability of .83 in the current study.
The third scale is the GAS (Lemmens et al., 2008), with 21 items labelled here as questions 50 to 70. Sample questions include: “Were you unable to stop once you started playing?” and “Did you feel bad after playing for a long time?” The GAS is a 5-point Likert-type scale ranging from 1 (never) to 5 (very often). At least “3: sometimes” on all 7 items indicates addicted. According to Lemmens et al. (2008), the GAS has good Cronbach’s reliability (α > .90). Meanwhile, the correlations between the GAS and psychosocial variables, such as time spent on games, loneliness, life satisfaction, aggression, and social competence were calculated, and the results showed the GAS had high concurrent validity. In this study, we revised the GAS into Chinese. This Chinese version of the GAS has a Cronbach’s alpha of .94 and a split-half reliability of .87 in the current study.
Statistical Analysis
Some statistical analysis based on bifactor confirmatory factor analysis (CFA) and
bifactor MIRT was carried out to investigate structures and compare psychometric
properties of the IAT, the GPIUS, and the GAS. The bifactor CFA was used to examine
whether original and existing structures of the three scales were suitable for these
scales, and which structure was the most appropriate for each scale. According to the
bifactor CFA, we can choose the most appropriate structure for each scale. Then,
based on the most appropriate structure, its corresponding bifactor MIRT was applied
to estimate item parameters and compare psychometric properties of the three scales
under the framework of the IRT. From this, we should find a good fit structure for
each scale in order to analyze and estimate item parameters with the bifactor MIRT.
In this study, we focused on the comparison of the general factor (i.e., IA) in the
bifactor MIRT model, and ignored specific factors of the three scales. General data
analysis was conducted in SPSS 22 (IBM Corp, 2015). Factor analysis was done in Mplus 7.4
(Muthén & Muthén, 2012),
and MIRT-based analysis was done in flexMIRT (Version 3.51; Cai, 2017) and R (Version 3.4.1;
Four indexes were introduced to evaluate the degree of the goodness of fit for the
CFA and bifactor CFA, which were the root mean square error of approximation (RMSEA),
the standardised root-mean-square residual (SRMR), the comparative fit index (CFI),
and the Tucker-Lewis index (TLI). RMSEA < .05, SRMR < .08, CFI > .95 and TLI
> .95 represent a close fit, and .05 ≤ RMSEA < .08, .08 ≤ SRMR <.10, .9 <
CFI ≤ .95 and .9 < TLI ≤ .95 represent an acceptable fit (Browne & Cudek,
1993; Hu & Bentler,
1999; McDonald & Ho,
2002). The average item
information (AII) and the relative efficiency (RE) were used to compare the
psychometric properties of the three IA scales. Under the IRT framework, the test
information will increase as the number of items increase. Therefore, we calculated
the amount of information per item on average and measured the average item
information (AII). Furthermore, given that the RE considered the number of test
items, the average item information ratio of each two tests was calculated when
drawing the relative efficiency curve. The calculation formulas of AII and RE
(Umegaki & Todo, 2017) are
as follows: 


Results
Descriptive and Correlation Analysis
The descriptive statistics of the three scales and the correlation coefficients among them are listed in Table 2. Table 2 indicates that the minimum and maximum total scores of the IAT, the GPIUS, and the GAS were 20 and 100, 30 and 143, and 21 and 101 respectively. Their means (SDs) were 47.21 (10.68), 71.57 (17.52) and 42.63 (14.18) respectively. The correlation coefficients betwn them ranged from 0.55 (p < .01) to 0.72 (p < .01).
Descriptive statistics and correlation coefficients of total scores of the IAT, GPIUS, and GAS (N = 1,067)
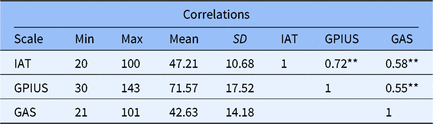
Note: IAT = the Internet Addiction Test; GPIUS = Generalised Problematic Internet Use Scale; GAS = Game Addiction Scale. **p < .01
Confirmatory Factor Analysis
In this section, a CFA was employed to validate whether existing structures of the three scales suggested by previous studies were appropriate for the Chinese university sample.
Guided by a systematic review of original structures of the three scales, we selected one or more representative competing models for each scale. A series of existing models identified in the prior studies were tested by the CFA. As shown in Table 3, with respect to the IAT, in addition to the single-factor solution of 20 original items (Model A), multiple models identified in the previous studies were assessed. Model B involves two factors (salient use, loss of control) of 20 original items, model C contains two dimensions (emotional investment, time management and performance) of 19 items (without item 7). In addition, we made a small modification to model C in which we covaried items 6 and 8, given their possible semantic similarity, and this enabled model D. Model E also includes two factors (dependent use, excessive use) from the 20 original items. Model F contains three factors (withdrawal and social problems, time management and performance, and reality substitute) of 18 items (without items 7 and 11), model G consists of three factors (emotional/psychological conflict, time management issues, and mood modification) with 20 original items; meanwhile, model H involves three factors (psychological/emotional conflict, time management, and neglect work) with 20 original items. Model I contains four factors (neglect of duty, online dependence, virtual fantasies, privacy and self-defence) with 18 items (without items 7 and 16), and model J covers four factors (excessive use, dependence, withdrawal, and avoidance of reality) of 20 original items. Model K contains six factors (salience, excess use, neglect work, anticipation, self-control, and neglect social life) of 20 items. Regarding the GPIUS, model L involves seven factors (mood alteration, social benefit, negative outcomes, compulsivity, excessive time, withdrawal, and interpersonal control) with 29 items. Model M is a six-factor solution (excessive use, network desire, social cognition, functional impairment, mood alteration, and network sociality) with 27 items. With respect to the GAS, model N includes seven factors (salience, tolerance, mood modification, relapse, withdrawal, conflict, and problems), with 21 items.
CFA model fit for the suggested structures of three scales (N = 1,067)

Table 3 indicates that the GPIUS and the GAS both had an acceptable fit according to RMSEA, SRMR, CFI, and TLI indexes. However, all the suggested structures of the IAT were not suitable for the Chinese university sample in that the CFI and TLI were both less than 0.9.
Bifactor Confirmatory Factor Analysis
The results of the CFA in Table 3 shows that three scales both had multifactor structures, in addition to the UIAT structure. Since they were developed to evaluate IA, a general IA factor might be extracted from each scale. The difference between the models mentioned in Table 4 and Table 3 is that all of the models in Table 4 extracted a general IA factor based on the models in Table 3. The bifactor model requires two or more specific factors in the structure (Cai et al., 2011; Li & Rupp, 2011), and each specific factor needs to contain more than two items (Gomez & McLaren, 2015; MacCallum, Widaman, Zhang, & Hong, 1999; Velicer & Fava, 1998; Zwick & Velicer, 1986). With respect to the IAT, the single-factor model, which was reported by Khazaal et al. (2008), contained only one dimension. In addition, two factors (anticipation, neglect social life) of the six-factor model that was reported by Widyanto and McMurran (2004) both had only two items. Similarly, regarding the Chinese version of GPIUS, two factors (mood alteration; network sociality) of the six-factor model that was reported by Li et al. (2008) both only had two items. Accordingly, the single-factor model (Khazaal et al., 2008) and the six-factor model (Widyanto & McMurran, 2004) for the IAT, as well as the six-factor model (Li et al., 2008) for the Chinese version of GPIUS, were not taken into account in the bifactor CFA. The bifactor CFA was carried out for the three scales and the results are shown in Table 4. These results showed that bifactor structures had a better goodness-of-fit for both the IAT and the GPIUS than previous structures, and the bifactor structure of GAS had an acceptable goodness-of-fit. The two-specific-factor bifactor structure of the IAT suggested by Jelenchick et al. (2012) had the best fit for the Chinese university sample: the RMSEA was less than .05 and the SRMR was less than .08; also, the CFI and TLI were equivalent to .90 or more than .90. The indexes of RMSEA, SRMR, CFI, and TFL also showed that the seven-specific-factor bifactor structure based on Caplan (2002) for the GPIUS was more acceptable. The seven-specific-factor bifactor structure based on Lemmens et al. (2008) for the GAS was slightly inferior to the original structure. To fairly compare the psychometric properties of the three scales, both the two-specific-factor bifactor structure for the IAT and the seven-specific-factor bifactor structures for the GPIUS and the GAS were applied in the subsequent bifactor MIRT analysis (the chosen structures are marked “#” in Table 4).
Bifactor CFA model fit for the suggested structures of three scales (N = 1,067)
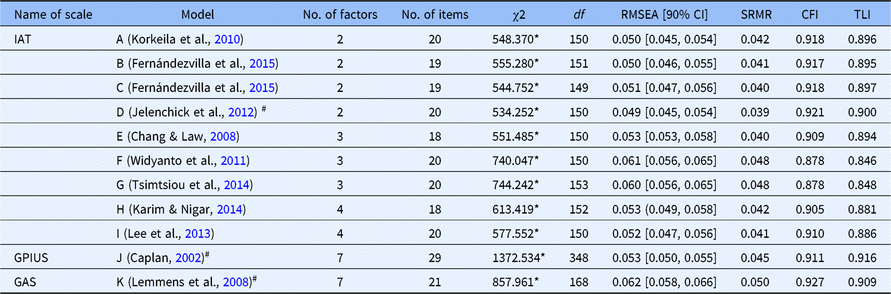
Note: #the chosen structure for the following bifactor MIRT analysis; *p < .05.
Bifactor MIRT Analysis
Given that bifactor structures (see the structures marked # in Table 4) fitted all three scales, their corresponding bifactor MIRT models were then used here to analyze and compare psychometric properties on the general factor (i.e., IA) of three scales.
Item analysis
First, item parameters were estimated for each scale based on their corresponding bifactor MIRT model via the MGRM in flexMIRT3.5. The bifactor MIRT model has a number of parameters, including slope and location parameters. Slope parameter is a measurement of the ability of an item to distinguish various severities of the trait being measured. Items with larger slopes are better for differentiating patients’ symptoms of varying severity. The severity parameter is a sort of location parameter, where a higher location parameter represents more severe symptoms.
The examination of the item parameters for the GPIUS is shown in Table 5. The analysis concerned the item-bifactor modelling, and we constrained each GPIUS item to load onto a general IA factor and only on one specific factor (see Table 5). As an example, for the domain-specific GPIUS mood alteration dimension items, we constrained items 1, 2, 3, and 4 to load on the GPIUS mood alteration dimension (specificity) and the general IA factor shared by all the GPIUS items, including the domain-specific GPIUS social benefit, GPIUS negative outcomes, GPIUS compulsivity, GPIUS excessive time, GPIUS withdrawal and GPIUS interpersonal control scale items (non-specificity). The seven specific factors were orthogonal to each other. Discrimination values greater than 1.5 are considered as high discrimination and generally accepted as capturing considerable amounts of information (Baker, 2001). Moreover, items with high slopes (values ≥1.50) are strongly associated with (i.e., most discriminating) the specified dimension (Kim & Pilknois, 1999; Reise & Waller, 1990). There were 22 items (except for items 1, 2, 16, 17, 18, 24, 27) with high slopes (i.e., greater than 1.5) on the general IA factor. The proportion of the best items is obtained by dividing the number of items with discrimination greater than 1.5 by the total number of scale items. That is to say, approximately 76% of items were strongly connected with the general IA factor and had a better measurement of the general IA factor. Regarding seven specific factors of the GPIUS, 14 items (i.e., items 3, 4, 6, 7, 8, 9, 10, 11, 16, 19, 21, 22, 23, 28) had high slopes, therefore approximately 48% of items were strongly linked with these specific factors. Taken together, most of the seven subscale items were more strongly associated with the general IA factor than with these specific factors. Based on the bifactor model, we estimated item parameters for the GPIUS using MGRM, and location parameters of each item about the GPIUS were increased step by step in a reasonable range.
Item parameters of GPIUS via bifactor MIRT model with seven specific factors (N = 1,067)
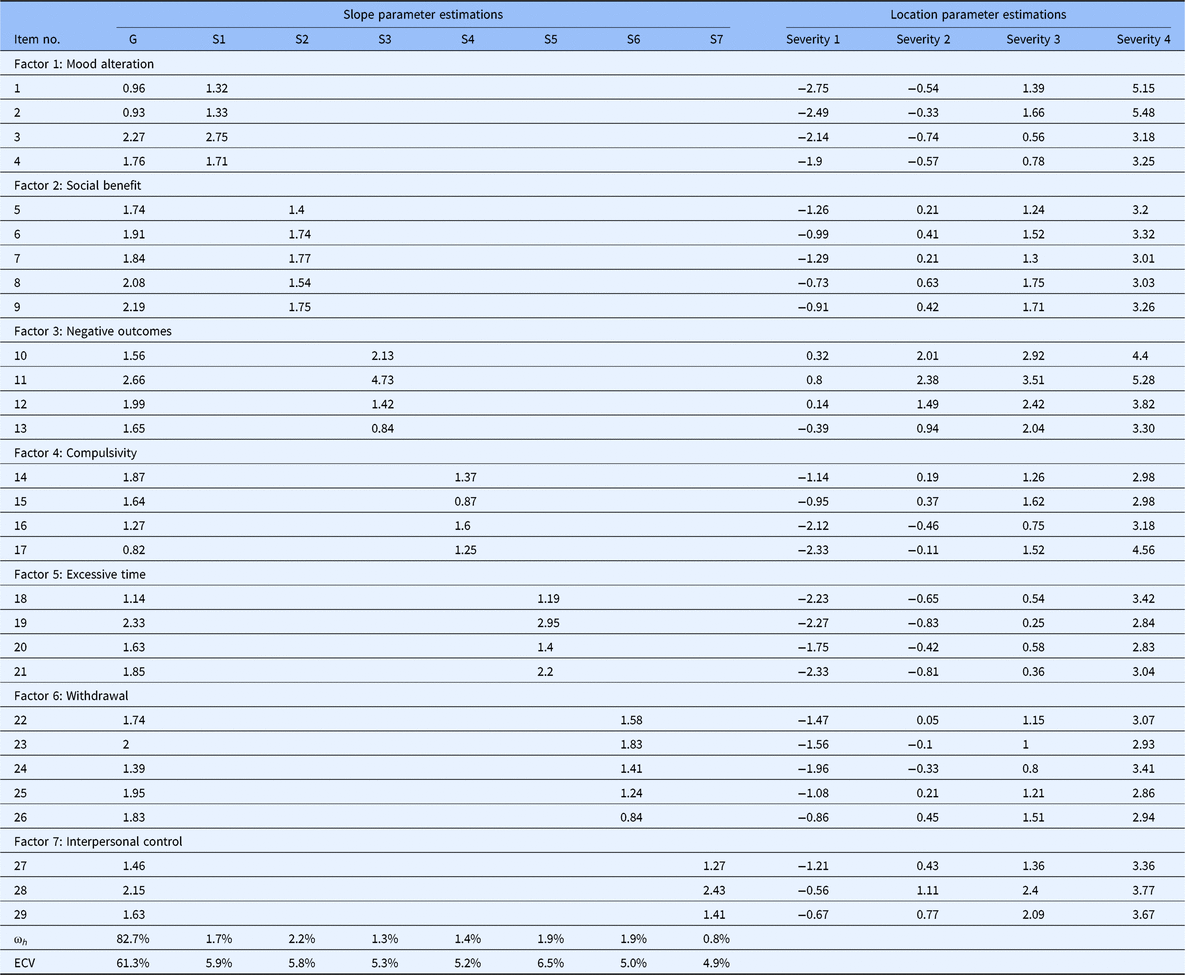
Note: G = item slopes of the general factor; S1–S2 = slopes of two specific factors; Severity 1–Severity 4 = boundary severity of the general factor from score 0 to 1, from score 1 to 2, from score 2 to 3, and from score 3 to 4, respectively; ECV = explained common variance; ω h = omega hierarchical.
The examination of item parameters for the IAT is presented in Table 6. There were high slopes (greater than 1.5) on the general IA factor among 12 items (i.e., items 6, 8, 17, 3, 10, 11, 12, 13, 15, 18, 19, 20), which indicated 60% of items were strongly connected with the general IA factor and provided the most important information about the general IA factor. As for the specific factor of dependent use, only items 6 and 8 had high slopes (greater than 1.5) on this factor. With regard to the specific factor of excessive use, items 18 and 19 had high slopes (greater than 1.5) on this dimension. Therefore, four items — 20% of items —were strongly associated with two specific factors. Generally speaking, most of the items had a better measurement of the general IA factor than of specific factors. Furthermore, location parameters of each item of the IAT gradually increased.
Item parameters of IAT via bifactor MIRT model with two specific factors (N = 1,067)
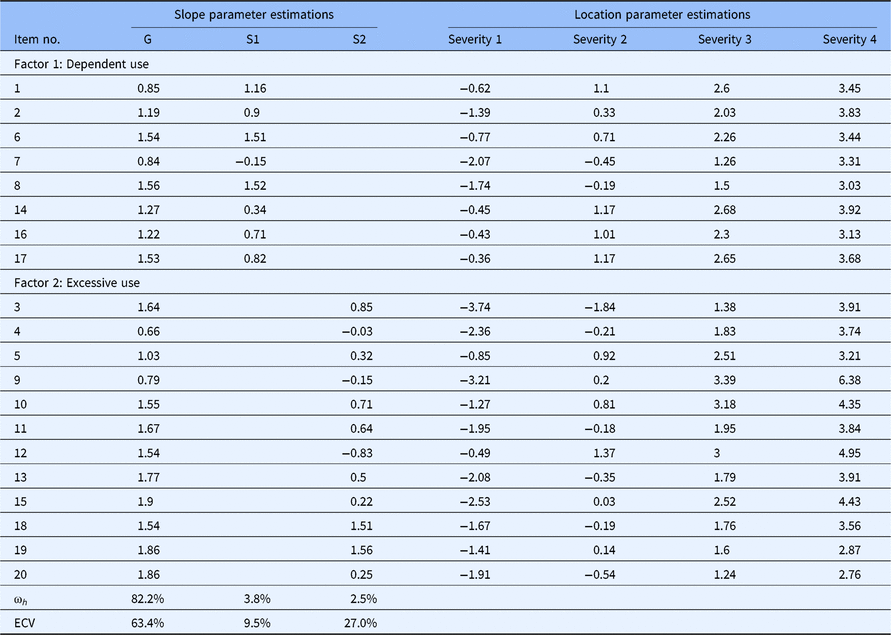
Note: G = item slopes of the general factor; S1–S2 = slopes of two specific factors; Severity 1–Severity 4 = boundary severity of the general factor from score 0 to 1, from score 1 to 2, from score 2 to 3, and from score 3 to 4, respectively; ECV = explained common variance; ω h = omega hierarchical.
The examination of item parameters for the GAS is shown in Table 7. There were 19 items (except for items 16, 21) with high slopes (greater than 1.5) on the general IA factor. That is, about 90% of items were strongly connected with the general IA factor and had a better measurement of the general IA factor. Regarding seven specific factors of the GAS, 8 items (i.e., 2, 4, 5, 9, 11, 13, 14, 15) had high slopes (greater than 1.5), which demonstrated that approximately 38% of items were strongly connected with these specific factors. To sum up, most of the items had a better measurement of the general IA factor than specific factors. Additionally, location parameters of each item about the GAS gradually increased.
Item parameters of GAS via bifactor MIRT model with seven specific factors (N = 1,067)

Note: G = item slopes of the general factor; S1–S2 = slopes of two specific factors; Severity 1–Severity 4 = boundary severity of the general factor from score 0 to 1, from score 1 to 2, from score 2 to 3, and from score 3 to 4, respectively; ECV = explained common variance; ω h = omega hierarchical.
Reliability, information, and SEM
In IRT, the standard error of measurement (SEM) and the reliability were reflected by information. The greater information indicates higher reliability and more measurement accuracy (Yang et al., 2013). Unlike CTT, in which the reliability of a scale is just one whole value (the reliability), the SEM and the information of the IRT is a mathematical function of the trait severity (theta). That is to say, the IRT can provide the reliability, the SEM, and the information for each trait severity (theta) or each individual. We can decide what degree of severity in the scale will give results with the highest accuracy. Here we compared the reliability, the SEM, and the information of the general IA factor of the three scales based on the bifactor MIRT model.
The reliability and the SEM are presented in Figure 2. A coefficient of reliability equal to or
greater than 0.85 indicates a good instrument reliability (May, Littlewood, &
Bishop, 2006). The SEM for a
trait level can be derived via the formula 9 (Palta et al., 2011) when the mean and the standard deviation
of theta are fixed to zero and 1 respectively. Therefore, if the value of the SEM
is approximately equal to or less than 0.39, it represents a low SEM. The
reliability of the IAT was more than 0.85 and the SEM of IAT was less than 0.39 at
the range from −2 to +3 standard deviations of IA severity. With respect to the
GPIUS, the reliability was larger than 0.85 and the SEM was smaller than 0.39 at
the range from −2.8 to +3 standard deviations of IA severity. In terms of GAS, the
reliability was larger than 0.85 and the SEM was smaller than 0.39 at the ranges
from −1.5 to +3 standard deviations of IA severity. However, when the ability
value in the area is smaller than 1.5 standard deviations below the mean of IA
severity, the reliability of the GAS was relatively lower and the SEM was higher
than the other range.
The reliability (solid line) and SEM (dashed line) of the IAT, GPIUS, and
GAS.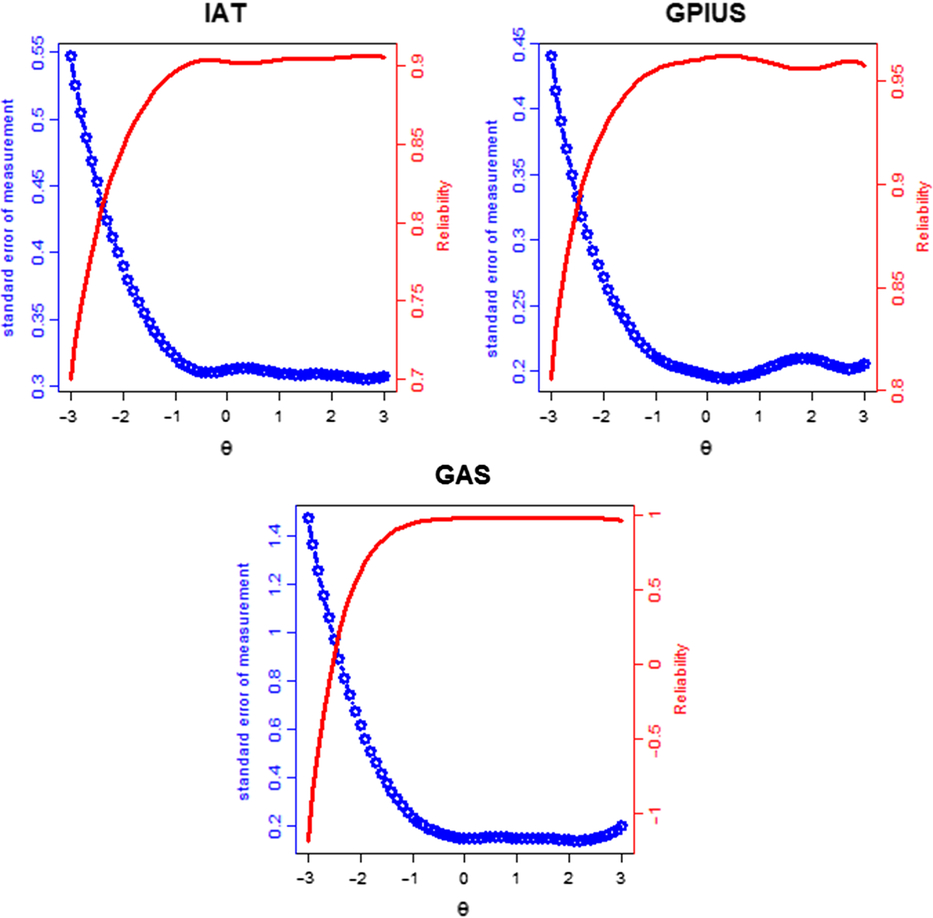
Comparison Analysis of Psychometric Properties of the Three IA Scales
Comparison based on average item information (AII)
The AII of the IAT, GPIUS, and GAS were calculated and the results are shown in Figure 3. The AII can compare the measurement precision of three scales with various lengths. Among the three scales, the AII of the GPIUS was the largest in the range, from −3 to −1 standard deviations of IA severity, while at other areas of theta value, the AII of the GAS was the largest in the three scales. The AII of the IAT was always smaller than the other two scales in large areas of IA severity. The results suggested that the GAS can provide more measurement precision for varying degrees of IA severity, and this suggests that the GAS may be more useful for measuring IA severity in clinical trials and measuring IA severity as an index of treatment response. In addition, the GPIUS and the IAT can provide more measurement precision in the range from −3 to −1 standard deviations of IA severity, which may be likely to be applied to epidemiological studies.
Average item information curves.
Comparison based on relative efficiency (RE)
The RE of three scales were compared to investigate which instrument was the best one on the specified range when compared with the other instruments, to make the best decision on which scale to be selected. Relative efficiency curves are presented in Figure 4. The RE of the GAS compared to the IAT may be bigger than 1 in the range from −1.3 to +3 standard deviations of IA severity, while smaller than 1 in the range from −3 to −1.3 standard deviations of IA severity. It suggests that when comparing the GAS with the IAT, choosing the GAS may be better in the range from −1.3 to +3 standard deviations of IA severity, while the IAT may be a better choice in the range from −3 to −1.3 standard deviations of IA severity.
Curves of relative efficiency.
The RE of the GAS compared to the GPIUS may be higher than 1, in the range from −1 to +3 standard deviations s of IA severity while smaller than 1 in the range from −3 to −1 standard deviations of IA severity. It shows that when comparing the GAS with the GPIUS, choosing the GAS may be better in the range from −1 to +3 standard deviations of IA severity, while the GPIUS may be a better choice in the range from −3 to −1 standard deviations of IA severity.
Moreover, the RE of the GPIUS compared to the IAT may be higher than 1 at any range of IA severity. It indicates that when comparing the GPIUS with the IAT, choosing the GPIUS may be better at varying degrees of IA severity.
Conclusions and Discussion
Using a bifactor approach with a large sample of Chinese university students, the current study investigated structures and simultaneously compared psychometric properties of three commonly used self-rating IA instruments, including the IAT, the GPIUS, and the GAS.
The CFA and bifactor CFA suggested bifactor structures were most suitable for the IAT, the GPIUS, and the GAS. More specifically, the IAT had a two-specific-factor bifactor structure while both the GPIUS and the GAS had a seven-specific-factor bifactor structure. A correlated factors model does not include a general factor and attributes all explanatory variance to first-order factors (Morgan, Hodge, Wells, & Watkins, 2015). A correlated factors model is conceptually ambiguous because it is not able to separate the specific or unique contributions of a factor from the effect of the overall construct shared by all interrelated factors (Chen, Hayes, Carver, Laurenceau, & Zhang, 2012), whereas a bifactor model contains a general factor (G) and multiple specific factors (S). Because G and S are independent, a bifactor model can disentangle how each factor contributes to the systematic variance in each item. The possibility of segmenting the variance in independent sources is one of the primary advantages of the bifactor model (Reise, 2012). In addition, the bifactor structure has consistently proven to provide superior model fit for IA symptoms across measures in many large samples, compared with conventional correlated factors model (Watters et al., 2013). Together with previous reports of a strong general factor in several adult samples (Khazaal et al., 2008; Korkeila et al., 2010), the total score of IA scales may be a viable general index of IA (Watters et al., 2013); this finding lends further confidence to the phenomenon that this bifactor solution offers a more optimal representation of the data than any of the previously suggested correlated-factors structures. As for the IAT, in Table 4 it was noteworthy that we not only considered several competing models with 20 original items, but also other variations have been taken into account in establishing models, including models B, C, E, and H. However, compared with any of previously existing structures, results of the CFA and bifactor CFA indicated that the two-specific-factor bifactor structure (Model D; Jelenchick et al., 2012; with 20 original items) provided an optimal representation for this population. On the one hand, this result may be explained by the fact that two factors for the IAT may be more appropriate than three or more factors (Pawlikowski et al., 2013). On the other hand, commonality of the internet usage environment and similar demographic information, such as average age and gender rate, may account for why the factor structure of the IAT suggested by Jelenchick et al. (2012) had the best fit for the Chinese university sample. The three-factor structure of IAT (Model E) suggested by Chang and Law (2008) had the best fit for the Hong Kong university sample. Our findings are not inconsistent with the results and conclusions of Chang and Law (2008). In spite of these inconsistencies, the items clustered within the “withdrawal and social problems” and “reality substitute” factors of Chang and Law (2008) indicate broad overlap with the “dependent use” factor of Jelenchick et al. (2012). Similarly, the “excessive use” factor of Jelenchick et al. (2012) is consistent with the “time management and performance” factor by Chang and Law (2008). We believe these inconsistencies are most likely due to differences inherent in the samples used for analysis such as size and age, or differences in specific characteristics of the university environment and popularity of internet use. Currently, a major obstacle to conducting a multidimensional scoring structure for the IA instruments is the lack of consistency on the exact number and composition of the subscales. Items evaluating adverse functional outcomes of internet use (e.g., social isolation, interpersonal and intrapersonal problems) have been particularly difficult to classify by employing traditional factor analysis approach (Beard & Wolf, 2001). Being able to accommodate these complex structural relationships based on a bifactor analysis approach is a notable strength of the present study. These corresponding bifactor structures were used in the subsequent bifactor MIRT analysis.
Furthermore, the bifactor MIRT analysis on psychometric properties of the three instruments showed that the three scales had both high reliabilities and low SEMs at the broad range of IA severity, which indicates that the three scales performed well overall. The findings also provide suggestions for determining which scale to use in a given study design: the GAS evaluated IA along a wider range of severity with more precision than the other two scales and thus it is appropriate to measure relatively lower and much higher levels of IA symptomatology. This suggests that the GAS may be more useful for measuring IA severity in clinical trials and measuring IA severity as an index of treatment response. The GPIUS and the IAT provided more information at the lower level of IA symptomatology. The findings suggest that the GPIUS and the IAT are likely to be applied to epidemiological studies. This work finds consistency between past rationale for the use of the GAS in clinical trials (King, Haagsma, Delfabbro, Gradisar, & Griffiths, 2013) while using the GPIUS and IAT in epidemiological IA studies (Kuss, Griffiths, Karila, & Billieux, 2014). In addition, the IAT and the GPIUS evaluated information at greatly overlapping ranges, with the GPIUS performing better at the same levels of severity of IA. Of note, in fact, we focused on the comparison of the general factor (i.e., IA) in the bifactor MIRT model while ignoring specific factors of the three scales in the current study. The IAT merely performed worse than the GPIUS on psychometric properties of the general IA factor; however, psychometric properties, including the reliability, the SEM, the AII, and the RE of specific factors for three scales were not investigated. Thus, the issue was confused as to whether the IAT is better or worse than the GPIUS on psychometric properties of specific factors.
Another contribution of this study was that a new approach of the bifactor MIRT model was used to fit the multidimensional structures of IA scales, while almost all of the prior studies used CTT approaches (which cannot offer specific information on the severity of IA symptomatology with respect to the different ability levels) or UIRT methods (the unidimensionality is difficult to be satisfied for IA scales). In a bifactor MIRT model, each item of the scale was able to not only load onto one specific factor but also a general factor (Osman et al., 2012), in which we could derive more information from the items and participants for both a general factor and specific factors. Therefore, compared with CTT and UIRT approaches, the bifactor MIRT approach had natural advantages for analyzing psychological scales with multidimensional structures. There are some suggestions for conducting a bifactor MIRT model. For example, the sample size needs to be large enough to accurately calibrate item parameters — generally, the sample should number more than 1,000 (Gignac, 2016; Umegaki & Todo, 2017). Instruments should have a relatively short length (no more than 30 items; Widyanto et al., 2011). Meanwhile, the bifactor MIRT model requires two or more specific factors in the structure (Cai et al., 2011; Li & Rupp, 2011), and each specific factor needs to contain more than two items (Gomez & McLaren, 2015; MacCallum et al., 1999; Velicer & Fava, 1998; Zwick & Velicer, 1986).
It is worth noting that the other commonly employed model is the second-order model, with items loading onto first-order factors while first-order factors load onto a second-order factor (Reise et al., 2007). A second-order model with three first-order factors is shown in Figure 5. The differences between a bifactor model and a second-order model are as follows. First, in a bifactor model, the general factor and specific factors are variables defined at the item level, that is, the general factor is on the identical conceptual level as specific factors. However, in a second-order model, a second-order factor and first-order factors are not defined on the same level, first-order factors are defined in the item level, while the second-order factor is defined on the first-order factors (Reise et al., 2007). Second, a second-order model is nested within a bifactor model (Yung, Thissen, & Mcleod, 1999); in addition, a bifactor model has less restriction than a second-order model. Compared with the second-order model, there are major advantages of the bifactor model. For instance, in a bifactor model, we can explore the role of group factors. The role of group factors is reflected by factor loadings. The orthogonality of group factors is also helpful to predict external criteria. Further advantages of the bifactor model can be seen in Chen et al. (2006). Given its advantages, bifactor modelling has been applied increasingly to health-related studies investigating the structure of complex constructs that are characterised by a strong general factor yet meanwhile show evidence of multidimensionality (Gibbons, Rush, & Immekus, 2009; Reise et al., 2010; Thomas, 2012; Toplak et al., 2009). More specifically, three scales of the present study were multidimensional structures and could extract a general factor (i.e., IA); accordingly, a bifactor model could be used.
A second-order model with three first-order factors.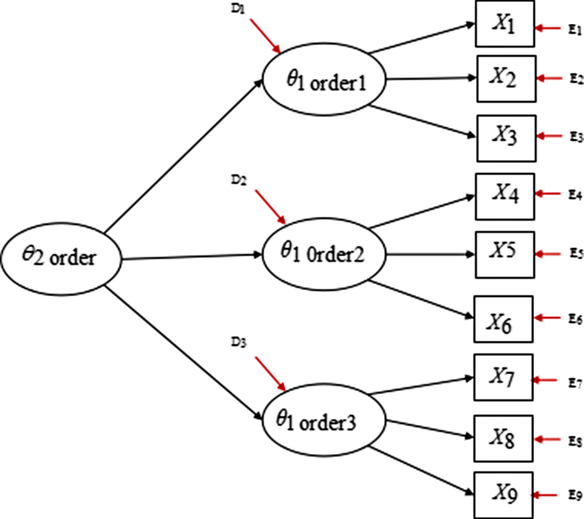
Some fields should be considered in future studies. First, as only the current three self-rating IA scales were selected in this study, other commonly used self-rating IA scales (such as the Online Cognition Scale; Davis, Flett, & Besser, 2002) and the Internet Related Problem Scale (Armstrong, Phillips, & Saling, 2000) and other types of scales (such as interview scales and clinician-rated scales) could be considered in future studies. Second, of note, the bifactor approach has been successfully employed to resolve similar inconsistencies in the measurement structure of the Beck Depression Inventory-II, generating repeatedly better-fitting models across different samples of adolescents and adults (Brouwer et al., 2013; Quilty, Zhang, & Bagby, 2010; Ward, 2006). The current study applied a bifactor analysis to investigate structures and simultaneously compare the psychometric properties of three commonly used self-rating IA instruments for college students. Future studies can extend the bifactor approach to adolescents and adults. Development of a novel screening instrument that covers a broader range of IA severity and has the greatest amount of test information at any point on the trait continuum is also a future direction.
Footnotes
Financial Support
This study was funded by National Natural Science Foundation of China (31760288, 3166278).
Conflict of interest
None.