
Abstract
Introduction
The green pit viper (GPV) Trimeresurus albolabris is found in Southeast Asia. Its venom has a thrombin-like activity that can cause hypofibrinogenemia. Fibrinogen measurement is not always available. We aimed to establish a more available diagnostic tool indicating hypofibrinogenemia caused by GPV envenomation.
Methods
This was an in vitro study, in which healthy subjects aged 20 to 45 y were enrolled. There were 2 experiments. In Experiment 1, blood samples from 1 subject had varying amounts of T albolabris venom added to determine its effect on the fibrinogen level (FL). In Experiment 2, 3 sets of blood samples were obtained from another 25 subjects. The 2 venom doses established in Experiment 1 were used on 2 sets of the samples to simulate severe (FL <1.0 g·L−1) and mild hypofibrinogenemia (FL 1.0–1.7 g·L−1). The third set of samples was venom-free. All samples were used for platelet counts, prothrombin time (PT)/international normalized ratio (INR)/activated partial thromboplastin time (aPTT), and 2 bedside clotting tests. Diagnostic parameters were calculated against the target FL of <1.0 g·L−1 and <1.7 g·L−1.
Results
Twenty-five subjects were enrolled in Experiment 2. On referencing normal cutoff values (platelet count >150,000 cells/mm3, venous clotting time <15 min, normal 20-min whole blood clotting time, INR <1.2, aPTT <30), we found abnormalities of 5, 0, 0, 3, and 22%, respectively. The highest correlation with hypofibrinogenemia was provided by PT/INR. For an FL of <1.0 g·L−1, PT and INR revealed the highest areas under the receiver operating characteristic curve, 0.76 (95% CI, 0.55–0.97) and 0.76 (95% CI, 0.57–0.97), respectively. The highest accuracy and the highest sensitivity were provided by PT/INR.
Conclusions
PT/INR could be used as a diagnostic test for severe hypofibrinogenemia in GPV envenomation because of its high accuracy and area under the receiver operating characteristic curve.
Introduction
A green pit viper (GPV) (Trimeresurus spp) bite is the most common snakebite in Thailand. 1 The 2 most common GPV species, especially in the Bangkok area, are Trimeresurus albolabris (the white-lipped pit viper) and Trimeresurus macrops (the big-eyed pit viper). 2 The venom components of the 2 species are similar; however, the venom from T albolabris is more potent. 3 A study on the proteomes of T albolabris venom revealed that the venom mainly contains metalloproteinases (37%), phospholipases A2 (19%), disintegrin (14%), serine protease (13%), and C-type lectin (9%). 4 In clinical practice, the main systemic effects from a bite of these species are due to hypofibrinogenemia and thrombocytopenia. 5 Hypofibrinogenemia is caused by the synergism of several venom components, of which the thrombin-like enzyme (TLE), GPV-TL1/albolabrase, 6 –8 is likely the most essential. 4 The TLE cleaves only fibrinopeptide A from fibrinogen, but not fibrinopeptide B, before fibrin polymerization to form a clot. The clot formed from stimulation of the venom is friable and dissolved quickly by the fibrinolytic system. 9 The entire process leads to the depletion of fibrinogen. Another mechanism for systemic bleeding is thrombocytopenia caused by C-type lectins, alboaggregin B and D, which promote platelet aggregation. 4 In addition, disintegrin potentiates platelet dysfunction. 4 Through these mechanisms, GPV envenomation can cause systemic bleeding; however, in clinical practice, this occurs uncommonly. Most commonly, GPV envenomation causes local effects and mild or moderate coagulopathy. 2
Available guidelines for GPV bites recommend using platelet count and either venous clotting time (VCT) or 20-min whole blood clotting time (20WBCT) as diagnostic laboratory tests to indicate systemic envenomation and for antivenom therapy. 10 –12 A study published in 2012 revealed that prothrombin time (PT) and international normalized ratio (INR) provided the highest areas under the receiver operating characteristic curve (AUROCC) when a fibrinogen level of <1.0 g·L−1 was used to indicate severe coagulopathy from GPV envenomation because of the risk of systemic bleeding. 13 The study also demonstrated that an INR of ≥1.2 s had the highest sensitivity in predicting severe hypofibrinogenemia.
On one hand, fibrinogen measurement is not widely available in Thailand. On the other hand, PT and INR tests are much more available; they can be done any time; and because they are standardized and highly reproducible, we thought that they might have great potential to replace bedside diagnostic tests (VCT and 20WBCT). However, to the best of our knowledge, there is only 1 published study demonstrating great diagnostic accuracy of PT/INR for evaluating hypofibrinogenemia from systemic envenomation by GPV. 13 More studies on PT/INR are needed to determine its utility in confirming GPV envenomation.
The objective of this study was to evaluate a widely available diagnostic test that may be useful to detect hypofibrinogenemia from GPV envenomation.
Methods
This was a simulated in vitro study. With the in vitro design, we had many more blood samples with fibrinogen levels of <1.0 g·L−1 than would be expected in severe coagulopathy from a GPV bite.
Our study period was between January 1 and June 30, 2016. The inclusion criteria were healthy volunteers aged between 20 and 45 y, with no history of regular medication or use of any medication within the previous 2 wk, and literate in the Thai language. Volunteers who were pregnant or had any abnormal baseline blood test results were excluded. Only 2 venipunctures were permitted per protocol to obtain blood samples. Written informed consent was obtained from participants prior to enrollment. The study protocol was approved by the ethics committee of the Faculty of Medicine, Vajira Hospital (COA 74/2558).
This study consisted of 2 experiments. In Experiment 1, the blood samples of 1 subject had varying amounts of GPV venom added to determine its effect on the fibrinogen level in the sample. The optimal dose of venom to reduce the fibrinogen level in 3 mL of blood to <1.0 g·L−1 (to simulate severe hypofibrinogenemia) and to a range of 1.0 to 1.7 g·L−1 (to simulate mild hypofibrinogenemia) was determined. A fibrinogen level of <1.0 g·L−1 was derived from a previous study, 13 which was thought to be associated with clinical systemic bleeding, whereas the level of 1.7 g·L−1 was the lower limit of the normal reference range of the fibrinogen level.
The venom used in this study was a horse-derived lyophilized form produced from the pooled venom of T albolabris. The venom was produced by the Queen Saovabha Memorial Institute, Thai Red Cross Society, a World Health Organization collaborating center for venomous snake toxicology and research. The institute produces products such as snake venom/antivenom and rabies vaccine/immunoglobulin according to Good Manufacturing Practice and World Health Organization regulations. The laboratory was accredited with an ISO/IEC 17025 certificate in 2005 (
There were 2 steps in Experiment 1. Because the doses of GPV venom that could cause hypofibrinogenemia in 3-mL blood were unknown, we prepared 10 tubes of 3-mL blood for venom titration to yield the 2 ranges of required fibrinogen levels. All blood samples in this experiment were from 1 healthy volunteer. The first 4 sodium citrate tubes were initially used to roughly estimate the doses by titrating from 1.0, 0.1, 0.01, to 0.001 mg of venom. The fibrinogen level in each of the first 4 tubes was measured. The remaining 6 sodium citrate tubes were used to finely adjust for more precise doses. The acquired 2 final doses of venom were used to simulate severe and mild hypofibrinogenemia in Experiment 2.
In Experiment 2, we collected blood samples from another 25 healthy volunteers (the only subject in Experiment 1 was not included in this experiment), 60 mL per person. Blood from each of them was allocated into 3 groups, group 1 (to simulate severe hypofibrinogenemia), group 2 (to simulate mild hypofibrinogenemia), and group 3 (control). Six tubes were needed per group, 1 blue-top (sodium citrate—for PT/INR, activated partial thromboplastin time [aPTT], and fibrinogen level), 1 purple-top (ethylenediaminetetraacetic acid [EDTA]—for complete blood count with platelet count), and 4 clean glass tubes (3 for VCT, 1 for 20WBCT) as seen in Figure 1.
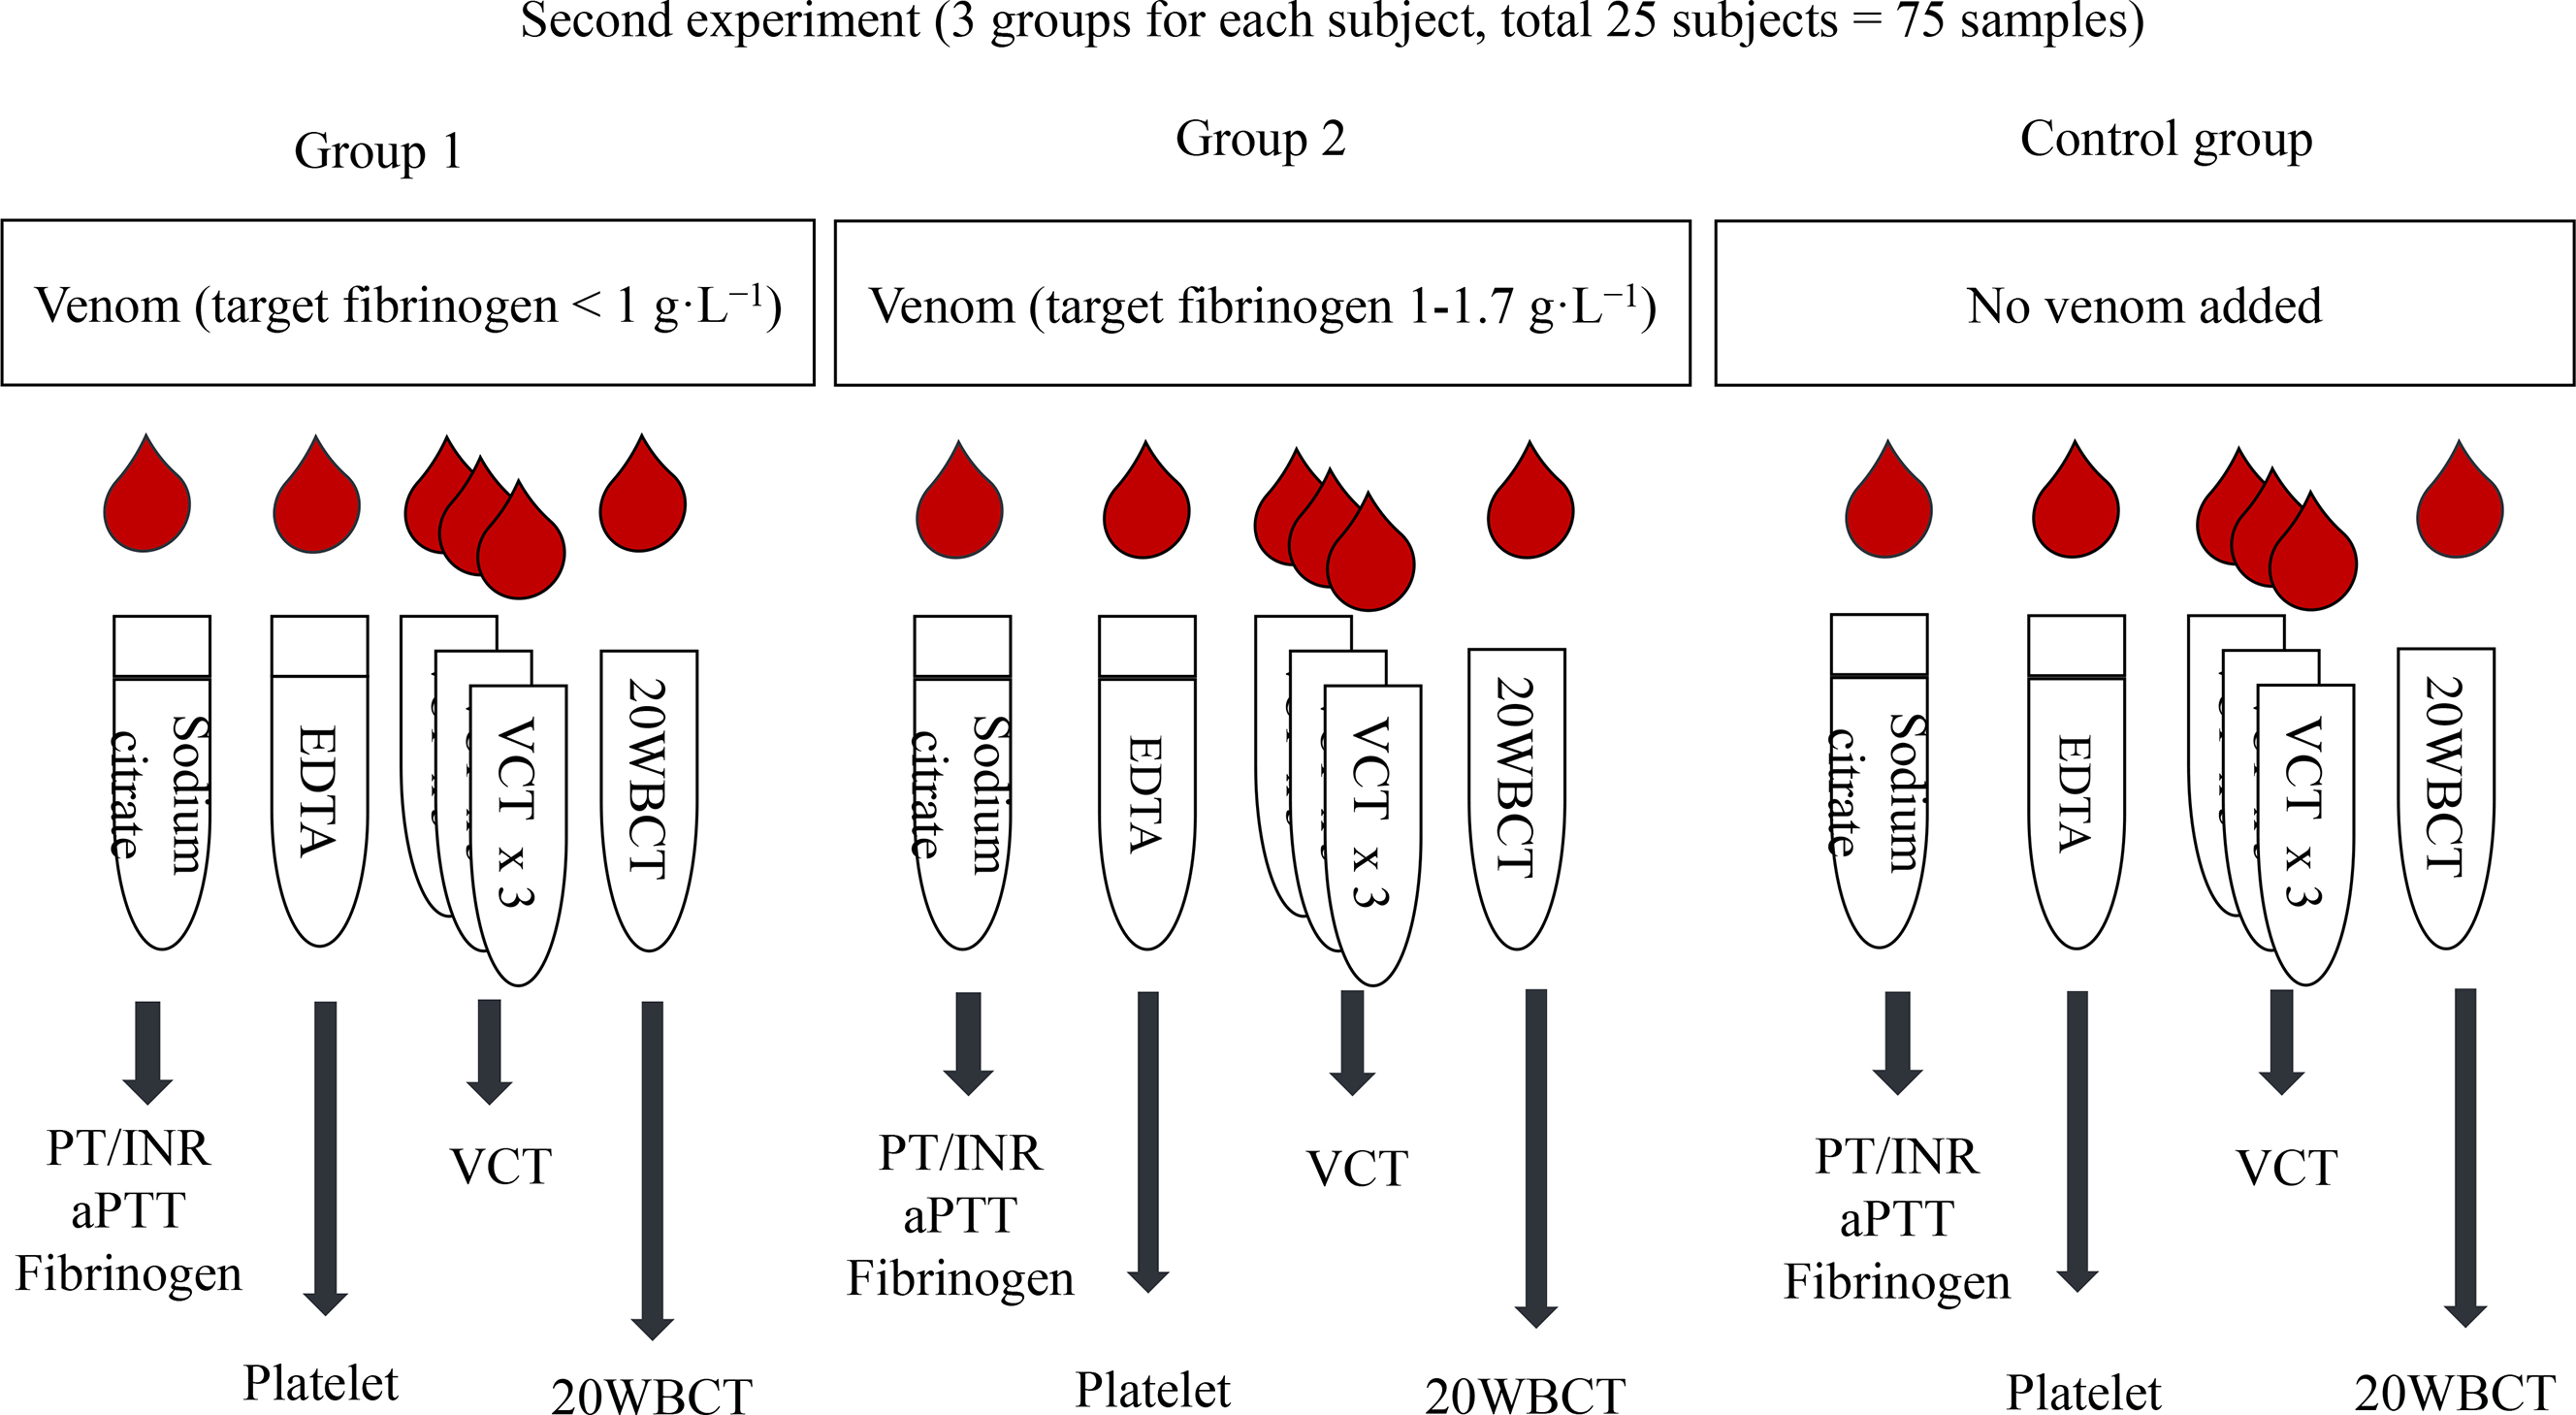
Figure 1. Second experiment: process and equipment preparation for each group. 20WBCT, 20-min whole blood clotting time; aPTT, activated partial thromboplastin time; EDTA, ethylenediaminetetraacetic acid; INR, international normalized ratio; PT, prothrombin time; VCT, venous clotting time.
In group 1, the venom dose expected to lower the fibrinogen level to <1.0 g·L−1 yielded from Experiment 1 was added to the first 25 blood samples to simulate severe hypofibrinogenemia. In group 2, the venom dose derived from Experiment 1 that was expected to lower the fibrinogen level to between 1.0 and 1.7 g·L−1 was added to another 25 blood samples to simulate mild hypofibrinogenemia. In group 3, no venom was added to the last 25 blood samples, and this served as a control and simulated a “dry bite.”
All tubes in group 1 and group 2 were prefilled with the venom (dose obtained from Experiment 1). The venom was prepared in the morning just before enrolling subjects on the designated days. Once blood was drawn from each individual subject, 3 mL of blood was immediately placed in each tube in all the 3 groups and then mixed well. For the VCT and 20WBCT, we started the clock immediately after the blood touched the tube. For the sodium citrate and EDTA tubes, they were transported to the laboratory next door, and all the processes were started within 3 to 5 min. The sodium citrate tube was centrifuged at 3000 revolutions per min for 15 min; then, it was placed in a Sysmex CS2100i machine, a fully automated blood hemostasis analyzer, for analysis of fibrinogen, PT/INR, and aPTT. The EDTA tube was placed in a Sysmex XT-4000i machine for platelet count. Because the lower limit of detection of fibrinogen level from the Sysmex CS2100i is 0.3 g·L−1, we substituted the undetectable value of the fibrinogen level with 0 g·L−1 for data analysis.
VCT is a bedside test. In this study, 9 mL of blood was drawn from a vein, and 3 mL was placed in 3 glass tubes each in sequence. The first tube was marked with the number 3, the next with number 2, and the last one with number 1. A clock was started when blood touched the tube number 3. They were undisturbed for 5 min. After 5 min had passed, tube number 1 was first tilted approximately 45° every 30 to 60 s until a clot was seen, then tube number 2 was tilted until a clot was seen, and then the same process was repeated with tube number 3. The time from starting the clock to observing clot formation in tube number 3 was the VCT. 2 For 20WBCT, the process was similar to that for VCT; however, only 1 tube of 3-mL blood was required, and it was left undisturbed for 20 min to allow a clot to form. The tube was tilted only once, at the end of 20 min, to check, and if the blood was still liquid, this was taken to mean that it was unclotted. 11
SPSS (version 21.0; SPSS Inc, Chicago, IL) was used for statistical analysis. Quantitative data, that is, the results of VCT, 20WBCT, platelet count, PT/INR, aPTT, and fibrinogen level, are presented as mean±SD. Our statistical analysis consisted of the diagnostic parameters, including sensitivity, specificity, accuracy, correlation coefficient, and AUROCC, in which a fibrinogen level of <1.0 g·L−1 was used as an indicator for severe coagulopathy. Statistical significance was defined as a P value of <0.05.
Results
Twenty-six healthy volunteers were recruited; 1 for Experiment 1 and 25 for Experiment 2. The subject of Experiment 1 was a 26-y-old man; the subjects of Experiment 2 were 17 (68%) women and 8 men, with a group age of 33±6 y.
In Experiment 1, 1.0, 0.1, 0.01, and 0.001 mg of lyophilized GPV venom were added to each of the first 4 tubes. Fibrinogen levels according to the amount of venom titration are shown in Table 1. Doses of 1 to 0.01 mg resulted in an undetectable fibrinogen level (<0.3 g·L−1), whereas a dose of 0.001 mg lowered the fibrinogen level to 1.757 g·L−1. After fine titration, we selected a dose of 0.008 mg and 0.004 mg to be used in Experiment 2. The normal range of fibrinogen level is 2 to 4 g·L−1. The control fibrinogen level obtained from the 1 subject in Experiment 1 was 2.23 g·L−1, which was on the lower side of the normal range. We were concerned that the remaining 25 healthy volunteers may have had higher fibrinogen levels, for example, between 3 and 4 g·L−1, and as a result, selecting a venom dose lower than 0.004 mg may have not decreased fibrinogen levels to between 1.0 and 1.7 g·L−1. As such, we selected 0.004 mg of venom for group 2 in Experiment 2 (to bring down the fibrinogen level to 1.0–1.7 g·L−1) and 0.008 mg of venom for group 1 in Experiment 2 to reduce the fibrinogen level below 1.0 g·L−1.
Fibrinogen levels according to the amount of venom titration
No coagulation represents a fibrinogen level of <0.3 g·L−1.
In Experiment 2, of the 75 samples (25·3 groups), only 59 (79%) were adequate for final analysis. Sixteen samples were excluded from the analysis because of unexpected rapid gelatinization of the serum after adding venom to those sodium citrate blood samples. In addition, some of the samples for complete blood count and platelet count exhibited clotting, which precluded further testing for coagulogram or platelet count because the machine could not work with samples in solid form. Table 2 presents the results of blood samples with venom and those without venom. Platelet count and fibrinogen level were lower in the group with venom than in the control samples. In Experiment 2, of the 59 samples, 6 (10%) had severe hypofibrinogenemia, 8 (14%) had mild hypofibrinogenemia, and 45 (76%) had normal fibrinogen levels. Even though 10% of the samples had severe hypofibrinogenemia, none of the 20WBCT test samples were unclotted.
Comparison of mean and standard deviation of each test between the blood samples with and without venom
VCT, venous clotting time; PT, prothrombin time; INR, international normalized ratio; aPTT, activated partial thromboplastin time.
Table 3 shows that platelets and VCT had no significant correlation with fibrinogen level in this simulated in vitro GPV bite study. In contrast, PT/INR and aPTT showed a significant negative correlation with fibrinogen level. When the fibrinogen level was reduced, PT/INR and aPTT became prolonged. We found that PT and INR had a stronger correlation coefficient (−0.34 and −0.33, respectively) than that of aPTT (−0.29).
Correlation coefficient between fibrinogen level and other laboratory testing parameters and the AUROCC for severe hypofibrinogenemia
VCT, venous clotting time; PT, prothrombin time; INR, international normalized ratio; aPTT, activated partial thromboplastin time; AUROCC, area under the receiver operating characteristic curve.
Using a fibrinogen level of <1.0 g·L−1 as an indicator for severe hypofibrinogenemia and risk of systemic bleeding, PT and INR showed the highest AUROCC, 0.76 (0.55–0.97) and 0.76 (0.57–0.97), respectively (Table 3, Figure 2).
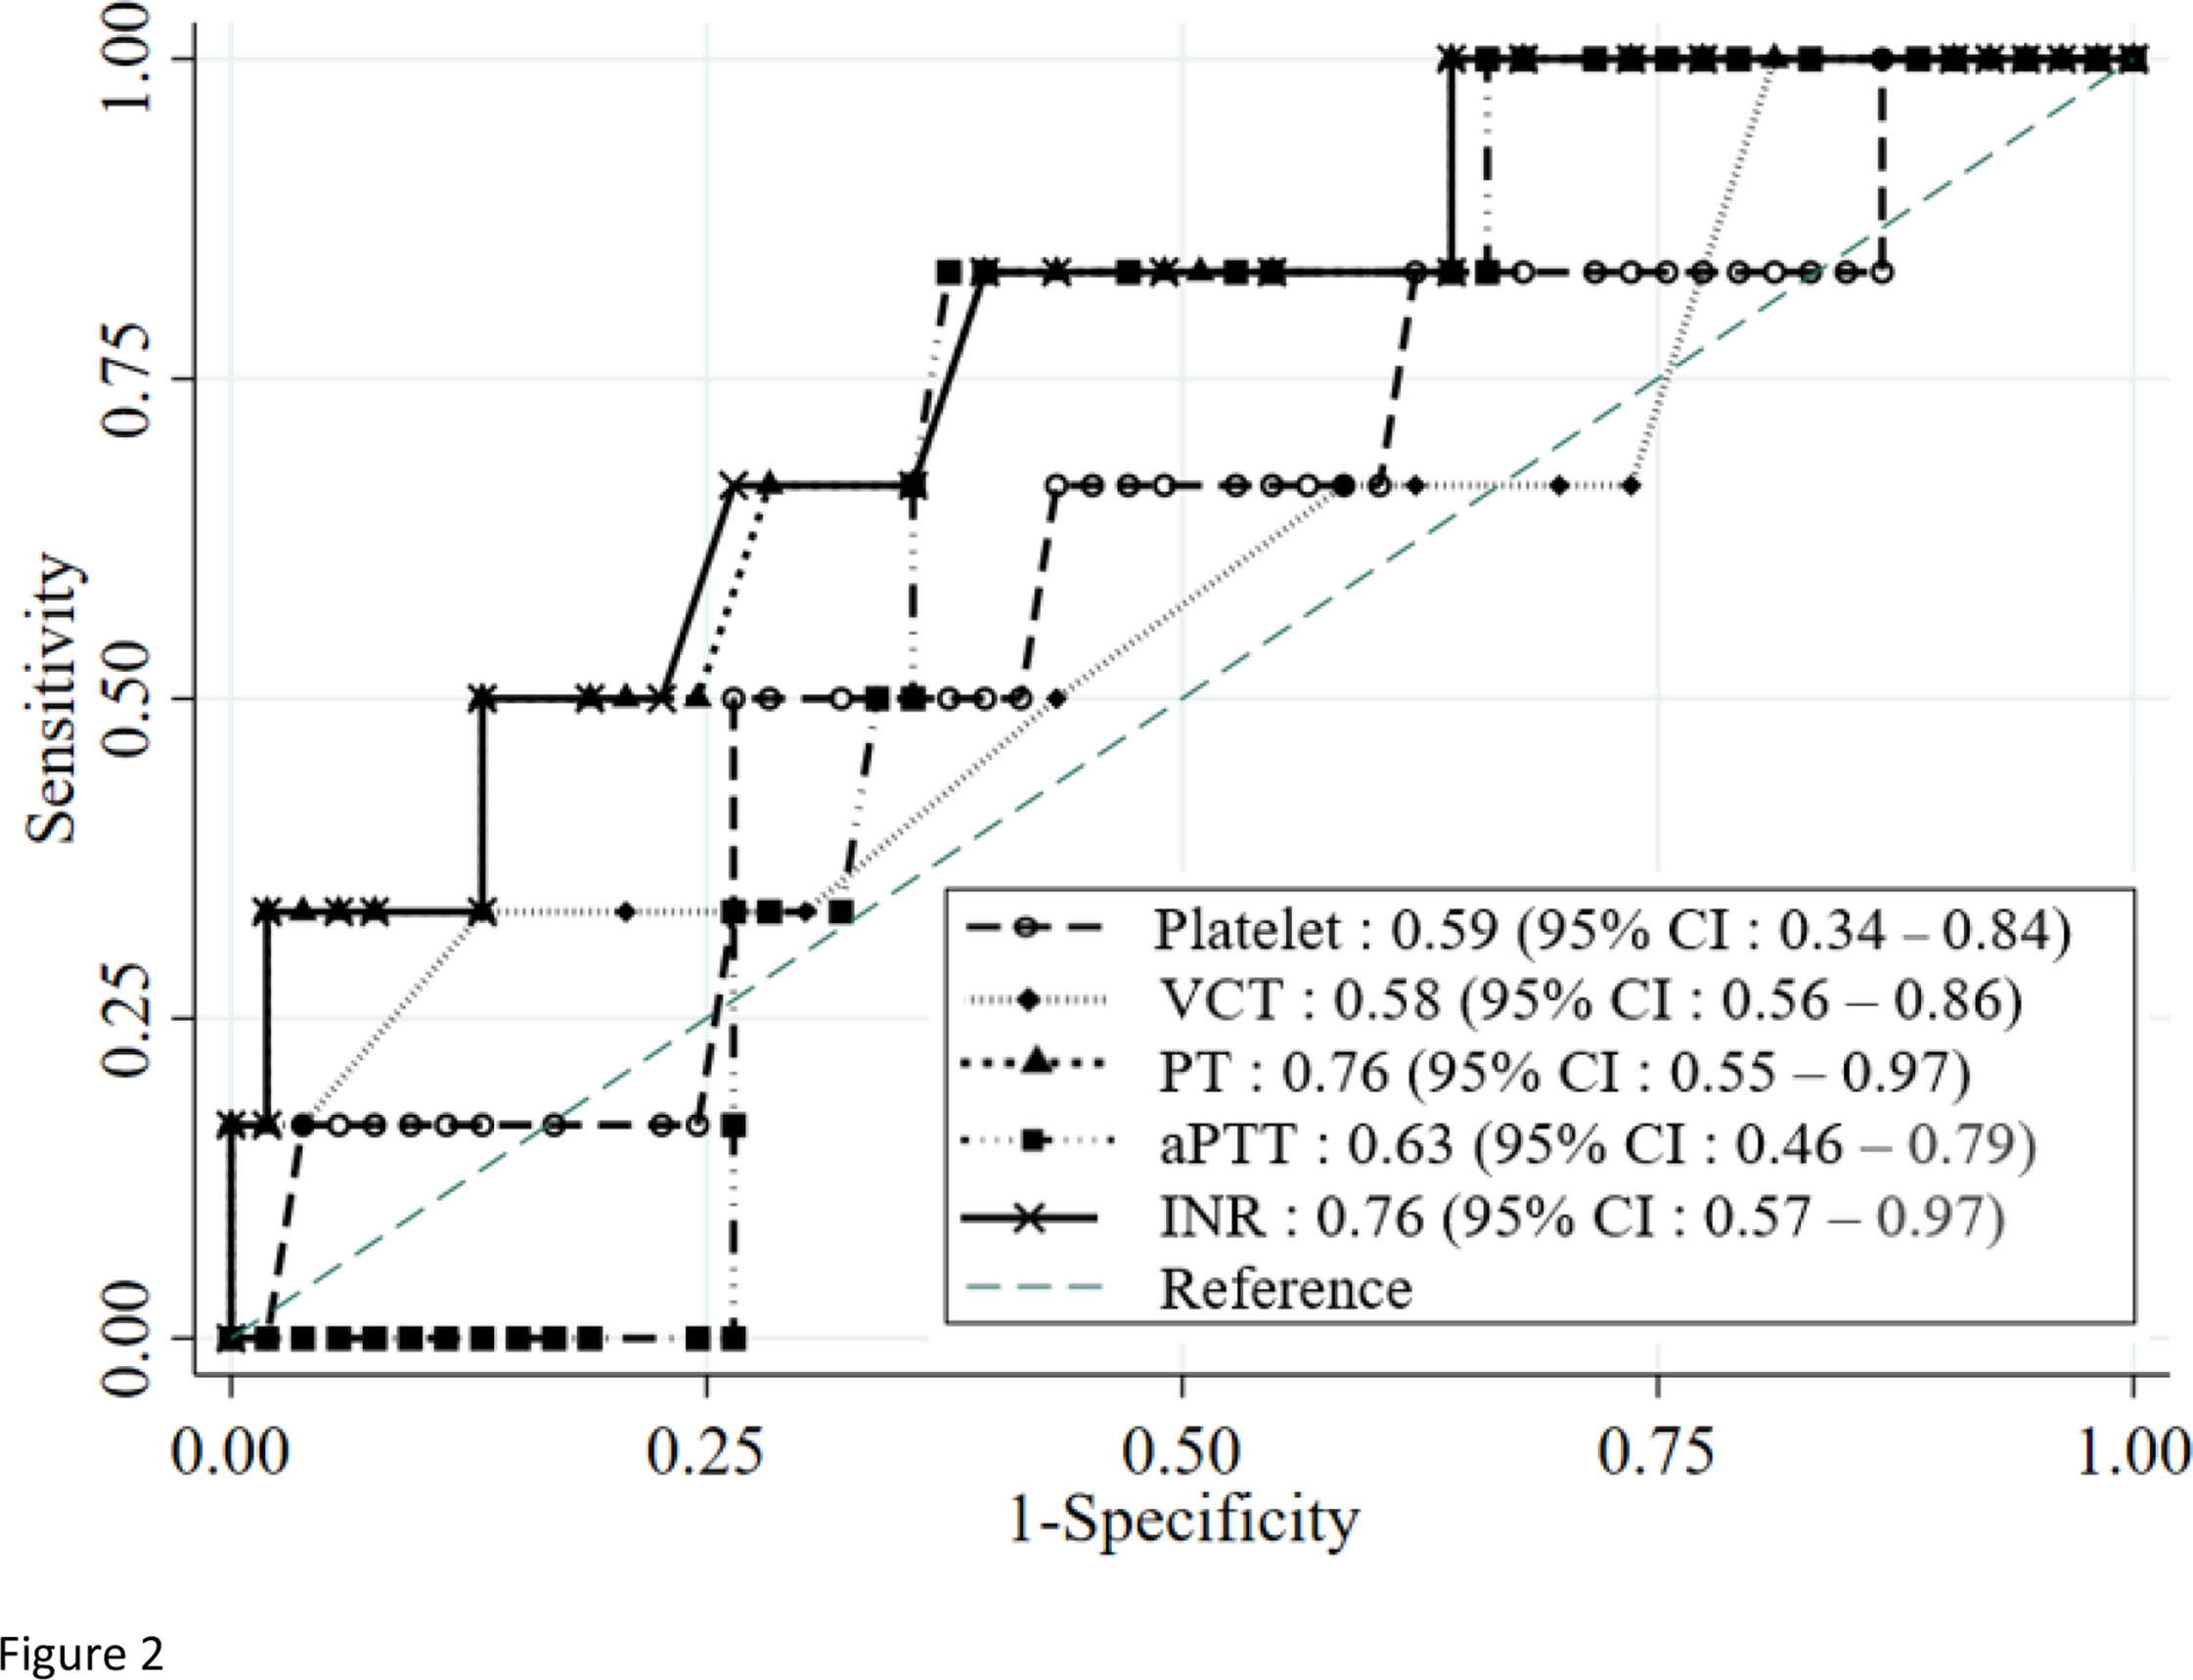
Area under the receiver operating characteristic curve of each diagnostic laboratory test against fibrinogen level <1 g·L−1 in this in vitro simulated green pit viper envenomation. aPTT, activated partial thromboplastin time; INR, international normalized ratio; PT, prothrombin time; VCT, venous clotting time
For samples with severe hypofibrinogenemia, a VCT of >15 min, abnormal 20 WBCT, an INR of >1.2, and a PT of >13.4 s had the same high accuracy at 90%, unlike an aPTT of >30 s, which had much lower accuracy (68%) (Table 4). On changing the fibrinogen level to <1.7 g·L−1 to indicate coagulopathy, all the diagnostic laboratory test parameters had low accuracy (<80%), except aPTT, which had a higher accuracy but was still <80%.
Cutoff values, sensitivity, specificity, and accuracy by each test in simulated severe and mild hypofibrinogenemia (a fibrinogen level of <1 and <1.7 g·L−1)
VCT, venous clotting time; 20WBCT, 20-min whole blood clotting time; INR, international normalized ratio; PT, prothrombin time; aPTT, activated partial thromboplastin time.
Discussion
The major mechanism of coagulopathy from a GPV bite is likely from the TLEs of the venom that cause hypofibrinogenemia. We used 1.0 g·L−1 as the cutoff for fibrinogen to indicate severe hypofibrinogenemia because it was used in a previous study on a similar matter. 1 3 In another study, a fibrinogen level of <1.0 g·L−1 was a strong risk factor for death in acutely injured patients requiring a massive transfusion 14 and because clotting problems occurred when fibrinogen was below this level. 15
Ideally, obtaining a fibrinogen level measurement in a timely manner would be the best way to guide physicians to make a decision as to whether antivenom (considered the definitive treatment, but with limited availability) should be prescribed. Only a limited number of large or university hospitals in Thailand are capable of measuring the fibrinogen level. In this study, we attempted to find other widely available diagnostic tests that could be used to accurately detect hypofibrinogenemia, especially in severe cases. Through our experiments, we demonstrated that PT/INR and aPTT had a significant negative correlation coefficient with fibrinogen levels; however, the correlation of PT/INR was higher than that of aPTT. In addition, the AUROCC of PT/INR was larger than that of aPTT (Table 3, Figure 2). These findings support those in a previous study. 13 We conclude that PT/INR could be an effective test to indicate severe hypofibrinogenemia.
Platelet count, however, did not have a significant correlation with the fibrinogen level. As briefly discussed in the introduction, thrombocytopenia is caused by C-type lectins, alboaggregin B and D, which promote platelet aggregation; however, hypofibrinogenemia results from TLEs. 4 These results mirrored our findings in clinical practice that in some GPV bite cases, the only laboratory abnormality was thrombocytopenia, and other laboratory test findings, such as VCT, PT/INR, or even fibrinogen levels, were normal. 16 Because the AUROCC of platelet counts against the fibrinogen level of <1.0 g·L−1 was poor (0.59), when paired with the nonsignificant correlation with the fibrinogen levels, platelet count should not be used as a diagnostic test for hypofibrinogenemia. Instead, we suggest that platelet counts be ordered and interpreted separately from the coagulogram.
The platelet count cutoff value of <150,000 that showed high accuracy for the fibrinogen level of <1.0 g·L−1 (Table 4) should be interpreted cautiously because thrombocytopenia and hypofibrinogenemia develop through 2 different mechanisms as pointed out earlier. Both hypofibrinogenemia (using VCT as a surrogate for clotting abnormality) and thrombocytopenia could occur together, especially in severe cases. Having both abnormalities was a predictor for systemic bleeding in a multivariate analysis; however, isolated hypofibrinogenemia and isolated thrombocytopenia can also occur.5,16
For the cutoff values of other tests (Table 4), a VCT of >15, unclotted 20WBCT, an INR of >1.2, and a PT of >13.4 had high and comparable accuracy of nearly 90%, unlike aPTT that had a much lower accuracy for severe hypofibrinogenemia. These laboratory test parameters had lower accuracy when we changed the reference point of the fibrinogen level from <1.0 g·L−1 to the higher one (<1.7 g·L−1), except aPTT, which had a higher accuracy. All laboratory test parameters had an accuracy of <80%, which was similar to that in the previous study. 13
A high accuracy with a high specificity was reported for VCT and 20WBCT; however, they had a sensitivity of 0%. In this study, 10% (6 of 59) of samples had a fibrinogen level of <1.0 g·L−1; however, VCT and 20WBCT were not sensitive enough to show an abnormality although the specificity was 100% for both. They could be used as confirmation tests, instead of screening tests. However, these are bedside tests that have been criticized regarding their reliability when performed by different operators. 17
In another study conducted in Thailand, PT/INR provided the highest AUROCC for a fibrinogen level of <1.0 g·L−1; however, this study demonstrated, at the cutoff of an INR of >1.2, both high sensitivity at 86% and very high specificity at 96%. 13 However, other studies did not demonstrate such high sensitivity; they found only 26% (INR >1.2), 33% (PT >13.5 s), 18 50% (INR >1.2), 19 and 50% (PT >13 s), 20 to predict a fibrinogen level of <1.0 g·L−1, even though they all had very high specificity at 96, 96, 94, and 100%, respectively. The results of these 3 studies 18 –20 are more similar to the results of this study in that the sensitivity of an INR of >1.2 or a PT of >13.4 is poor; however, the specificity and accuracy are excellent. We found new cutoff values using Youden’s index, and if we adjusted the INR cutoff value from >1.2 to >1.15, the sensitivity, specificity, and accuracy increased to 33, 98, and 92%, respectively. In another study performed on Malayan pit viper bites (the venom of which also has TLEs, causing hypofibrinogenemia), the authors selected an INR of >1.155 to be their best cutoff value to indicate severe hypofibrinogenemia, with a sensitivity and specificity of 79% and 90%, respectively. 21 As a result, we propose using a new INR cutoff value of >1.15, instead of >1.2, to provide better sensitivity, specificity, and accuracy.
From this study, the aPTT should not be used because it had the worst accuracy, with poor specificity and 0% sensitivity, compared with that of other diagnostic test parameters, which were similar to those reported in a previous study, 20 in which sensitivity was also shown to be 0%.
Limitations
This study has limitations. The first limitation is the small sample size, which was further compromised by 21% unreadable samples (16 of 75) in Experiment 2. Second, the study had no individual baseline measure of fibrinogen in Experiment 2 because the normal range of fibrinogen was wide, from 2 to 4 g·L−1 (200–400 mg·dL−1), and the fibrinogen level of the only subject in Experiment 1 was only 2.23 g·L−1 (lower end of the normal range). As a result, the 2 venom doses obtained in Experiment 1 were probably too small to simulate hypofibrinogenemia in Experiment 2, especially for severe cases (6 [10%] of 59 samples). This may affect the sensitivity and specificity of our study. Last, because there are a number of species of GPV and the venom used in this study was only from the pooled venom of T albolabris, sensitivity and specificity of those laboratory test parameters may be different with venoms of other species.
Conclusions
This simulated in vitro study suggests that PT/INR could be used as a diagnostic test for hypofibrinogenemia in T albolabris envenomation because of its high accuracy and AUROCC. We also found that using an INR cutoff value of >1.15, instead of >1.2, improved sensitivity, specificity, and accuracy. Platelet count should be ordered in addition to PT/INR because thrombocytopenia develops through a different mechanism and has no correlation with the fibrinogen level.
Footnotes
Acknowledgements
Author Contributions: Study concept and design (RO); conducting the experiment (GT, SL); data acquisition (GT); data analysis (RO, GT); drafting of the manuscript (GT, RO); critical revision of the manuscript (RO); approval of the final manuscript (RO, GT, SL).
Financial/Material Support: This study was funded by Navamindradhiraj University research funds.
Disclosures: None.