
Abstract
Introduction
To review recent (2008–2015) United States mortality data from deaths caused by nonvenomous and venomous animals and compare with historical data.
Methods
The Centers for Disease Control and Prevention Wide-Ranging Online Data for Epidemiologic Research database was queried to return all animal-related fatalities between 2008 and 2015. Mortality frequencies for animal-related fatalities were calculated using the estimated 2011 United States population. Inclusion criteria included all mortalities that were a consequence of bite, contact, attack, or envenomation (International Classification of Diseases 10th revision codes W53–W59 and X20–X29).
Results
There were 1610 animal-related fatalities, with the majority from nonvenomous animals (2.8 deaths per 10 million persons). The largest proportion of animal-related fatalities was due to “other mammals,” largely composed of horses and cattle. Deaths attributable to
Conclusions
Appropriate education and prevention measures aimed at decreasing injury from animals should be directed at the high-risk groups of agricultural workers and young children with dogs. Public policy and treatment pricing should align to ensure adequate available medication for those at risk of anaphylaxis from stings from
Introduction
Injuries, maiming, and fatalities from animal encounters remain an important public health issue in the United States. Humans can be harmed by animals through bites, stings, strikes, crushing, or contact. These animal-related injuries result in considerable morbidity and financial loss; annually, over 1 million emergency department visits in the United States and an estimated $2 billion have been attributed to untoward animal encounters.1,2 This burden could be lessened through application of prevention methods and sound public policy. The Centers for Disease Control and Prevention (CDC) maintains the Wide-Ranging Online Data for Epidemiologic Research (WONDER) database. 3 WONDER is an online public-access repository of US epidemiological mortality data, using the international classification of diseases (ICD) 10th revision to classify cause of death.
This study is an update of our previous retrospective review of all nonvenomous and venomous animal-related fatalities in the United States. 4
Methods
The CDC WONDER database compiles mortality data including cause of death and other epidemiological factors from death certificates at the county level, exclusive of fetal and nonresident deaths. The WONDER database was queried to return all animal-related fatalities between 2008 and 2015, inclusive. Inclusion criteria included all mortalities from bite, contact, attack, or envenomation (ICD 10 codes W53–W59, X20–X29). The codes for animal attacks resulting in fatalities were divided into those resulting from nonvenomous (W53 [bitten by rat], W54 [bitten or struck by a dog], W55 [bitten or struck by other mammal], W56 [contact with marine animal], W57 [bitten or stung by nonvenomous insect or other nonvertebrate], W58 [bitten or struck by crocodile or alligator], W59 [bitten or crushed by other reptiles]) and from venomous causes (X20 [contact with venomous snakes and lizards], X21 [contact with venomous spiders], X22 [contact with scorpions], X23 [contact with hornets, wasps, and bees], X24 [contact with centipedes and venomous millipedes], X25 [contact with venomous marine animals and plants], X27 [contact with other specified animals], X29 [contact with unspecified venomous animal or plant]), including those due to a chemical released by an animal or insect; release of venom through fangs, hairs, spines, tentacles, and other venom apparatus; venomous bites and stings; and exclusion of ingestion of poisonous animals or plants. Exclusion criteria included animal-related fatalities due to transportation accidents (ICD 10 codes V80.0–V80.9). Fatalities were sorted by type of animal, age, race, sex, and region of the country. Variable definitions have been reported previously. 4
Mortality frequencies were calculated by dividing the total number of deaths, as given by the CDC WONDER database, by the 2011 population estimate.
5
Note that some deaths are suppressed, particularly in geographical location analysis, due to confidentiality constraints and do not display in the corresponding search. Age-adjusted mortality frequencies are reported unless otherwise specified. Fisher exact test was used where appropriate for comparison between groups and
Results
Between 2008 and 2015 inclusive, 1610 people were killed during animal encounters, with a median of 201 deaths annually (range, 186–216 deaths), corresponding to an overall mortality frequency of 4.8 deaths per 10 million persons (Figure 1). Nonvenomous animals were responsible for the bulk of deaths at 924 total, averaging 115 per year (Table 1). Among nonvenomous animals, encounters with “other mammals” and dogs resulted in the majority of deaths, with 72 and 34 deaths per year, respectively. Among venomous animals, encounters with hornets, wasps, and bees resulted in the majority of deaths, with 60 per year. Among the remaining venomous animals, encounters with “other specified venomous arthropods,” venomous spiders, and venomous snakes and lizards resulted in 11, 6, and 6 deaths per year, respectively. More males (n=1,164, 72%) than females died from animal encounters (
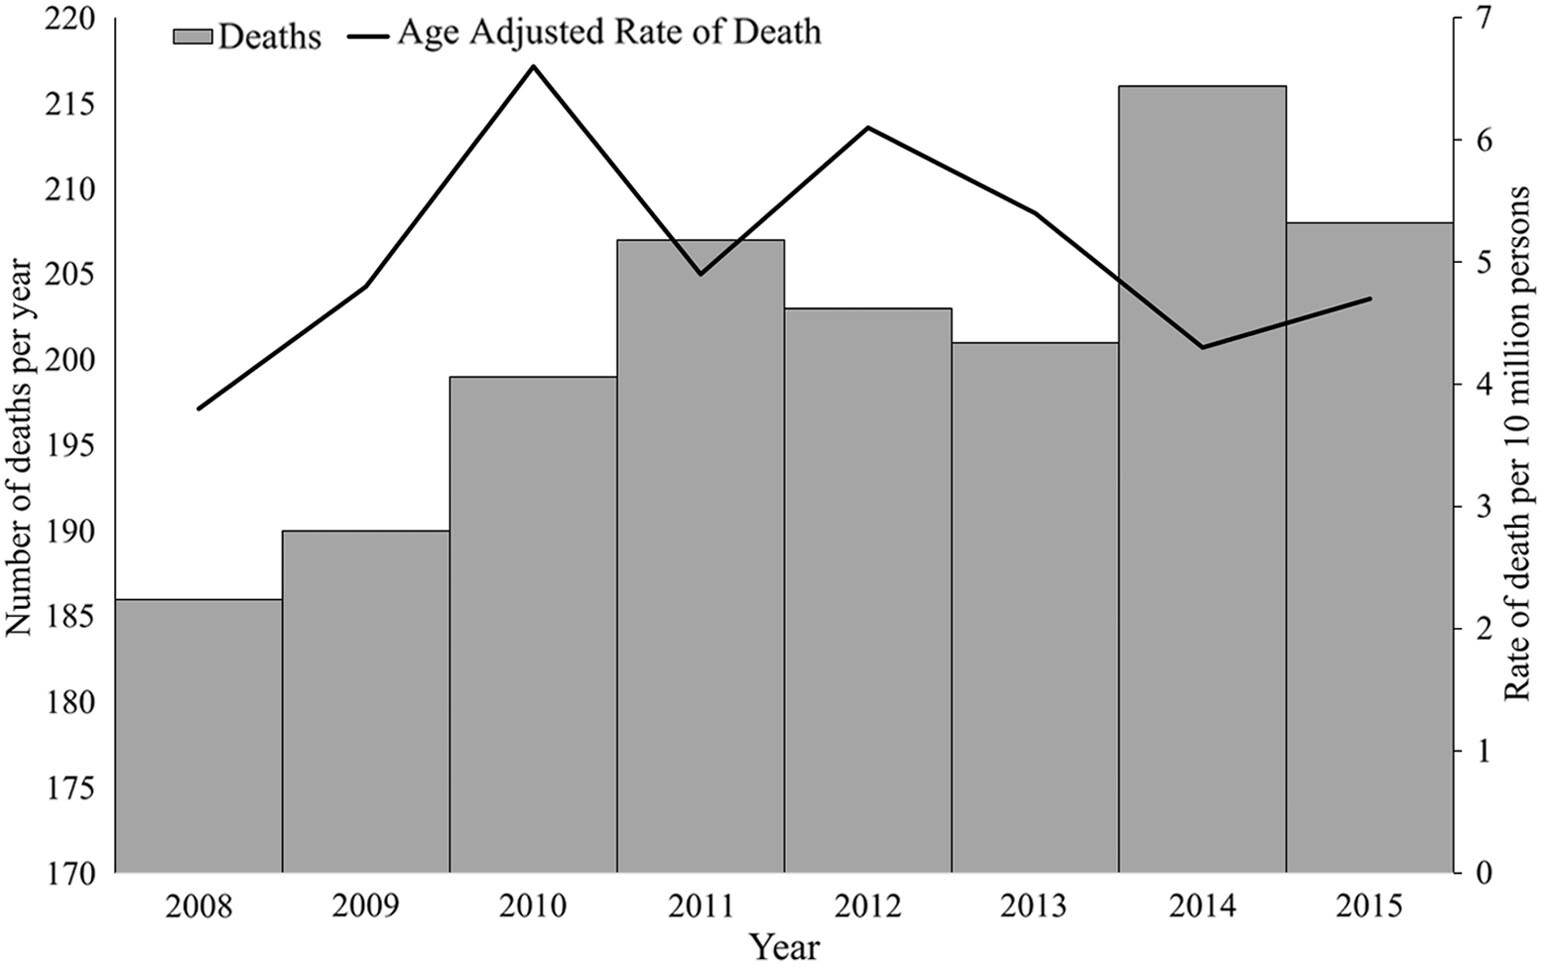
Number and age-adjusted rate of deaths from animal encounters by year—United States, 2008–2015. Age-adjusted rate calculated based on 2011 United States population estimate.
Animals resulting in human death—United States, 2008–2015
Calculated based on 2011 United States population estimate.
Number and rate of deaths from animal encounters by sex and age—United States, 2008–2015
Mortality per 10 million persons (calculated based on 2011 United States population estimate).
Although 813 (50%) persons between 35 and 64 years of age comprised the greatest number of fatalities, those ≥65 years of age had the highest mortality frequency (Table 2). Among the 35- to 64-year age group, 452 (66%) deaths were attributed to venomous animals, with hornets, wasps, and bees accounting for the majority at 328 deaths. However, the mortality frequency of hornets, bees, and wasps was greatest in the ≥65-year age group. The disproportionate number of deaths at the extremes of the age ranges was most pronounced among persons dying as a result of nonvenomous animal encounters. Among persons ≥65 years of age, the mortality frequency of 7.8 deaths per 10 million persons from “other mammals” was nearly an order of magnitude greater than among the other age groups. Similarly, among children 4 years of age or younger, the fatality rate of 4.6 deaths per 10 million persons from dog attacks was nearly 4-fold greater than among the other age groups.
Racial disparities in animal attack fatalities persisted from 2008 to 2015, with whites representing 80% of deaths (n=1281) but American Indian or Alaska Native populations experiencing the largest mortality frequency at 8.5 deaths per 10 million persons (Table 3). The mortality burden experienced by the American Indian or Alaska Native population was pronounced among fatalities from nonvenomous animals, with deaths due to dogs and “other mammals” being more than 1- to 2-fold greater than among the other racial groups. The South continued to report the majority of the deaths in all categories from both venomous and nonvenomous animals (n=786, 49%) (Table 4). Among deaths due to venomous animals, the increased mortality frequency in the South was approximately 3-fold greater than that reported from the other regions.
Number and rate of deaths from animal encounters by race—United States, 2008–2015
Mortality per 10 million persons (calculated based on 2011 United States population estimate).
Number and rate of deaths from animal encounters by region—United States, 2008–2015
Mortality per 10 million persons (calculated based on 2011 United States population estimate). Note: some deaths are suppressed, particularly in geographical location analysis, due to confidentiality constraints and do not display in the corresponding search.
Discussion
Animal-related fatalities remain an important and media-generating public health topic. 6 –10 Public interest cyclically ebbs and flows; however, the impact on human life and the economy as a result of these encounters is substantial. We found a relatively stable frequency of animal-related fatalities; the age-adjusted mortality frequency in our modern series is comparable to the non–age-adjusted rates in prior study periods (6.9 deaths per 10 million in 1999–2007; 6.6 deaths per 10 million in 1991–2001). 11 Despite stable rates, the amount of potentially preventable losses are impressive. The economic burden of animal-related injuries in the United States is estimated at more than $2 billion annually. 1 Furthermore, options are available to help alleviate these preventable fatal animal encounters.
Nonvenomous animals accounted for the majority of animal-related fatalities in our series but, these cases were slightly less frequent compared with our last report (115 annual deaths versus 121 annual deaths). 4 The most common nonvenomous fatal encounter was in the “other mammals” category, which includes cats, horses, cows, other hoof stock, pigs, raccoons, and other mammals. Langley 11 and Langley and Morrow 12 previously reported that the majority of these “other mammals” deaths occur on farms, likely as a result of encounters with farm animals. Previous work has identified that horse and cattle account for over 90% of farm animal–related fatalities. 13 Our series’ demographics of these fatalities related to “other mammals” is consistent with farm operators in those regions: white males in the working class age range of 35 to 64 years or ≥65 years. 14 Agriculture is a potentially hazardous work environment in the United States. In 2011, the highest occupational fatality rate in the United States (24.4 deaths per 100,000 full-time workers) was in the agriculture, forestry and fishing, and hunting sector. 15 Severe injuries and fatalities on the farm can result from these interactions with large animals.
Historically, the South and Midwest are the regions with the largest percentages of farms, 16 which may explain the greater mortality frequencies in these regions. Compared with our previous study, we found a decrease in the proportion of fatalities in the Midwest (to 22% from 32%) with a concomitant increase in the West (to 27% from 21%). 4 California, one of the largest states in the West region, has an increasingly productive dairy and cattle industry, which may increase opportunity for humans exposure to farm animals. 14 Dairy farming, a known dangerous work environment, has the second highest risk for injuries among all US agriculture groups, with the majority occurring with dairy cattle during milking activities. 17 –23
Farming, inclusive of ranching, is a potentially dangerous industry, with 10% of farm workers expected to be affected by injuries.24,25 Preventing potentially fatal farm animal encounters should be a better promoted and supported public health initiative. Small retrospective studies report that injuries are more common in dairy farmers who do not reside at their dairy operations; do not provide safety training to their employees; and have private, individually purchased health insurance. 26 Systematic safety training on proper interaction with these large animals is imperative for decreasing human morbidity. Likewise, with Latino/a individuals representing a growing percentage of the agricultural workforce, occupational safety and health training designed with a contextually relevant understanding is imperative to maximize worker engagement and effectiveness. 27 Farming remains an industry with a deficit of work-related injury reporting, and opportunities exist to improve safety measures and injury reporting on farms in the United States. 14 ,15,28
Dog-related fatalities are the second most common nonvenomous animal cause of human death in 2008 to 2015, with 272 deaths. The average of 34 annual dog-related deaths continues the trend of 28 annual dog-related deaths in our previous report and 19 annually from 1979 to 2005.4,11 Similar to our previous findings, the demographics of those fatally attacked by dogs are unchanged. Children under 4 years of age have the highest dog-related fatality rate, nearly 2-fold higher than the next most vulnerable group of those aged ≥65 years and 4-fold higher than in the other age groups.
Dog-related injuries and fatalities remain a substantial public health concern, with over 4.5 million dog bites annually in the United States resulting in an estimated 310,000 to 323,000 people treated in US emergency departments. 1 ,2,29,30 The financial impact is equally impressive. The average cost of hospital stay due to dog bite was $18,200 in 2008, approximately 50% higher than an average injury-related hospital stay. 31 Likewise, greater than one third of all US homeowners’ liability claim dollars in 2016 (approximately $600 million) were due to dog bites, increasing 73% in average cost per claim from 2003 to 2016. 32
A multipronged approach to decreasing the incidence and impact of dog bites is essential. Education programs targeting those at risk are crucial, and with 48% of US population owning dogs, it is imperative to also engage dog owners. 33 Small numbers of studies have evaluated educational programs designed to improve preschool-aged children’s recognition of dangerous situations; however, all did not examine whether children had learned how to interpret dog behavior. 34 –36 Lakestani and Donaldson reported improvement in dog behavior recognition in this at-risk age group, although ongoing efforts are required to translate recognition into behavior change. 37 Targeting veterinarian professionals to instill a culture of education and training on family safety around dogs is important. 38 Additional options include interventions aimed at owners through dog training exercises and dog behavior recognition training as well as broader dog ownership regulation and rigorous dog and child supervision rules. 39
Venomous animal–related deaths continue to rise; there were 86 annual deaths in 2008 to 2015, continuing the upward trend over the last 60 years (79.5 annual deaths in 1999–2007, 69 annual deaths in 1991–2001, 60 annual deaths in 1979–1990, and 46 annual deaths in 1950–1959).4,11 Hornets, wasps, and bees were the most common venomous animals responsible for animal-related fatalities, with 478 total deaths, averaging 60 deaths per year from 2008 to 2015. Although over a 50-year historical time period, the percentage of deaths due to
Comparison of
Although the death rates and demographics of those affected by
Limitations
There are several limitations to this study. First, as with any study relying on death certificate data, the potential for misclassification of cause of death is possible and is a known limitation of studies using death certificate data. 44 Improving the reporting mechanisms and granularity of the database (eg, including the specific animal responsible within the “other mammals” category) could help generate a more thorough discussion for improving farm safety. Second, in accordance with the data use agreements set forth by the CDC, some regional deaths were suppressed, which could underestimate the mortality frequency associated with certain regions. 3 For example, all deaths due to marine animals were suppressed by geographic location. Specifying the region/state of these deaths due to marine animals could help in determining whether they occurred in captivity or in the wild, generating more specific discussion about prevention. Third, we limited our study to only direct encounters with animals resulting in fatalities. It is likely that only a small number of animal encounters result in fatality, and this study likely substantially underestimates any health care burden associated with untoward animal encounters. Additionally, investigation into and description of transportation collisions with animals, particularly deer in the United States, should be pursued given growing public health concern. Fourth, the mortality frequencies presented are based on small numbers, particularly when compared with the larger population at risk, so the reported frequencies may be unstable and should be taken in the context of the actual number of cases reported.
Conclusion
Encounters with animals through bites, strikes, crushing, or mere contact cause considerable mortality. From 2008 to 2015, there were 1610 animal-related fatalities, with most resulting from nonvenomous animals. Encounters with farm animals and dogs and stings from hornets, wasps, and bees were responsible for the majority of animal-related fatalities. The epidemiology of animal-related fatalities is largely similar to our last report from 1999 to 2007, although treatment interventions have not improved (eg, the current unaffordability of the EpiPen). Prevention and sound public health policies should address the morbidity and mortality resulting from human encounters with animals on the farm, near the home with dogs, and through anaphylactic reactions from
Author Contributions: Study concept and design (JAF, JDF); acquisition of the data (JDF); analysis of the data (JAF, JDF); drafting of the manuscript (JAF, JDF, TGW); critical revision of the manuscript (JAF, JDF, TGW); approval of the final manuscript (JAF, JDF, TGW).
Financial/Material Support: None
Disclosures: None