
Abstract
Objective
To describe rescue events at Hanauma Bay using data collected by lifeguards stationed at the bay.
Methods
Lifeguard collected data documenting estimates of daily beach attendance, and characteristics of rescue victims and events were analyzed for the period 2000 to 2007.
Results
A total of 4888 Logsheets spanning 2000 to 2007 and 1567 Incident Reports spanning 2000 to 2002 and 2006 to 2007 documenting 1249 rescues were available for analyses. Lifeguard estimates of attendance summing tallies made at 12, 2, and 4
Conclusion
Lifeguard estimates of attendance at Hanauma were precise, and summing 12 and 4
Introduction
Water safety measures have proved to be effective in preventing ocean drowning deaths. 1 Understanding environmental and demographic characteristics are important considerations in implementing safety strategies; however, effective means to obtain such data remains a challenge. Here we describe a data collection system utilizing on-duty lifeguards and report findings from an initial analysis of data for a beach in Hawaii.
Hanauma Bay Nature Preserve is a marine conservation district on the southeast coast of Oahu, Hawaii. Because it has been protected as a conservation district since 1967, marine life flourishes, making it a popular destination especially among those looking to snorkel. Hanauma Bay is among the most frequented of the 19 lifeguarded beaches on the island, attracting approximately 3000 visitors per day. 2 Access to the sunken crater which partially encloses the bay is monitored by requiring beachgoers to purchase tickets prior to entry. Estimates of beachgoers on the beach and in the water are tallied 3 times a day by the professional lifeguards who staff 2 lifeguard towers on either end of the beach. Snorkel gear is available for rent from a number of concessions on the beach. Safety signs warning the public of hazardous ocean conditions are routinely posted on the beach.
Compared to the powerful surf at other beaches on Oahu, Hanauma Bay is relatively protected and tranquil. Yet, despite calm waters, it is consistently host to more lifeguard rescues than any other beach on the island. Between 1998 and 2002, Hanauma averaged 285 rescues per year which accounted for 25% of all rescues on Oahu. 3 Adjusting for lifeguard-estimated number of bathers, Hanauma's rescue rate increased 29% during that 5-year period according to D. Galanis, PhD (written communication, April 2009) raising concern among public health officials. Four other beaches on Oahu have rescue rates higher than those at Hanauma, but each is well known for their large surf and dangerous ocean conditions. 3 There were 22 drownings at Hanauma reported between 1993 and 2003, which was the second highest total for any beach in the state. 2
Disconnect between the bay's seemingly calm ocean conditions and its relatively high rescue rate raises questions about what factors contribute to rescues and what can be done to improve safety at the bay. The goal of this study was to identify visitor and environmental characteristics that contribute to ocean water rescues at Hanauma Bay. Understanding safety issues at the bay will help to guide future interventions to improve visitor safety at this and other beaches. To our knowledge, no large scale study of this type has ever analyzed rescues occurring at a particular beach. Data collection and analysis may present a model for future large scale studies of ocean safety.
Methods
We conducted a retrospective study of data collected by lifeguards and from ticket sales at Hanauma Bay, Hawaii. We analyzed data from Logsheet and Incident Report forms completed by on-duty lifeguards stationed in the 2 lifeguard towers servicing Hanauma Bay. All lifeguards at Hanauma Bay are employees of the City and County of Honolulu and receive training on how to complete Logsheets and Incident Reports. Completion of both forms is a mandatory requirement set forth by the City and County of Honolulu. Epidemiologic data from Logsheet and Incident Report forms were obtained from the Hawaii State Department of Health.
Logsheets are filled out daily at each lifeguard tower and serve the purpose of recording attendance of beachgoers who are sunbathing, swimming, and surfing at the bay, with lifeguards instructed to record their best estimates of sunbathers, swimmers, and surfers at 12, 2, and 4
Individual Incident Report forms are completed for any rescue, nonminor first-aid, or resuscitation efforts involving lifeguards. Data from Incident Reports were manually entered into an Epi Info database for the years 2000 to 2002 and 2006 to 2007 by employees of the City and County of Honolulu, and data from these 1567 Incident Reports were analyzed in this study. Though Incident Reports were filled out for the years 2003 through 2005 they were never entered into an electronic database for these 3 years and were not used in our analyses. Incident Reports document demographics, mechanism of injury, type of injury or illness, treatment rendered, and disposition of those requiring lifeguard assistance. Lifeguards used their own judgment to determine if the events they responded to required an Incident Report.
Entry into Hanauma Bay requires purchasing an admission ticket. Ticket sales data for the study period retrieved from the City and County of Honolulu were used to represent actual (as opposed to lifeguard-estimated) attendance at Hanauma Bay. Tickets are sold to local residents, tourists, and the military at 3 different prices, enabling entry to be tracked by those demographic variables.
Statistical analyses were performed using commercially available software (SAS 9.1, SAS Institute, Cary, NC). Correlation coefficients and 95% confidence intervals were calculated to assess for possible relationships between quantitative properties. Rescue rates were calculated using Logsheet values for rescues and lifeguard estimates of bathers. A 2-sided z-test with reported
Results
Hanauma Bay is open to the public 6 days a week (closed Tuesdays). Of a theoretical 4992 Logsheets, 4888 (98%) were available for analysis. Of 1567 Incident Reports available for this study, 1249 documented rescues. The remainder documented nonminor first-aid and resuscitation efforts.
Rescue and Drowning Rates
Characteristics of the rescue population are shown in Table 1. Between 2000 and 2007 there was an average of 7 rescues per 10,000 visitors entering the water at Hanauma Bay. Based on monthly totals, rescues were positively correlated with estimates of bathers with 9.2 rescues occurring per 10,000 bathers (95% CI 6.3–12). As the number of bathers increased, rescue rates remained relatively stable with an increase of only 0.07 rescues/10,000 bathers for every additional 10,000 bathers (95% CI 0.02–0.2). Logsheets documented 14 episodes of drowning during the study period with a drowning rate of 3.5 per 1 million bathers.
Characteristics of visitors to Hanauma Bay requiring lifeguard rescues for years 2000 to 2002 and 2006 to 2007
A disproportionately high percentage of nonresidents required rescues compared to residents for years 2000 to 2002 and 2006 to 2007. While 88% of all visitors to Hanauma Bay were nonresidents (based on ticket sales
Selected Characteristics of Rescues
The majority of rescues at Hanauma Bay occurred at a single location for years 2000 to 2002 and 2006 to 2007. Figure 1 shows a map of Hanauma Bay and where rescues occurred in the bay based on Incident Report data.
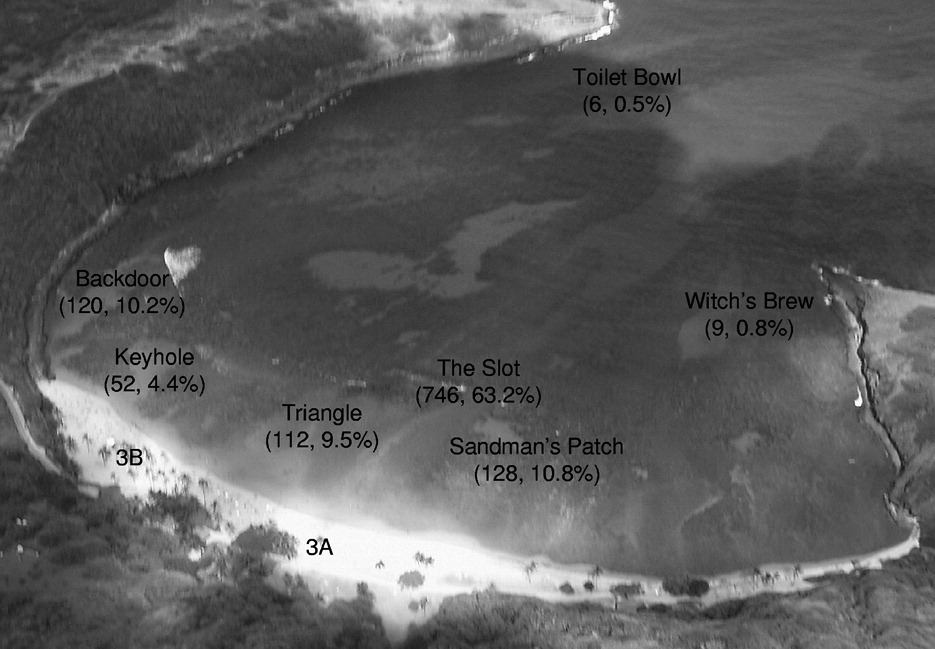
Map of Hanauma Bay labeled with locations of lifeguard towers (3A and 3B) and distribution of reported rescues for years 2000 to 2002 and 2006 to 2007. Rescues made in all other locations,
Lifeguards in tower 3A located on the western side of the bay fronting “The Slot” and “Sandman's Patch” responded to 83% of rescues at the bay. Remaining rescues were made by lifeguards stationed at tower 3B. There was very little overlap in terms of lifeguards from tower 3A responding to rescues in areas fronting tower 3B and vice versa. Lifeguards from tower 3A responded to 70% of rescues at “Triangle” located between the 2 towers, but closer to tower 3A than to tower 3B.
Lifeguards had the option of selecting 1 or more factors contributing to rescues on Incident Report forms. Aggregate totals were calculated for each reason listed as an option on forms (Figure 2).
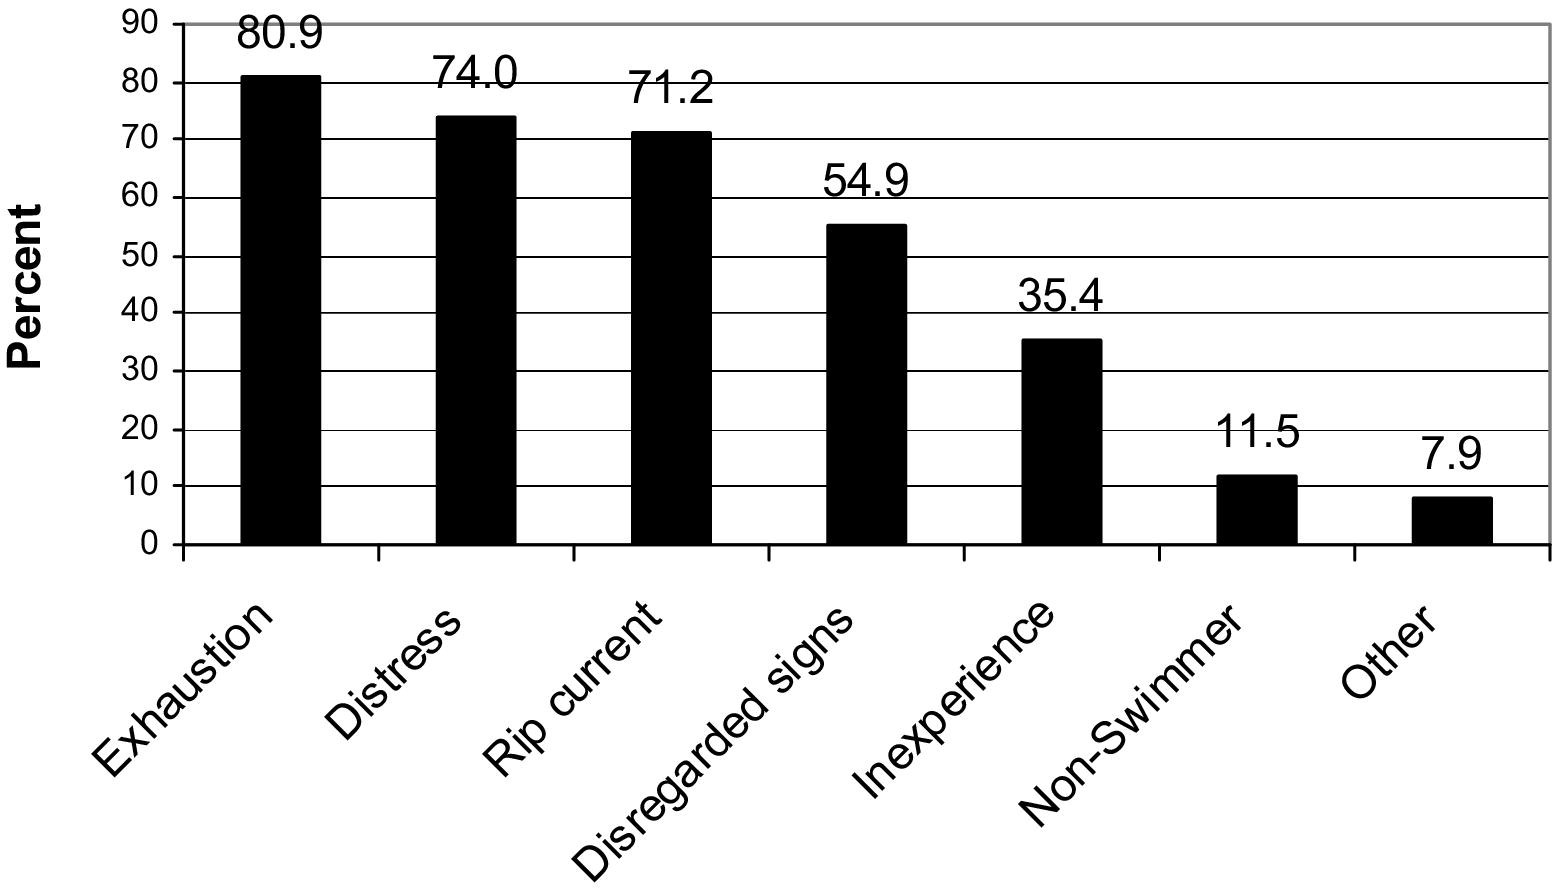
Factors contributing to rescues at Hanauma Bay based on Incident Report forms for years 2000 to 2002 and 2006 to 2007 (
The majority of rescues completed were for a single victim. Rescues for a single victim, 2 victims, and 3 or more victims occurred in 69%, 23.7%, and 7.3% of episodes, respectively, based on Incident Reports.
Trends and Accuracy of Lifeguard Estimates of Attendance
Lifeguard estimated attendance from the sum of 12, 2, and 4
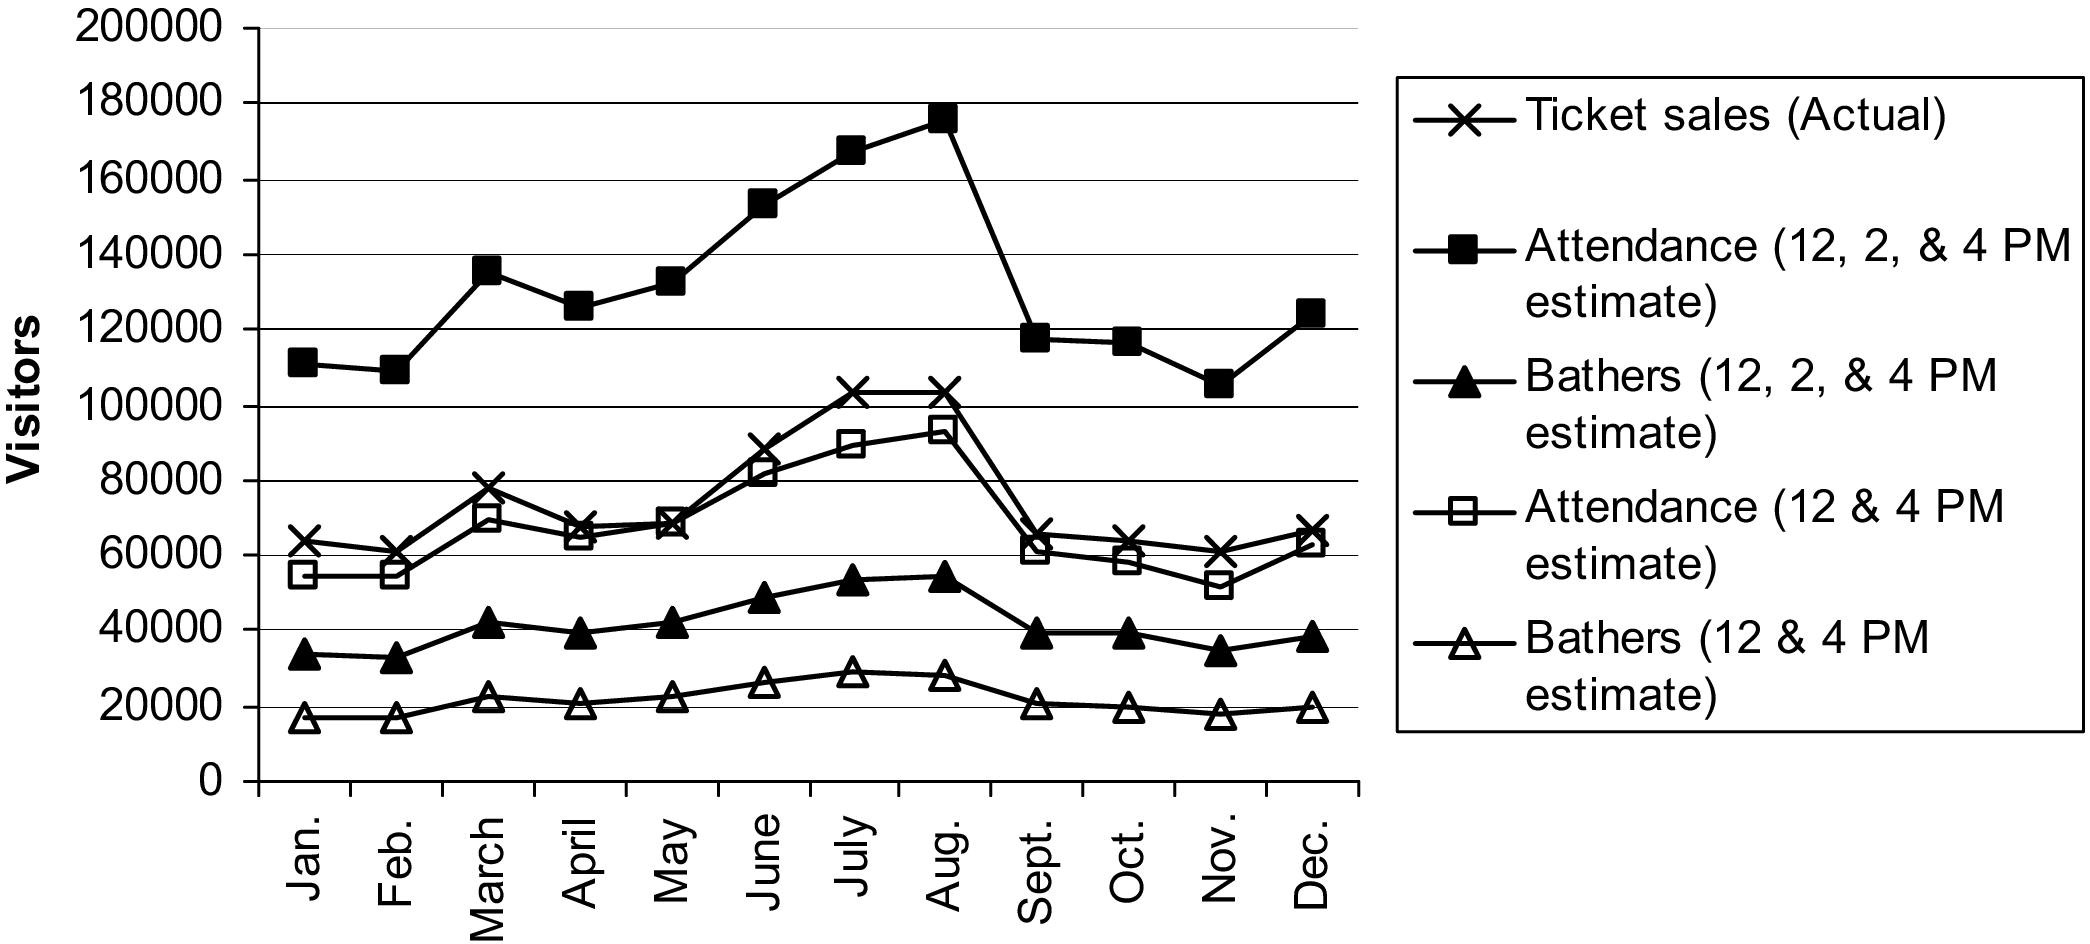
Comparison of lifeguard estimates of attendance and bathers with actual attendance based on ticket sales data averaged by month for years 2000 to 2007 at Hanauma Bay. Lifeguard estimates of attendance and bathers were calculated by summing estimates made at 3 available time points (12, 2, and 4
Selected Causes of Injuries
A number of Incident Reports for 2000 to 2002 and 2006 to 2007 not documenting rescues provided causes for injuries requiring lifeguard assistance (
Disposition Following Rescues
After being rescued, very few victims sought additional medical attention based on Incident Report data for years 2000 to 2002 and 2006 to 2007. Of rescue victims, 91.4% were released to the beach, 5.9% were released to their parents or guardians, 1.4% were transferred to a hospital by EMS, 0.5% were released to seek medical attention on their own, and 0.8% refused all treatment and evaluations.
Discussion
Water safety is a global concern; however, enacting prevention strategies at a specific beach requires an understanding of the unique characteristics of the beach and how they contribute to injuries and adverse events. Data collection remains a huge barrier to large-scale studies of ocean safety and injury prevention. A particular limitation is being able to precisely measure the population of bathers at risk, which is integral to identifying risk factors and accurately determining their contribution to adverse events. 4 It is unusual to have a database similar to the one we analyzed with data that span many years, includes means to calculate event rates based on estimates of those at risk, and offers details about subjects and the event in which they were involved in.
In this initial analysis, we demonstrated how ocean safety data collected by lifeguards can be utilized to characterize safety events and provide estimates of numbers of beachgoers and bathers for calculating and monitoring event rates. Summing lifeguard tallies from 12 and 4
In all cases, lifeguards captured trends in data for actual attendance values. Strong correlation with actual attendance values may make it possible to further correct for and increase the accuracy of estimates. Beach surveillance should be the number one priority for lifeguard, 1 and it has been previously reported that data collection attempts by lifeguards can be limited by their water safety duties. 5 Here we show that lifeguards can be utilized to provide precise estimates of beach attendance.
Multiple case studies provide evidence that lifeguards prevent drowning deaths and injuries. 1 However, how to appropriately employ and maximize often limited resources remains a central concern in water safety. Objective data are vital to both guiding interventions and determining their success. Bather estimates offer a useful measure to gauge the effectiveness of efforts through the calculation of rescue rates. Large variance in rescue rates over a short period of time could prompt public safety concern and a reevaluation of safety strategies. Although lifeguard estimates of bathers showed a strong correlation with actual attendance, we could not evaluate the accuracy of estimates and this remains an area for further study.
Nonresidents make up a majority of the population at Hanauma Bay and were found to constitute a disproportionately high percentage of the rescue population. In 2002 there were 12 drownings at Hanauma, and all victims were tourists. 6 The problem is not limited to Hanauma. A retrospective study of patients admitted to Hawaii's only trauma center found that nonresidents accounted for a disproportionately high percentage of water-related traumas. 7 Possible explanations include inexperience with ocean swimming and currents, inexperience snorkeling, or an “on-vacation” mentality that promotes risky behavior. Lifeguards cited disregard of warning signs and inexperience as factors frequently contributing to rescues. Effective means of educating the public about the risks of partaking in ocean activities remains a challenge and area for further research. Importance must be placed on identifying high risk groups and implementing ocean safety strategies tailored toward these groups.
Importantly, a vast majority of rescues were found to occur at a single location within the bay called “The Slot.” Strong currents in the area likely contribute to rescues and present hazards for both novice and advanced swimmers. The top 3 reasons cited for rescues describe the likely scenario occurring at “The Slot,” including visitors getting caught in currents subsequently becoming exhausted and showing signs of distress. Strategies to decrease rescues in this area include visitor education and instituting new policies limiting access to the area. A floating guard tower placed in the bay has also been proposed in the past. 6
Missing data and lack of control groups were limitations of this study. Missing data were likely a function of lifeguards not completing forms in combination with losses during the data transfer process to electronic files. Missing data especially for Incident Reports created difficulties in the retrospective design. Years for which Incident Reports were not available were a result of limited workforce available to transfer information from completed forms to computer databases. In comparison, incompletely filled out Incident Reports were a function of lifeguards and either their limited experience in filling out the forms or, more likely, limited time available given competing responsibilities. 5 Increasing available forms for analysis and ensuring their completeness represent future steps in this study. In addition, collection of data for controls would be meaningful in comparisons with rescue victim characteristics. Although findings are not largely generalizable due to the specific visitor population and environmental conditions specific to Hanauma Bay, results demonstrate a process by which data collection can be completed and used to address ocean safety concerns.
Footnotes
Acknowledgments
The authors acknowledge Dan Galanis, PhD, and Edward Feller, MD, for their guidance and thoughtful review of this manuscript.