
Abstract
Point-of-care (POC) meters that determine whole blood triglyceride (TG) concentrations are used in human medicine to monitor both fasting and post-prandial TG concentrations. The aim of this study was to evaluate their performance for determining feline TG concentrations. A total of 116 venous blood samples were collected from 55 cats. TG concentrations were measured in whole blood using two meters: the Accutrend glucose cholesterol triglyceride (GCT) (GCT: Roche Diagnostics) and PTS CardioChek (PTS – Polymer Technology Systems), and results compared to those determined by a National Association of Testing Authorities (NATA) accredited veterinary laboratory. The GCT was not suitable for use in cats with normal TG concentrations (<0.9 mmol/l), as it overestimated almost 80% of the values; however, this device performed better with TG concentrations between 0.9 and 2.0 mmol/l. The PTS meter performed well in cats with normal TG concentrations, correctly classifying 90% of values as ‘normal’, and fairly well with TG concentrations <2.0 mmol/l. The PTS meter could be used to determine whether cats have normal fasting TG concentrations or predict mild elevations in serum TG, whereas the GCT meter can only be used to predict cats with elevated TG concentrations. Although both meters have limitations in determining some TG concentrations, the PTS in particular, could be used as a screening tool to distinguish normal cats to those with hypertriglyceridaemia.
The prevalence of obesity and type 2 diabetes mellitus in people is increasing. The prevalence of type 2 diabetes has more than doubled in Australia since 1981, 1 and it is predicted that almost 75% of adults in Australia will be overweight by 2010, if current trends continue. 2 As both these conditions are known to cause hypertriglyceridaemia, monitoring of fasting and post-prandial serum triglyceride (TG) concentrations is now performed more routinely. In cats, it has been demonstrated that obesity is a known risk factor for the development of diabetes mellitus 3 and that the prevalence of obesity 4 and diabetes 3 is following a similar trend to that shown in people. However, despite both conditions being known causes of hypertriglyceridaemia, 5,6 serum TG concentrations are not routinely monitored. If fasting hypertriglyceridaemia can be detected in cats, early intervention such as weight loss or dietary change may prevent the development of diabetes.
Serum TG concentrations are also commonly measured in people to identify the ‘metabolic syndrome’ which encompasses a combination of insulin resistance, hypertension, central obesity and dyslipidaemia. People with this syndrome usually have elevated TG (mainly contained within very low density lipoproteins [VLDL]) and reduced high density lipoprotein cholesterol (HDL-c) concentrations. Although the metabolic syndrome has not been described in cats, recent studies have indicated that obese cats develop similar lipid and lipoprotein changes to obese people. 7
Point-of-care (POC) TG testing has only been validated in people 8–12 and more recently in dogs. 13 The use of hand-held devices to monitor TG concentrations have been shown to improve the outcome of hypertriglyceridaemic patients. 14 Cats which may benefit from regular monitoring of TG concentrations include those with inherited hyperchylomicronaemia, 15 diabetes mellitus, 6 obesity 5,7 those receiving liposomal or lipid-complex preparations of intravenous amphotericin or after administration of total parenteral nutrition. The use of TG meters requires smaller volumes of blood to be collected to monitor TG concentrations in either a clinical or research setting. Serum TG concentration is not often included in Australian laboratories as part of a general health screen, nor in ‘general health profiles’ used by in-house analysers in veterinary practice. Therefore, the purpose of this study was to evaluate the performance of two POC TG meters for use in cats.
Materials and methods
Cats
Fasting and post-prandial blood samples were collected over a 10-month period from healthy client-owned and cattery-owned cats. These included 23 female (12 entire, 11 de-sexed) and 32 male cats (10 entire, 22 de-sexed). Ages ranged from 12 weeks to 13 years (4.56±2.98 years). The majority of samples were collected as part of another study, 16 therefore, approximately half were from Burmese cats. Fasting samples were collected after withholding food for 14–16 h; post-prandial samples were collected 2–8 h after eating. A total of 55 cats participated in this study, although 116 blood samples were collected as more than one was collected from each cat. All study procedures were approved by The University of Sydney Animal Ethics Committee.
Blood collection
Blood was collected from the external jugular or cephalic vein using a 3 ml syringe attached to either a 23 gauge needle or 23 gauge ‘butterfly’ needle. A drop of blood was placed on each TG test strip and the remaining blood was either placed in a plain serum clot tube, or for samples to be utilised for within-run precision, into an ethylene-diamine-tetra-acetic acid (EDTA) tube as well. Blood was centrifuged for 10 min at 2500×g, serum or plasma was separated within 1 h of collection. Serum/plasma was then transported on ice to the reference laboratory, and TG concentrations were determined, usually within 6 h of collection.
Analytical methods
A summary of the features for both the Accutrend GCT (GCT) (Roche Diagnostics GmbH, Mannheim, Germany) and PTS CardioChek (PTS – Polymer Technology Systems, IN, USA) meters are presented in Table 1. Both meters have their own specific test strips. Once blood is applied evenly to the ‘test area’, the back of this area should change colour. The reaction principle of the test strip is as follows: the TGs undergo lipolysis by the lipoprotein lipase incorporated into the test strip, to produce glycerol and fatty acids. The glycerol is phosphorylated by glycerol kinase to produce glycerol phosphate, which is then oxidised by glycerol-phosphate oxidase (GPO) to form dihydroxyacetone phosphate. The presence of oxygen leads to the formation of hydrogen peroxide, which reacts with aminophenazone and chlorophenol under the catalytic action of peroxidase, to form a blue-grey oxidation product. The colour intensity is measured by reflectance photometry.
Comparison of features of the POC TG meters.
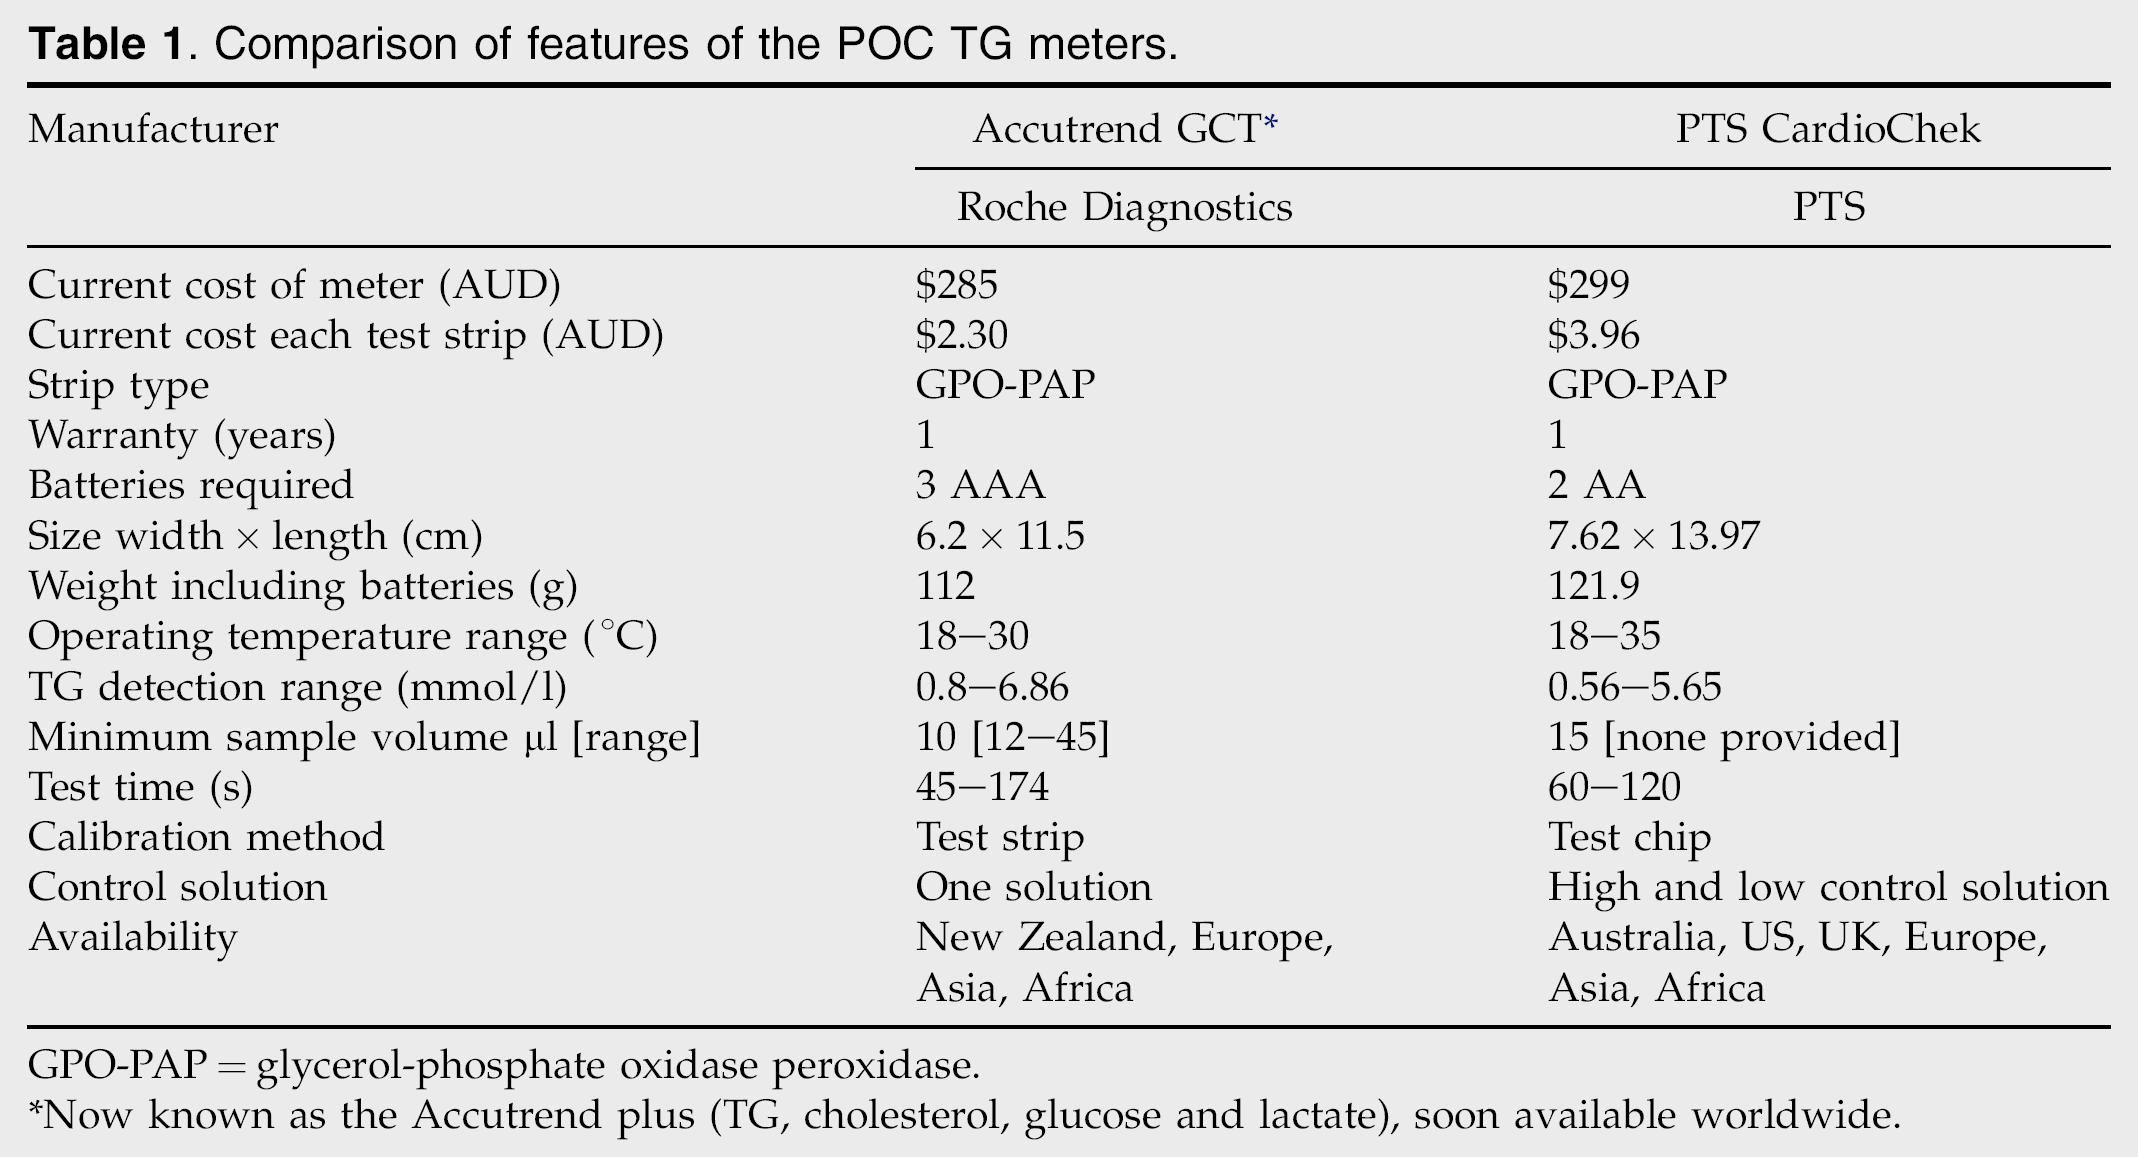
GPO-PAP=glycerol-phosphate oxidase peroxidase.
Now known as the Accutrend plus (TG, cholesterol, glucose and lactate), soon available worldwide.
The measurable TG concentration ranges were 0.80–6.86 mmol/l and 0.56–5.65 mmol/l for the GCT and PTS meters, respectively. Outside these reference ranges, the GCT would display either ‘LO’ or ‘HI’, and the PTS displayed ‘<0.56’ or ‘>5.65’.
TG concentrations were also determined in serum by a NATA accredited veterinary laboratory using the GPO-PAP test kit (Roche Diagnostics GmbH, Mannheim, Germany). Precision and traceability for the reference methodology were standardised against the isotope dilution mass spectrometry (ID-MS) method. Detection limits for the reference laboratory were 0.05–11.3 mmol/l. Within-run and between-run precision were performed on pooled serum by the reference laboratory, and results are shown in Tables 2 and 3. Serum TG concentrations were compared to concentrations obtained by each meter.
Between-run precision on 10 consecutive days of both meters and the reference laboratory using pooled feline serum, as well as the recommended control solutions.

Precision
Between-run precision
Two groups of pooled feline serum with known normal and mildly elevated TG concentrations were frozen at −80°C and stored in 10 small aliquots. Stored serum was thawed and applied to both meters on 10 consecutive days to determine between-run precision. Freezing at this temperature has minimal effect on TG concentration. 17
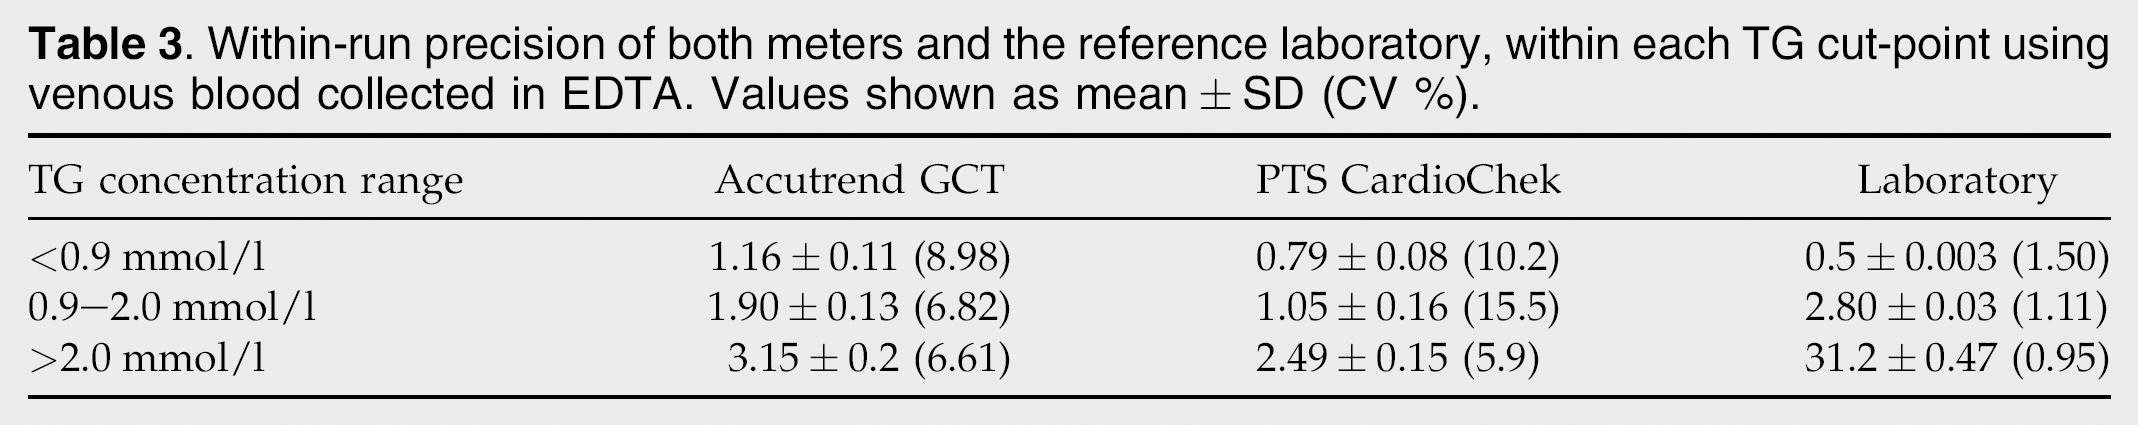
Within-run precision
Six repeat measurements of whole blood, with either a TG concentration<0.9 mmol/l, 0.9–2.0 mmol/l or TG concentration>2.0 mmol/l, were performed using each meter for two cats in each TG concentration range. Ranges (0.9 mmol/l–2.0 mmol/l) were based on clinical cut-points established by NATA, and used for clinical performance by the reference laboratory.
Quality control solutions were used to check the calibration of each meter every 2 weeks and on the commencement of a new batch of test strips; the GCT has one control solution, the PTS has two.
Interference
The haematocrit of 74 cat samples were determined using blood collected in EDTA. Differences in TG concentration between the meters and laboratory were compared by grouping haematocrit values into those above and below 40%.
Statistical analysis
Statistical analyses were performed with MedCalc software package (Broekstraat 52, Belgium) and GraphPad Prism (GraphPad Software Inc, CA, USA), unless otherwise stated. Results are expressed as mean±SD. Values of P≤0.05 were considered significant.
Mean±standard deviation (SD) and coefficient of variation (CV) were calculated for each meter and the laboratory to assess between-run and within-run precision.
Agreement between the laboratory and each meter was measured using the Bland–Altman approach. 18 Mean difference (bias) represented the systematic error between two methods, and lower and upper 95% limits of agreement (LOA) were calculated as bias±2SD. The 95% LOAs were also estimated after loge transformation of data due to non-normal distribution of TG concentration, and were back transformed to the original scale for interpretation. 19 In addition to Bland–Altman plots, Lin's concordance correlation coefficients (CCC) were calculated and used as a measure of agreement. 20 The CCC evaluates the distribution of data around the 45° line through the origin (the line of perfect agreement) if measurements obtained from two meters are plotted on x- and y-axis, respectively. CCC thus evaluates both the scatter of observations around the fitted line and deviation of the fitted line from the line of perfect agreement. The CCC ranges from −1 to 1. A value of CCC>0.90 was therefore interpreted as excellent agreement between both methods. 20
Regression analysis was also used alongside the Bland–Altman plot to assess the data.
The laboratory measured across all TG concentrations. The meters were only able to measure between 0.80–6.86 mmol/l (GCT) and 0.56–5.65 mmol/l (PTS). Some results above and below these TG ranges were excluded from Bland–Altman, CCC, receiver operator characteristic (ROC) and linear mixed model statistical analyses.
Laboratory results were placed in ascending order and categorised according to cut-points determined by the NATA reference laboratory; TG<0.9 mmol/l, TG 0.9–2.0 mmol/l and TG>2.0 mmol/l. Numbers of samples in each TG range were tabulated and compared using weighted kappa values. This determined the ability of meters to correctly classify cats into specific TG ranges. 21 The 95% LOAs were also determined at the two cut-points (0.9 and 2.0 mmol/l).
The diagnostic performance of both meters was also evaluated using ROC curve analyses. Laboratory TG concentrations were classified as normal or elevated based on a cut-off of 1.0 mmol/l. Sensitivity and specificity of both meters was determined at a number of cut-off concentrations and an optimal cut-off concentration yielding maximum sensitivity and specificity (based on Youden's index 22 ) was finally selected.
The effect of haematocrit the meters' and laboratory's TG concentration determinations was evaluated by fitting a linear mixed model with anticoagulants as a fixed effect and ‘animal’ as a random effect. Additionally, two categorical groups were formed (≤40% and ≥40%) in order to evaluate the effect of low and high haematocrit values on agreement between meters and the laboratory. These statistical analyses were conducted using GenStat software (VSN International, UK).
Results
A total of 116 blood samples were analysed from 55 cats. Of the samples sent to the laboratory, 48 were within the normal reference range (<0.9 mmol/l), 35 were between 0.9 and 2.0 mmol/l and 33 were above 2.0 mmol/l. Of the 48 normal values, 37 and 31 TG determinations were below the capabilities of the GCT and PTS meters, respectively. Of the 33 TG values above 2.0 mmol/l, nine were above the reading capabilities of the GCT and 12 were above the PTS. A total of 13 samples from the GCT (five ‘LO’ and eight ‘HI’) and 25 from the PTS (12 ‘<0.57’ and 13 ‘>5.65’) were therefore excluded from the Bland–Altman and CCC analyses as non-numerical data. Non-numerical meter readings were still included for the calculation of the weighted kappa statistic.
Between-run and within-run precision
Between-run and within-run precision for both meters are shown in Tables 2 and 3, respectively. The between-run precision was better for the GCT than the PTS, with the CV being <5% for samples with normal TG concentrations. The PTS had poor between-run precision, as the CV for each TG concentration was above 10%. The GCT had better within-run precision compared to the PTS for samples with normal and mildly elevated TG concentrations. The CV for between-run and within-run precision at the reference laboratory were well below the recommended 5%. 23
Agreement
Results of the Bland–Altman analysis using original and log-transformed data are shown in Fig. 1. Due to the large numbers of samples collected in the lower TG range, the overall mean difference for the GCT was larger and more positive than that for the PTS meter (0.21 and −0.12 mmol/l, respectively), as the GCT overestimated the TG concentration for the majority of samples (mean differences are shown in Fig. 1 and Table 4). Exponentiation of 95% LOAs calculated on the log scale demonstrated that PTS measurements were between 0.45 and 2.31 times the reference laboratory measurements for 95% of cases. In comparison, measurements were between 0.54 and 3.19 times the reference laboratory for the GCT.
Within-run precision of both meters and the reference laboratory, within each TG cut-point using venous blood collected in EDTA. Values shown as mean±SD (CV %).
Mean TG concentration, number and percent correct readings within each TG category, concordance coefficient, regression and Bland–Altman analysis, comparing venous blood on the Accutrend GCT and PTS CardioChek, with serum concentrations determined by the laboratory.

CI=confidence interval.
Bland–Altman analysis.

Scatterplots (A, D) and Bland–Altman plots (B, E) of serum TG concentrations, comparing both meters with the laboratory (Lab). Bland–Altman plots using original data with back-transformed LOA's are shown in (C) and (F). Mean difference for (B) and (E) are presented in Table 4.
Results using the original scale with back-transformed LOA's are shown in Fig. 1 (C and F). At the first TG cut-point (0.9 mmol/l), the 95% LOAs were wider for the GCT (−0.82, 0.82 mmol/l) compared to the PTS (−0.64, 0.64 mmol/l). At the second TG cut-point (2.0 mmol/l), the 95% LOAs were narrower for the GCT (−1.56, 1.56 mmol/l) compared to the PTS (−1.60, 1.60 mmol/l).
Overall Lin's concordance was excellent for the PTS meter (0.92), although it fell slightly below the 0.90 cut-off for the GCT (0.87). Overall regression was 0.87 and 0.88 for the PTS and GCT meters, respectively.
Percentage of correctly categorised results
The number and percentage of correct readings for each meter in relation to the laboratory for each specified TG cut-point is shown in Table 4. The PTS meter was best at categorising cats with TG concentrations below 0.9 mmol/l. In contrast, the GCT was inadequate in this TG range, only correctly classifying 23% of cases, although this meter performed well at categorising cats with TG concentrations over 0.9 mmol/l. Overall weighted kappa values were 0.52 for the GCT and 0.81 for the PTS; values of 0.81–1.00 show almost perfect measure of true agreement across categorical data, whereas values whereas values of 0.41–0.60 only have a moderate measure of true agreement. 21
The area under the ROC curve to distinguish between normal cats and those with elevated TG concentrations was excellent for both meters (0.973 GCT; 0.974 PTS). The PTS meter had a high sensitivity (0.96) and specificity (0.86) at the maximal Youden's index at a TG cut-point of 0.86 mmol/l, whereas the GCT had maximal sensitivity (0.95) and specificity (0.91) at a much higher TG cut-point of 1.34 mmol/l.
Effect of haematocrit
The mean haematocrit of the 75 samples tested was 38%. Agreement between the meters and laboratory measured by difference in TG concentration, was not significantly different when including haematocrit values as a quantitative variable (P=0.9 GCT; P=0.9 PTS) or as a categorical variable (P=0.3 GCT; P=0.4 PTS). For low and high haematocrit values, the mean difference between the laboratory and GCT TG concentrations were −0.21 and −0.05 mmol/l, respectively, and 0.039 and 0.21 mmol/l, respectively, between the laboratory and PTS.
Discussion
Overweight or diabetic human patients may have normal fasting TG concentrations but can demonstrate delayed post-prandial TG clearance. 24 Elevated post-prandial TG concentrations in people are also known to contribute to the development of atherosclerosis and cardiovascular disease. 25,26 Due to increasing awareness of this association, portable devices to measure blood TG are commonly used to measure diurnal TG concentrations, to determine risk of development of disease. 27 Although cats do not develop atherosclerosis, conditions such as diabetes mellitus 6 and obesity 5 are known to cause hypertriglyceridaemia in this species. As obese cats are more likely to be insulin resistant, 5 this in turn can lead to the development of diabetes mellitus. Studies have also shown post-prandial TG concentrations in cats are as important as those in the fasting state, 16 although it remains unclear whether cats with insulin resistance, like people, develop delayed TG clearance.
This study aimed to evaluate the use of POC devices for measuring fasting and post-prandial TG concentrations in cats. Although the TG meters used in this study were designed for people, both gave a good indication of TG concentrations above 1.0 mmol/l, and could be used to detect clinically important hypertriglyceridaemia. The PTS meter provided more accurate TG determinations in the normal reference range, and would be useful to assess fasting TG concentrations in cats. In contrast, the GCT meter was inaccurate at measuring normal TG concentrations, correctly categorising cats as ‘normal’ only 23% of the time. The GCT was more accurate than the PTS for abnormal TG concentrations, making it more suitable for determining hypertriglyceridaemia in cats. Both meters would be most appropriate to be used as a screening tool, rather than determining an accurate TG concentration. Across all TG concentration ranges, the PTS outperformed the GCT in its measure of true agreement.
The upper limit of normality for fasting TG concentrations in people (<2.2 mmol/l) 28 is much higher than in cats (<0.8 mmol/l). 16 Most TG concentrations in normal cats fall below the lower reading capability of each meter. Yet, the PTS meter was still able to correctly categorise 90% of cats with normal TG concentrations. The GCT performed poorly at these TG concentrations, correctly classifying only 23% of cats.
Glucometer studies comparing the use of capillary blood to venous blood have been performed in cats, showing venous blood glucose was significantly higher than in capillary blood, but only in diabetic patients. 29 Studies in people have also shown venous blood may produce higher TG readings compared to capillary blood due to a dilutional effect from lymph. 30 Both the GCT and PTS meters are designed to be used with capillary blood, however, venous blood can also be used. Although comparisons between capillary and venous measurements were not performed in this study, we demonstrated that measurements in whole venous blood were fairly well correlated with serum TG concentration as determined by the laboratory.
Differences in haematocrit did not appear to affect either meters' ability to predict TG concentrations. Interference studies in humans using both TG meters have shown elevated haematocrits above 50% (PTS: PTS Panels Triglyceride test strips – package insert) and 55% (GCT Accutrend GCT Triglycerides test strips – package insert) may lead to falsely lowered TG concentrations. The normal haematocrit reference range in cats is approximately 30–48%, and in this study, there were no cats with levels above this reference range. Further studies are required to determine whether anaemic cats or those with haematocrits above 50%, interfere with measurements of blood TG.
Most glucometers require 3–5 μl of blood only, 31 hence blood glucose curves in cats can be easily performed using an insulin syringe (and 30 gauge needle) to minimise blood volume required per sample. The minimum blood volume recommended for both meters is 10 μl and 15 μl for the GCT and PTS, respectively. As shown in a previous study, 13 more than one drop of blood from an insulin syringe is required for both meters to avoid invalid results. It is still possible to conduct TG curves in cats, however, two drops of blood from an insulin syringe must be applied to each test strip.
Intra-individual variation in TG concentration is due to biological variation, largely due to factors such as analytical imprecision (instrument and method used), diurnal variation and collection variables (anticoagulant, specimen storage, venous or capillary sampling). 32 Although values have not been published for cats, people can have intra-individual variations in TG concentrations of up to 23%. 33 The recommended total error in TG when comparing two methods should be ≤15%, and the analytical CV should be ≤±5% (accuracy) and ≤5% (precision). 32 The within-run precision for the GCT in this study almost reached the 5% target for mild and moderate TG ranges. The PTS had a 5.9% CV for the moderate TG range, however the CV for the normal and mild TG ranges was much higher (10.2% and 15.5%, respectively). The between-run precision in feline serum only reached the 5% target in samples with normal TG concentrations tested on the GCT meter. The PTS had poor between-run precision, with CV above 10% for both samples with normal and mildly elevated TG concentrations. Given that the CVs do not meet the National Cholesterol Education Program (NCEP) guidelines, these meters may not be suitable for the accurate diagnosis of TG concentrations in cats. Therefore, at this stage they can only be considered as a screening tool.
Although patient numbers are small, this preliminary study still provides useful information on the use of two POC TG meters in cats. As cats have a much lower normal fasting TG reference range than people, many results fell below the reading capabilities of both meters, unfortunately reducing numbers. This seems to not be a problem for the PTS meter, which displays a ‘LO’ reading, however, the GCT consistently produces erroneously high TG results. This has the potential to lead to many false-positive diagnoses. Both machines were easy to use and only required a small volume of blood, typically two drops of blood from a 30 gauge needle and insulin syringe. Both meters are not as helpful to predict TG concentrations (unlike glucometers, which more accurately predict blood glucose concentration), however, they do provide some use in screening normal cats (PTS meter) and also give an indication of elevated TG concentration (both the PTS and GCT meters). The PTS meter may also be of use where a rapid screening test for TG concentration is required, for example, during lipid infusions, or in field situations where chemical analysers are not available. Serum turbidity/lipaemia and subsequent hypertriglyceridaemia are difficult to assess visually in small blood volumes, therefore both meters would be useful to distinguish cats with elevated TG concentrations. Further studies with a larger number of cats could assess why the GCT meter was not able to accurately read low TG concentrations, and whether this may be a factor associated specifically with feline blood samples.
Conflict of interest
Both TG meters and accessories were slightly discounted as they were being used for research purposes only, however, there was no financial arrangement with either company, and neither TG meter is promoted over the other. A co-author, Dr David Snow, manages the veterinary division of Symbion Laboratory, but was not involved in the processing of any study samples or interpretation of the resultant data. This study was financially supported in full by the Waltham Foundation, UK, which is fully independent of any pharmaceutical, laboratory or pathology organisation.
Footnotes
Acknowledgements
This study was financially supported by the Waltham Foundation, UK. Thanks to Brian McEwen and Sherri Woodcock of Roche Diagnostics, Auckland, New Zealand, for providing the GCT meter and accessories at reduced cost. Thanks also to Carolyn Waite and Barbara Deed of the Heart Shop, Adelaide, Australia for providing the PTS meter and accessories at reduced cost. Thanks to all veterinarians and clients that participated. Professor Richard Malik was supported by the Valentine Charlton Bequest.