
Abstract
To elucidate the impact of dietary influence on carbohydrate and lipid metabolism and on the development of diabetes mellitus in the carnivorous cat, a 3 weeks feeding trial was carried out on six sexually intact and six neutered adult male cats. The effects of two isonitrogenic diets, differing in carbohydrate and fat content, were investigated on plasma metabolite levels in a 24-h blood sampling trial. Plasma leptin concentrations were also determined at the beginning and at the end of the 24-h trial. Glucose and insulin response was measured in an iv glucose tolerance test. A 5 days long digestion trial was also performed, which revealed a high digestion capacity of both fat and carbohydrates in cats. The high fat diet induced a significant rise in the plasma triglyceride, FFA, β-hydroxybutyrate and cholesterol concentration, while the elevation in the glucose level did not reach significance. In the glucose tolerance test no significant difference was found between the neutered and intact cats. However, independently of the sexual state, the cats on the high fat diet showed a slightly elongated glucose clearance and reduced acute insulin response to glucose administration. This is indicative of diminished pancreatic insulin secretion and/or β-cell responsiveness to glucose. The results of this preliminary study may be the impetus for a long-term study to find out whether it is rather the fat rich ration than carbohydrate rich diet that is expected to impair glucose tolerance and thus might contribute to the development of diabetes mellitus in cats. Whether the alteration in glucose metabolism is due to altered leptin levels remains to be determined.
Introduction
The cat during its evolutionary development has tightly adapted to a diet high in protein (∼54% of DM) and low in carbohydrates (∼8% of DM) (Scott, 1981), with its natural diet consisting of food of animal origin only (Lindemann, 1953; Röhrs, 1987). This adaptation is well reflected by its unique metabolism of nutrients, which makes the cat a true and strict carnivore.
When compared to the omnivorous dog, cats have lower activities of carbohydrate digestive enzymes in the gastrointestinal tract (Kienzle, 1993a, c), slower glucose incorporation rate into glycogen (Ballard, 1965) and elongated glucose elimination time in the glucose tolerance test (Kienzle, 1989). These facts imply that the cat as a carnivorous animal is not well adapted to readily metabolize large glucose loads. On a typical carnivorous diet, which is low in carbohydrates, the feline liver is able to provide sufficient amounts of glucose to fuel the glucose dependent tissues of the body (Ballard, 1965). The high protein content of the diet supplies the steadily high active gluconeogenic pathways with a continuous source of substrates (Rogers et al., 1977). On the basis of all these facts, no dietary requirement for carbohydrates was established for cats (MacDonald et al., 1984). On the other hand commercial cat foods often contain considerable amounts of carbohydrates, mainly as starch (De Wilde and D'Heer, 1982; Morris et al., 1977). According to the carnivore connection theory of Brand Miller and Colagiuri (1994), unnaturally high carbohydrate intake in carnivores—especially that with high glycemic index—may contribute to the development of diabetes mellitus. Such diets, through evoking higher postprandial insulin responses might lead to overstimulation of the pancreatic β cells and to their exhaustion and eventually to diabetes mellitus. In other species, such as rats, however, it was the fat rich diet that negatively influenced glucose tolerance and insulin sensitivity and might thus increase the risk for diabetes mellitus (Akiyama et al., 1996; Chalkley et al., 2002; Chisholm and O'Dea, 1987; Collier et al., 1985; Storlien et al., 1986).
The aim of the present study was to elucidate whether diet composition (high fat versus high carbohydrate diet) affects glucose metabolism in the carnivorous cat and thus what impact nutrient intake may have on the development of diabetes mellitus in this species. The influence of sexual status on these parameters was also studied, using neutered and sexually intact male cats, since gonadectomized male cats seem to be more prone to develop diabetes mellitus (Panciera et al., 1990). It has been shown that leptin, a polypeptide hormone mainly synthesized by the adipocytes, also influences the fat and carbohydrate metabolism (Frühbeck and Salvador, 2000; Hansen, 1999). Thus the effects of dietary manipulation and castration on plasma leptin levels were also investigated.
Materials and methods
Animals and diet
Six neutered (weighing 5.4±0.6 kg, BMI: 47.6±1.7 kg/m2) and six sexually intact (weighing 4.7±0.4 kg, BMI: 44.9±2.2 kg/m2) clinically healthy male European shorthair cats, aged between 19–21 months, were used. Castration was performed at the age of approximately 10 months. The body mass index was calculated as previously described by Nelson et al. (1990) [BMI = body weight (kg)/body height (m)×body length (m)]. The cats were housed in individual cages (450×140×185 cm) in a temperature-controlled room (20 °C) with a light phase of 12 h (7 a.m.–7 p.m.). The housing facility allowed separate fecal and urine collection.
The food was based on canned commercial cat food (Whiskas® with salmon, 400 g) with the addition of either 200 g of Polenta (cooked, mashed corn: 17 g carbohydrate, 2 g protein, 1g fat/100 g) to the high carbohydrate (HC) diet or of 11.8 g melted lard to the high fat (HF) diet to each can. The HC and HF diets contained 40.3% and 12.7% carbohydrate and 15.1% and 29.2% fat on dry matter basis, respectively (for food composition see Table 1). Although both the crude protein content and the energy density were higher in the HF diet, the rations were calculated according to the energy requirements of the animals to maintain stable body weight. Thus the total daily intake of protein did not differ markedly on the two diets (see CP/ME values in Table 1). The canned food was stored at room temperature and the supplements were kept in a freezer (−20 °C) until use. The daily portions were freshly prepared each morning and representative samples were taken each day and frozen for later nutrient analyses. The cats were fed twice daily between 8–9 a.m. and 5–6 p.m. with an amount that covered their daily energy requirement and maintained their body weight. The energy requirement of the sexually intact cats was approximately 14% higher (Läuger, 2001), thus they received more food per kg of body weight. The cats had free access to water and their body weight was controlled two times a week.
Results of the Weender analysis of the diets (18 samples/diet)

ME = metabolizable energy, CP = crude protein, n.d. = not detectable (carbohydrate=crude fiber + nitrogen free extract).
Experimental design
The cats were divided into two groups, each comprising six neutered and six sexually intact animals. Each group was fed one of the two diets for 3 weeks. The first week served as an adaptation period to the new diet. In the second week the total apparent digestibility of the diets and the digestibility of the nutrients was determined in a digestion trial. On day 19, the cats were anaesthetized with buprenorfin (Temgesic, Essex Chemie, Luzern) and propofol (Propofol, Provet) for jugular catheter implantation (Cook Australia, 16 Gauge, 15 cm). After allowing 24 h for recovery, a 24-h blood-sampling period was initiated (2 p.m.–2 p.m). On the following morning (8–11 a.m.) an intravenous glucose tolerance test was performed on each cat, after food had been withheld overnight (12 h). The jugular catheters were removed after the last blood sample was taken and food was offered to the cats. In total, 27.3 ml of blood were drawn from each cat during a sampling period. After a recovery interval of 4 weeks, the cats were switched to the respective other diet and the experiments were repeated as described.
The experimental design has been approved for animal welfare by the Kantonales VeterinäramtZurich (# 138/2000).
Determination of diet composition and digestibility
During both trials, random samples were taken from the two diets every day (18 days per trial). Samples of two days were pooled and analyzed together. Therefore, a total number of 18 samples were analyzed from each diet, nine during each trial.
The apparent digestibility of the diets was determined by the total feces collection method during the digestion trial (second week of experiment). During these 6 days, the daily food intake and the total amount of feces excreted was measured. The fecal samples were collected daily and kept frozen until analyzed. After defrosting the fecal samples, all samples from one cat were pooled. A randomly taken fecal sample from this pool was analyzed for each cat in each trial. Similarly, a sample from both diets was taken every day for the determination of the digestibility coefficients of nutrients. Again, samples from 2 days were pooled and analyzed together. The mean value was taken for the calculation of the digestibility coefficient.
The dry matter, crude ash, crude protein, crude fiber and crude fat content of both the food and fecal samples were determined by Weender analysis. In addition, the starch content was also measured by an enzymatic test kit from Boehringer, Mannheim.
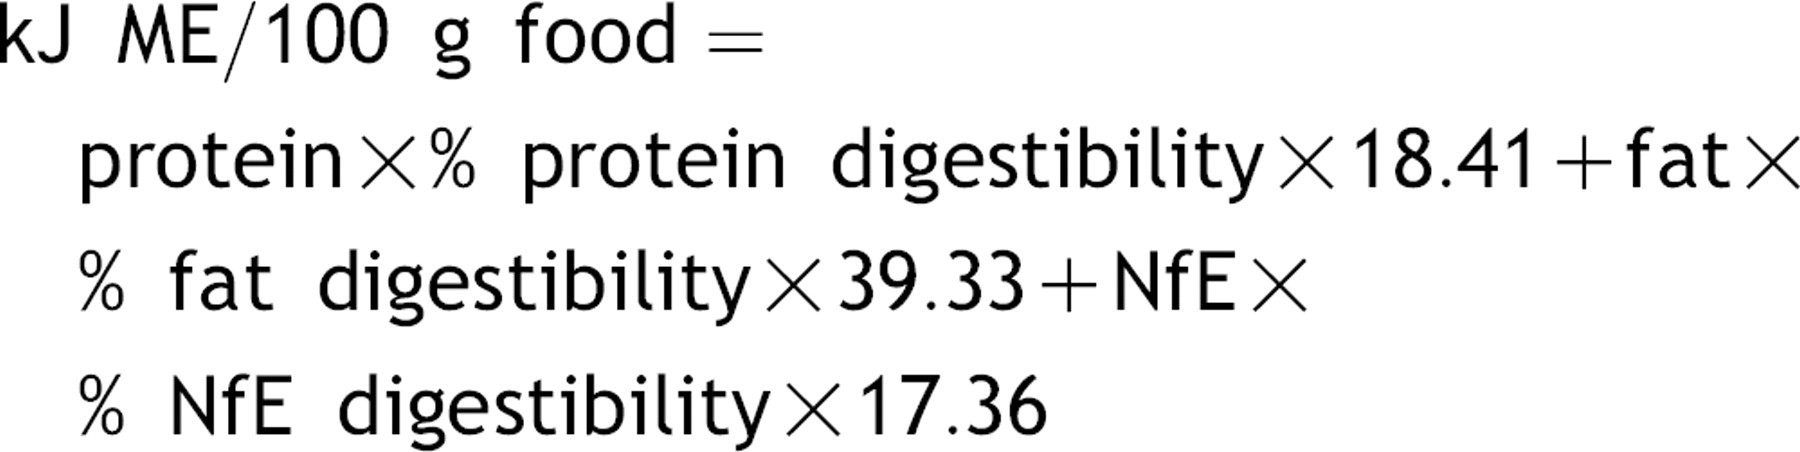
Total apparent digestibility of the nutrients and the metabolizable energy (ME) in the diets were determined by the following formulations according to Hand et al. (2000):

24 h trial
Starting at 2 p.m., blood samples were drawn every 3 h after flushing the catheters with 2 ml heparinized saline (10 Units/ml) and removing 0.5 ml of blood. At each time point, samples of 1.3 ml blood were collected into fluoride–heparin coated tubes for the measurements of plasma glucose, lactate, β-hydroxybutyrate, cholesterol, triglyceride, free fatty acid, blood urea nitrogen (BUN) and creatinine. An additional 1.3 ml blood was collected at the first and at the last sampling time point into tubes containing potassium-EDTA for the determination of plasma leptin levels. The plasma was separated by centrifugation at 4 °C immediately after sample collection and was stored at −20 °C until analyzed. During this sampling period, fresh food was offered at 11.30 a.m. and at 7.30 p.m. Food was not removed between the feedings.
Glucose tolerance test
The previously described procedure (Link et al., 1997) has been modified by using the same jugular catheter for injecting the 50% glucose solution and for collecting the blood samples. Before the test, food was withheld for 12 h. Samples of 1.3 ml blood were drawn into EDTA coated tubes prior to the glucose administration (0.5 g glucose/body weight, baseline value at t = 0 min) and at 2, 5, 10, 15, 30, 45, 60, 90, 120 min after the injection. Until centrifugation, which followed within 15 min after sample collection, the blood samples were put on ice but were otherwise handled as described above.
Blood chemistry analyses
The blood chemistry test was performed by Cobas Mira automated chemistry analyzer. Leptin levels were determined by radioimmunoassay (Multispecies Leptin RIA Kit, Cat #XL-85K, Linco Research Inc.), while insulin levels were measured by a commercially available RIA kit (Phadeseph insulin RIA, Pharmacia and Upjohn Diagnostics AB, Uppsala, Sweden).
In the glucose tolerance test, the half-life for glucose disappearance (t½) between 15–90 min and the glucose disappearance coefficient (K glucose) values were calculated by the Prism 4.0 computer software.
Statistical evaluation
The statistical analyses were performed on mean values of data. Paired t-test was used to compare the digestibility coefficient values of the different diets. From the data obtained during the 24-h trial, the areas under the curves were calculated and were used for statistical evaluation. This was considered necessary in order to minimize the influence of feeding and the individual eating pattern of the cats, as well as the circadian variation in the blood parameter levels. To analyze differences between the effects of the two diets and sexual state on the selected blood parameters, analysis of variance for repeated measures was performed. Since there was no difference between the plasma leptin levels measured at the two time points in the 24 h trial, the mean of the two separate measurements was used for statistical analysis. A P value ≤0.05 was considered significant. All data are expressed as mean±SEM.
Results
Diet composition and digestibility
During the experiments all cats maintained their body weight and none of them showed any signs of illness or maldigestion. The results of the Weender analyses of both diets and the apparent digestibility of the nutrients are presented in Tables 1 and 2. There was no significant difference in the total digestibility of the HC and the HF diet. However, the carbohydrate digestibility was significantly (P < 0.001) lower in the HF diet, while protein (P < 0.001) and fat (P < 0.01) digestion was reduced in the HC diet. The starch digestibility in the HC diet was 100%.
Apparent digestibility coefficients (DC) (12 cats/group) of nutrients in the two experimental diets

Significantly different from HC values, P<0.05.
24 h trial
Table 3 shows the ranges of the blood chemistry values. In Table 4, the results of the 24-h blood sampling period are presented, expressed as the total areas under the curves (AUC).
The highest and lowest blood parameter values as obtained during the 24-h sampling period

The total areas under the curve of the plasma values during the 24-h period of the blood sampling trial

Significantly different from HC values.
Significantly different from the values of the intact cats, P<0.05.
Neither food composition nor sexual status influenced significantly the plasma glucose and lactate levels. However, compared to the HC cats, the blood glucose concentrations were slightly higher in the HF group.
As would be expected, the parameters of fat metabolism were elevated in cats fed the HF diet at every corresponding time point. Alike the plasma free fatty acid concentrations (P<0.01), the triglyceride, cholesterol and β-hydroxybutyrate levels were significantly (P<0.001) higher in the HF group. The neutered cats had significantly higher cholesterol values (P<0.01), while the intact males showed elevated plasma β-hydroxybutyrate levels (P<0.05). The sexually intact cats had somewhat lower triglyceride plasma concentrations, but the difference was not significant.
The determination of the plasma BUN concentrations revealed significantly (P<0.01) higher values in the HF group. There was no significant difference found in the creatinine plasma levels between any of the groups.
Leptin
The mean plasma leptin values are presented in Table 5. The neutered cats had significantly higher plasma leptin values, independently of the nutrient composition of the ration. Compared to the HC diet, the HF diet induced a moderate but non-significant elevation in the leptin levels. This tendency remained the same when the leptin levels were adjusted to body mass index (BMI) (1/BMI×leptin level).
Mean leptin concentrations of two plasma level measurements (ng/ml Human Equivalent) during the 24-h trial

Significantly different from the values of the intact cats, P<0.05.
Glucose tolerance test
Data derived from the intravenous glucose tolerance tests are summarized in Table 6 and Figs. 1 and 2.
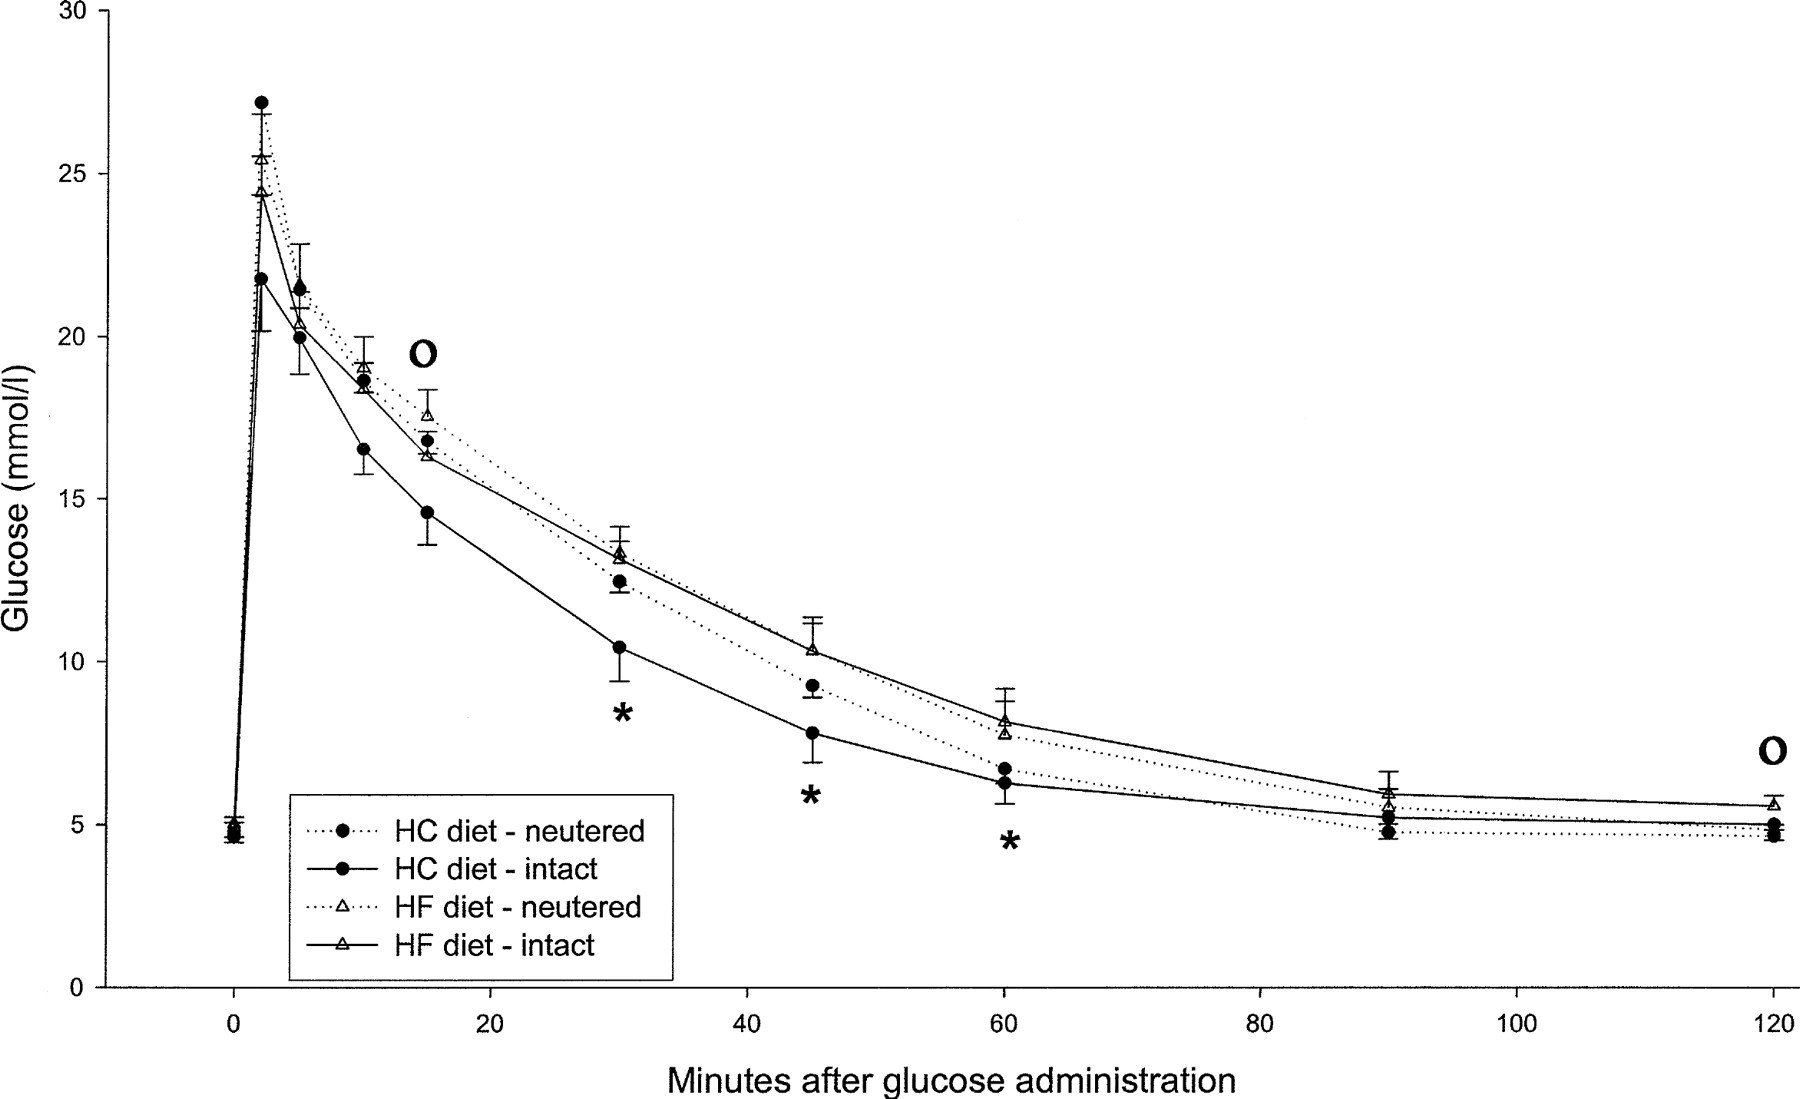
Mean plasma glucose values after iv glucose (0.5 g/ kg body weight) administration to neutered and sexually intact cats, after 3 weeks' consumption of the respective diets. ∗ = Significant difference between dietary groups, ° = significant difference between intact and neutered cats, P<0.05.

Insulin response during iv glucose tolerance test of neutered and sexually intact cats, after 3 weeks' consumption of the respective diets. ∗ = significant difference between dietary groups, P < 0.05.
Results of the iv glucose tolerance test in sexually intact and neutered male cats after consumption of HC or HF diet. Glucose values are expressed in mmol/l
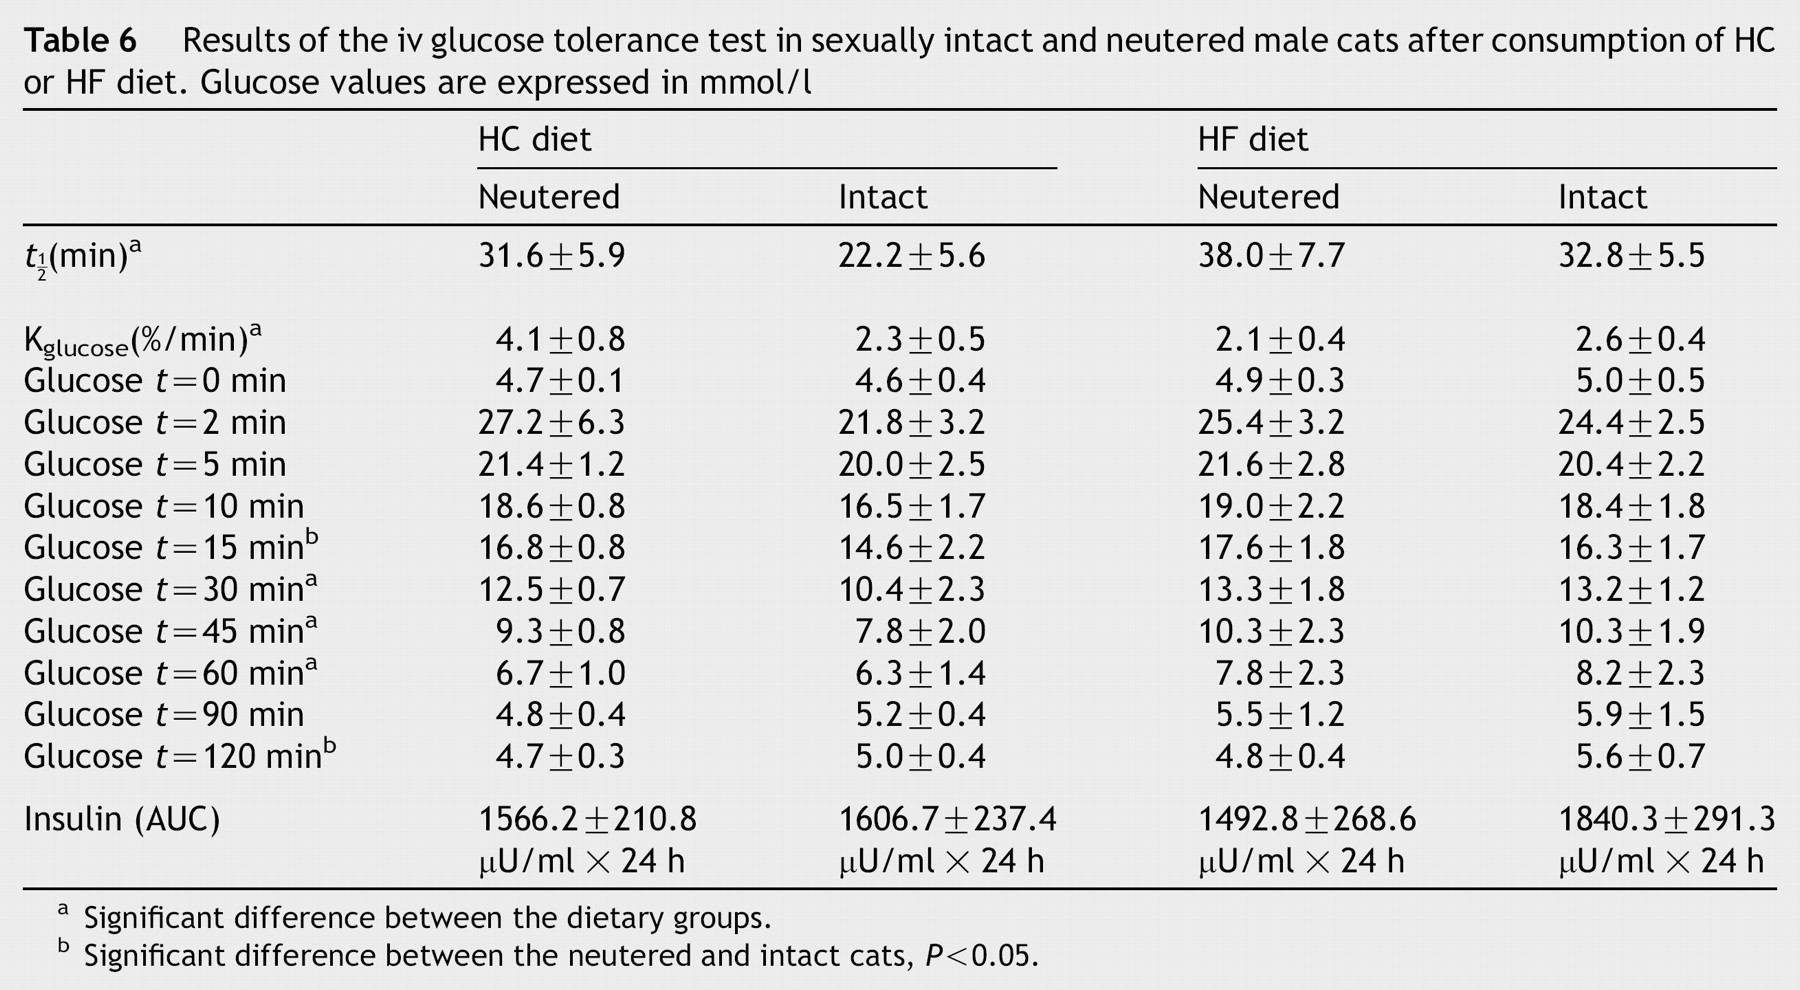
Significant difference between the dietary groups.
Significant difference between the neutered and intact cats, P<0.05.
In the iv glucose tolerance test the plasma glucose levels were slightly higher in the HF group at almost every time point, with the differences reaching statistical significance at 30, 45 and 60 min (P < 0.05). In both dietary groups, the glucose levels returned to baseline within 90 min after the injection. The determination of the half life for glucose elimination (t½) (P = 0.04) and the glucose disappearance coefficient (K glucose) (P = 0.03) revealed a significantly elongated glucose elimination when the HF diet was fed. Castration did not have a substantial effect on the glucose clearance, although the 15 (P < 0.05) and 120 (P < 0.05) min values significantly differed from that of the sexually intact cats, when combining both dietary groups.
Fasting insulin levels were not influenced either by diet or castration. From 2 to 10 min after the iv glucose application, the insulin values were significantly lower in the HF animals. However, the total area under the insulin curve did not differ between the two groups. Neutering did not seem to affect the insulin response to glucose.
Discussion
Digestibility of the diets and nutrients
Diet composition did not significantly influence the total apparent digestibility of the diets (see Table 2). The high digestibility coefficient of carbohydrate in both diets (89.4 ± 4.8 in HC and 73.3 ± 7.6 in HF diet) indicates that despite the low carbohydrate content of natural carnivorous diets characteristic of the Felidae (Lindemann, 1953; Röhrs, 1987), the cat can efficiently digest certain sources of carbohydrates. However, the higher (29.2% DM basis) fat content of the HF diet reduced nitrogen free extract and carbohydrate digestibility, while the addition of cooked mashed corn in the HC diet had a significant negative influence on fat and protein digestibility in the respective diets.
Although starch is not a natural ingredient in the diet of the carnivorous cat, pet foods contain considerable amounts of it. In previous studies starch digestibility in adult cats has been shown to range between 40 and 100%, depending on source (potato, maize, wheat) and treatment (finesse, cooking) of the supplement (De Wilde and Huysentruyt, 1983; De Wilde and Jansen, 1989; Kienzle, 1993b; Morris et al., 1977). In our study, we showed 100% digestibility of the cooked maize starch in HC diet containing 28.1% starch on DM basis. Starch seemed to slightly reduce the digestibility of protein (82.0 vs. 87.2 in HF diet), as it was reported previously (De Wilde and Jansen, 1989; Kienzle, 1993b, 1994; Morris et al., 1977). However, it cannot be excluded, that the different fat content of the diets may also have influenced protein digestibility in our study. With a digestibility coefficient of 95.3 ± 1.7 in the HC diet and 98.1 ± 0.9 in the HF diet, adult cats possess a high capacity to digest fat, which was previously observed by Kane et al. (1981)and Morris et al. (1977). The obtained high digestibility coefficient values in our study show that cats are capable to efficiently digest diets high in either cooked maize starch (27.6% DM) or fat (29.2% DM).
Glucose tolerance test
After the 3 weeks consumption of the experimental diets, glucose and insulin values were within the reference ranges in all the animals, as determined previously for healthy cats by several investigators (Appleton et al., 2001; Link and Rand, 1998; Kienzle, 1989; Nelson et al., 1990; O'Brien et al., 1985, 1990). The K glucose and the t 1/2values were near the lower borderline of the normal range. However, this finding was in good concert with that of O'Brien et al. (1985), who established that the glucose disappearance is faster in cats of young age (as in our animals), than in older ones.
The same glucose load evoked an equal rise in the plasma glucose levels in all animals, but a reduced initial insulin response in the HF cats when compared to the HC group. These findings are in good correspondence with previous studies in other species, where the consumption of fat rich diets also resulted in impaired acute insulin response (Chisholm and O'Dea, 1987; Collier et al., 1985; Matsuo et al., 1999; Swinburn et al., 1991). This might indicate either a reduced β-cell capacity and/or a decreased glucose stimulatory effectiveness on insulin secretion. In vitro studies also reported impaired insulin secretion in response to glucose stimulation after long-term exposure of β-cells to FFAs (Randle, 1998). Obese cats were also shown to exhibit a decreased first but an exaggerated second phase insulin secretion in iv glucose tolerance test (Appleton et al., 2001; Hoenig et al., 2002a; Nelson et al., 1990). This deteriorated insulin response was speculated to be the consequence of diminished pancreatic glucose metabolism due to elevated FFA plasma levels (activation of the glucose-fatty acid cycle) in the obese animals (Hoenig, 2002b). Our HF cats also displayed steadily increased FFA plasma levels according to the 24 h blood sampling trial, which could have contributed to the decline in the first phase insulin secretion. Interestingly, in the first 30 min of the glucose tolerance test, even these lower insulin levels in the HF group could efficiently lower plasma glucose values to similar levels as in the HC animals. From 10 min after the glucose injection the insulin plasma concentrations returned to a comparable level in the two groups. However, the glucose values were significantly higher in the HF cats at 30, 45 and 60 min. Although elevated blood glucose levels at similar insulin levels are generally interpreted as insulin resistance, based on our results, we are reluctant to make such a statement. For the evaluation of the insulin sensitivity, our glucose tolerance test does not provide sufficient data. Euglycemic insulin clamp studies or additional information about insulin stimulated glucose disposal in the peripheral tissues would be needed for its proper assessment. There are three facts that make us cautious about declaring our HF cats less insulin sensitive than the HC cats. First, there was no significant difference between basal fasting insulin and glucose levels in the two dietary groups. Second, in the glucose tolerance test the total areas under the insulin curves did not differ in the two dietary groups. Although it has to be noted that unaltered AUC for insulin can also be present in insulin resistant animals, resulting from an enhanced second phase response after an impaired first phase response. However, in our cats, the slightly lower initial insulin secretion was not followed by elevated second phase response. Third, despite the lower initial insulin response, the HF animals were able to maintain the glucose values at comparable levels with the HC cats during the first 30 min of the test, which might imply even an increased insulin efficacy.
The altered indices of the glucose elimination rate, both the K glucose and the t½, indicate a lower glucose tolerance in the HF group relative to the HC cats. It is conceivable that the decreased early insulin secretion could have contributed to that slightly elongated glucose clearance in the HF diet.
Conflicting results are often obtained in different studies investigating the impact of diet composition on glucose and lipid metabolism and diabetes mellitus. Some studies report insulin resistance following feeding a fat rich diet (Akiyama et al., 1996; Chalkley et al., 2002; Chisholm and O'Dea, 1987; Collier et al., 1985; Storlien et al., 1986), while others contradict it (Matsuo et al., 1999; Stark et al., 2000; Swinburn et al., 1991). It is difficult to make a direct comparison between different studies employing different experimental designs e.g. duration of the trial, fat content of the diet, species/strain differences between the animals used, glucose tolerance test protocols. In rodent models the animals gain weight continuously, and although in most of these studies the increase of the body weight was similar in the different dietary groups, the changes in body composition were not investigated (Chisholm and O'Dea, 1987; Collier et al., 1985). In the study of Akiyama et al. (1996) and Chalkley et al. (2002) where impaired insulin sensitivity was established, the control animals were not pair fed with the HF group, which resulted in extreme weight gain in the HF animals. Storlien et al. (1986) showed that pair feeding of a high fat (59% of energy) diet resulted in a higher proportion of fat mass deposition in rats, when compared to an isocaloric low fat diet. Matsuo et al. (1999) have not reported insulin resistance in rats fed diets containing 40% fat on energy basis and gaining weight and fat mass in the same level as the low fat diet fed control animals.
In our study, the amount of food was adjusted for cats to maintain constant body weight during the experiments, i.e. the caloric intake was approximately the same in both diets. In studies with similar design to ours, in the HF groups either no elevation or even a decrease in the insulin response was found after a glucose load, along with elongated glucose elimination (Matsuo et al., 1999; Stark et al., 2000). These findings support the notion that it is rather the increased amount of body fat and lipid accumulation in non-adipose tissues that contributes to insulin resistance and not directly the amount of fat intake, as it was proposed by Wilkes et al. (1998). This idea is also supported by the fact that in obese subjects, independently of the diet consumed, there is a high prevalence of hyperglycemia, hyperinsulinemia and diminished insulin sensitivity, which however is improved after weight loss (Boden, 1997). Cats, fed a maintenance diet ad libitum and increasing their body weight by 20 or 44% (Appleton et al., 2001; Fettman et al., 1998) also showed decreased insulin sensitivity, which normalized after body weight returned to baseline level (Fettman et al., 1998). Hyperinsulinemia at baseline and also during iv glucose tolerance test, along with elevated glucose levels was also observed in obese cats, while the first phase insulin response was reduced (Appleton et al., 2001; Hoenig, 2002b).
24 h trial
In our study, the blood chemistry results did not reveal any sign of disease. However, comparison between our results and the reference values is only possible under certain limitations, because the latter values were obtained in fasted cats while our animals had free access to food. As would be expected, this study revealed increased plasma FFA and cholesterol concentrations after feeding HF diet to cats for 3 weeks. The high digestibility coefficient of crude fat (98.1%) in the HF diet indicates that the higher dietary fat intake led to increased intestinal absorption of these compounds, thus to higher FFA and cholesterol plasma levels in the HF cats. These results were compatible with those of several previous authors in different species (Dobenecker et al., 1998; Kitagawa et al., 2000; Prigge and Grande, 1973; Romsos et al., 1976). The increased availability of FFAs promotes on one hand lipid storage through enhanced triglyceride synthesis, which accounts for the observed higher triglyceride levels. On the other hand, it promotes FFA utilization through enhanced β-oxidation. The increased amount of acetyl-CoA derived from the accelerated FFA oxidation leads to increased formation of ketone bodies, which explains the significant increase in plasma β-hydroxybutyrate concentration in the HF group.
According to the theory of Randle et al. (1963), the increased availability of FFAs impairs the glucose uptake and oxidation in peripheral tissues (by 35–45% in mice, Stark et al., 2000) and leads to insulin resistance, as it was established in several studies (Chisholm and O'Dea, 1987; Matsuo et al., 1999; Wilkes et al., 1998). In the insulin dependent tissues, FFA will be preferably utilized instead of glucose to supply energy. At high plasma FFA levels hepatic insulin resistance was also observed, which results in enhanced glucose production in the liver. The increased production and decreased utilization leads to elevated blood glucose concentration. However, for the manifestation of an overt hyperglycemia either a severe insulin resistance or decreased insulin secretion has to develop. The current study revealed no significant difference in basal plasma glucose levels between the two dietary groups, indicating that none of these pathological changes have occurred in our cats. However, it cannot be excluded that longer term feeding of diets with even higher fat content may have more deleterious effects on glucose metabolism.
A steady state elevation of FFA levels e.g. in obesity has been shown to lead on one hand to increased triglyceride deposition in the pancreatic islets of Langerhans, causing cellular depletion and fibrosis (Grill and Qvigstad, 2000) and on the other hand to decreased insulin effectiveness, i.e. insulin resistance (Boden, 1997; Kraegen et al., 2001). It remains to be investigated whether a long term and an efficiently high increase in FFA blood levels can be obtained to initiate pancreatic steatosis and insufficiency through the consumption of fat rich diets without the development of obesity. Nevertheless, in our study the cats consuming the HF diet, probably due to their species-specific nibbling pattern of eating, displayed almost continuously increased FFA levels in the fed state. Thus, in cats increased fat intake without the development of obesity seems to be able to impair glucose metabolism and insulin secretion. Decreased glucose induced insulin secretion is considered the earliest and most relevant sign of non-insulin dependent diabetes mellitus (Grill and Qvigstad, 2000). However drawing a direct conclusion to the impact of fat content of the diet on the development of diabetes mellitus, based upon our short-term study is not feasible, since all plasma parameters of our cats remained in the normal reference ranges of healthy cats. Long-term studies would be needed for the evaluation of this hypothesis.
Interestingly, high carbohydrate intake has also been reported to result in elevated triglyceride and FFA plasma levels, in lipid accumulation and insulin resistance in muscle and thus to the deterioration of glucose metabolism (Chalkley et al., 2002; Higgins et al., 1996; Kraegen et al., 2001). This phenomenon can be partly attributed to the reversed glucose-fatty acid cycle, where the glucose oversupply would inhibit lipid oxidation, thus enhance lipid storage (Kraegen et al., 2001). On the other hand increased de novo lipid synthesis and/or decreased lipid clearance might be contributive factors as well.
In the neutered cats the lack of testicular androgen production could have played a role in the observed changes in the lipid metabolite levels. Androgens are known to influence several pathways of the lipid metabolism (decrease in plasma FFA, triglyceride, phospholipid, high-density lipoproteins, total cholesterol levels, increase in adipose tissue triglyceride) (Döcke, 1994; LaRosa, 1995).
The significantly higher plasma BUN level in the HF cats can be traced back to the higher protein content (9.3 g/100 g food) of this diet, compared to the Polenta supplemented HC diet (6.9 g/100 g food). An impairment of the kidney function can be excluded, since both the BUN and the creatinine values remained within the normal ranges of healthy animals.
Leptin
All leptin values were within reference ranges, as established by Appleton et al. (2000)for healthy, normal-weight cats (0.92–11.9 ng/ml Human Equivalent). The higher dietary fat intake induced a slight increase in the leptin levels approximately to the same extent in both sex groups, in spite of the unchanged body weights during the trials. The altered plasma lipid levels and/or the altered carbohydrate or fat metabolism might have accounted for this. Leptin was shown to inhibit insulin secretion from the β-cells (Frühbeck and Salvador, 2000), thus this moderate elevation of plasma leptin may have contributed to the impaired insulin response to glucose in the HF group.
In the neutered cats we observed significantly higher plasma leptin concentrations, independently of which diet was fed. This tendency remained after the leptin levels were adjusted to BMI. An increase in plasma leptin levels after castration has been reported in several species including the cat (Hoenig and Ferguson, 2001; Kanchuk et al., 2002; Watanobe and Suda, 1999). There is evidence that this elevation in leptin levels is due to the absence of the inhibitory effect of testosterone on leptin production (Hislop et al., 1999; Jockenhovel et al., 1997; Luukkaa et al., 1998; Palmert et al., 1998; Wabitsch et al., 1997; Watanobe and Suda, 1999). Plasma leptin concentration is not only correlated with testosterone levels in cats, but also with the size of the fat depots (Appleton et al., 2000; Backus et al., 2000). In our study the neutered cats weighed more than the intact ones and also had higher BMIs. This suggests a higher body fat mass in the neutered males, which in addition to the lack of the inhibitory effect of testosterone could also have contributed to the observed higher plasma leptin levels in these animals.
The carnivore connection hypothesis suggested that in carnivores a HC diet might lead to pancreatic β cell exhaustion through their over stimulation, and thus to diabetes mellitus. Our study implies that the cat seems to be able to cope well with processed HC diet in the short term. Furthermore, alike in non-carnivorous species it seems that it is rather the HF intake that might acutely impair glucose tolerance in cats. However, it is conceivable that on the long term HC feeding might as well lead to deteriorated glucose and insulin homeostasis.
Footnotes
Acknowledgement
Appreciation is expressed to Claudia Reusch, Professor of the Clinic of Small Animal Internal Medicine of the University of Zurich for her support at the jugular catheter implantation, to Barbara Schneider and Brigitte Küffer for their help with sample analysis. The motivating enthusiasm and support of Dr Viktor Szatmari is deeply appreciated.