
Abstract
Quantification of hemodynamics may be invaluable in a drug development setting. However, one of the challenges in the application of imaging technologies for compound screening purposes is the large volume of data in a short amount of time. This article focuses on methods developed for large-scale hemodynamic quantification, as measured from high-frequency Doppler ultrasound in rodents. An integrative semiautomated method for processing Doppler ultrasound images is described and validated. In the context of experimental biology, this toolbox allows for a comprehensive hemodynamic evaluation of in vivo physiology as the result of medical intervention, thus enabling rapid compound screening in preclinical drug development.
Introduction
In cardiology, Doppler ultrasound is not an exact measurement but rather a view of underlying physiology. Although the nature of flow within a blood vessel is described by Doppler ultrasound, measurements of flow are routinely calculated and interpreted in medicine. However the pulse waveform, after its origin in the left ventricle, is subjected to many forces within the vasculature and hence emerges the more complex concept of hemodynamics. A cursory interpretation of the blood flow velocity waveform can be given by calculating maximum and minimum values and cardiac period. Yet clinical theorists like McDonald, Milnor, and others 1,–3 have proposed that indeed much more information is present within a pulse waveform and have motivated hemodynamic analysis.
Noninvasive blood flow measurement modalities have become a powerful clinical tool to extract the physiological response of volume motion inside a vis-coelastic vessel. Ultrasound instruments, such as the transthoracic and transesophageal Doppler have been used and validated to measure changes in blood flow in response to contractility, preload, and systemic vascular resistance. 4,5 Doppler has also been shown to measure stroke volume and correlates well with the gold standard thermodilution technique. 6,7 Current Doppler velocity biomarkers include flow time, acceleration, time to peak velocity, and others. 4 8 9 These biomarkers have been validated and investigated under therapeutic intervention and thus make possible data-driven analysis and innovation of novel markers, which describe physiological function both clinically and preclinically.
The use of Doppler ultrasound as a preclinical compound screening tool with a multitude of extrapolated indices creates an analysis bottleneck. As the precision of ultrasound physics has increased, there is a clear unmet need in subsequent analytical methodologies. The development of a toolbox that can batch process raw data becomes a necessary scalable solution. Traditional Doppler waveform viewing relies on contrast images of intensities to determine the signal; computational methods provide an alternative that consistently and accurately produce peak velocity waveforms without the use of a “blanket” or user tracing. Semiautomation not only increases the rate of analysis but also enables researchers to incorporate novel biomarkers simultaneously with current established standards. The application is perhaps most significant in experimental medicine studies where one may integrate Doppler flow analysis with other modalities. Consequently, this type of analysis may better characterize the cardiovascular effects of compounds in drug development studies.
Our goal is to develop a large-scale automated assessment of in vivo physiology in a drug development setting using the Visual Sonics system, at the level of use that renders 200 mice to be scanned and quantified for hemodynamic evaluation (atherogenesis, hypertension, and so forth) within a week. This scale of scanning and hence quantitation requires specialized batch processing that is at present somewhat deficient in current high-frequency Doppler instrumentation. However, one of the key features of the VEVO 770 (Visual-Sonics, Toronto, Canada) is access of acquisition data through an export feature, which adds to the elegant flexibility of the system and enables the development of specialized tools tailored to specific user needs. This newly developed toolbox should add considerable value to pharmaceutical level use via high-throughput utilization and experimental biologists who can customize algorithms for specific investigations. The advantages of this automated system are manifold. The automated system allows the user to process most, if not all, of the waveforms acquired, to correct for respiration and other hemodynamic effects on flow, to attain the goal of scanning and processing 200 mice/week, to reduce interoperator bias, to reduce the burden of analysis through automation thereby enabling more studies to be done and helping experts to focus on interpretation of biology, and finally, the automated system is key in making early and efficient decisions on compound survival with a statistical “n” that exceeds the noise floor of disease heterogeneity.
This semiautomated system addresses the large-scale need of a pharmaceutical setting by batch analysis of raw Doppler data in Matlab (The Mathworks Inc., Natick, MA). The only analysis feature of the Visual Sonics VEVO 770 series that we used was the feature for exporting digitized Doppler images as input for the automated system. Method validation was completed on midlevel left common carotid Doppler scans of low-density lipoprotein receptor (Ldlr)-null mice (B6.129S7-Ldlr <tm1Her>/J); illustration of the hemodynamic analysis was computed in the spontaneously hypertensive rat model (Charles River Laboratories, Inc., Wilmington, MA). Doppler parameters computed by the toolbox include period, mean velocity, maximum velocity, maximum acceleration, minimum velocity, time to maximum acceleration, ejection duration, diastolic time, left ventricular ejection time corrected (LVETc) for heart rate, and velocity-time integral (VTI). 4,9 Parameters were computed in the spontaneous hypertensive rat model by examining Doppler waveforms of the abdominal aorta during baseline condition and after administration of NG-nitro-l-arginine methyl ester (L-NAME).
Computer Algorithms and Methods
The thread of events that cumulatively define the Doppler analysis toolbox are described in Figure 1. The complex problem of spectral envelope extraction has been extensively addressed in the past, and hence we provide some detail regarding our Doppler spectral extraction process. 10 –12
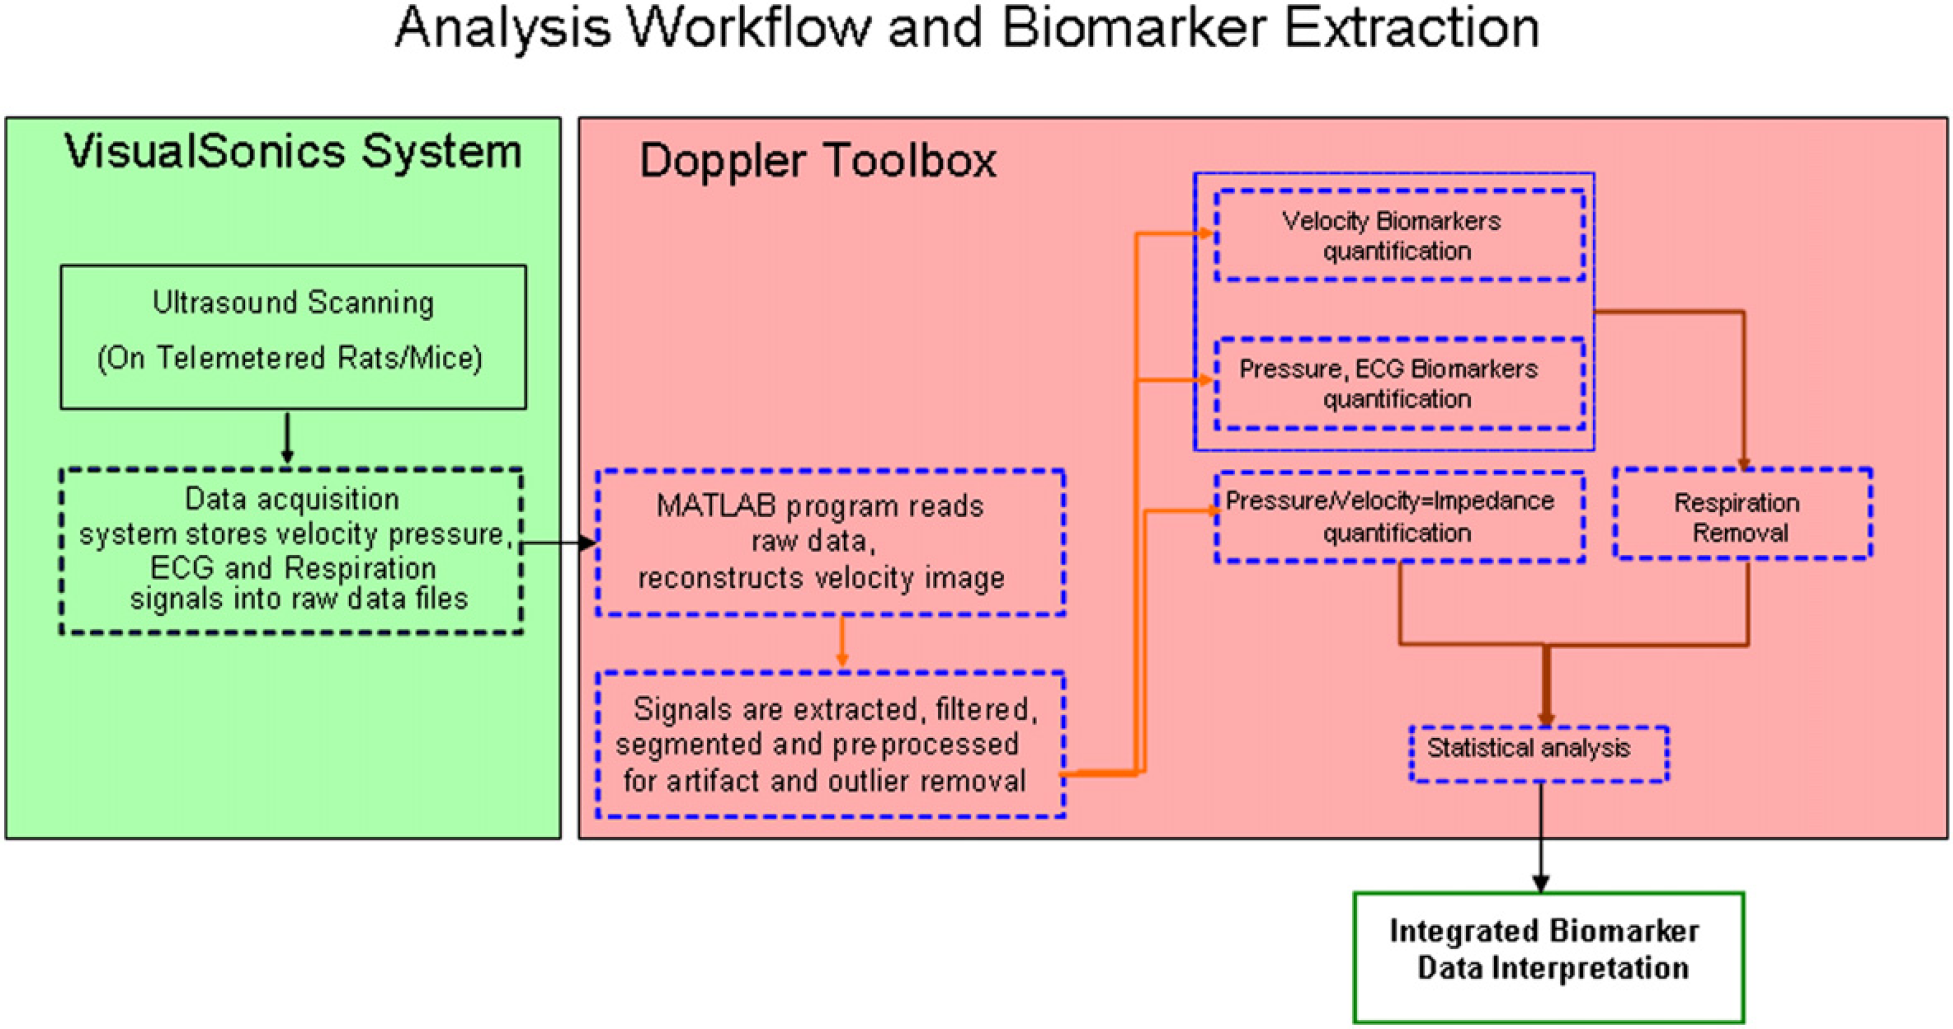
High-throughput flow chart. Dashed boxes are semiautomated. Solid boxes are manual.
An important acquisition capability of the Visual Sonics system is the integration of simultaneously recorded physiological measurements with the ultrasound modes. These physiological measurements include respiration, electrocardiogram (ECG), and blood pressure. Comprehensive integration of these measurements allow for the investigation and development of derived biomarkers, including vascular impedance (spectral) and pulse wave velocity. 2,3 On completion of the Doppler acquisition, the Doppler data are exported in raw data format from the Visual Sonics system. These raw data files are stored and consequently imported into the Matlab-based Doppler toolbox using a user-initiated script. The remainder of the analysis is done outside of the VEVO 770 system, using the automated analysis tool we built. The reconstructed Doppler image, seen in Figure 2, along with any other signals that were simultaneously measured, are filtered, segmented, and preprocessed for artifact and outlier removal. We use Matlab's built-in filtering functionality for filtering the Doppler and pressure waveforms. Velocity, pressure, and ECG biomarkers are then quantified and processed for respiration effects. Statistical analysis of biomarkers, based on the specific experimental design, is the final step in the analysis process. All steps described above, with the exception of the acquisition and statistical analysis, are semiautomated and can sustain a high-throughput processing of approximately 200 animals/week. Comparison of the manual versus semiautomated analysis throughput is not straightforward, because a significantly larger percentage of the data are analyzed with the semiautomated method than with the manual method. For the same amount of data, the semiautomated method is at least one order of magnitude faster than the manual method. The automation of statistical analysis is difficult because different experimental designs may require different form of statistical analysis. The remainder of this section will be devoted to a brief recommendation of statistical methods for randomized parallel-group longitudinal imaging experiments, the Doppler envelope extraction, the segmentation process, and a description of velocity-based biomarkers quantified by the system.
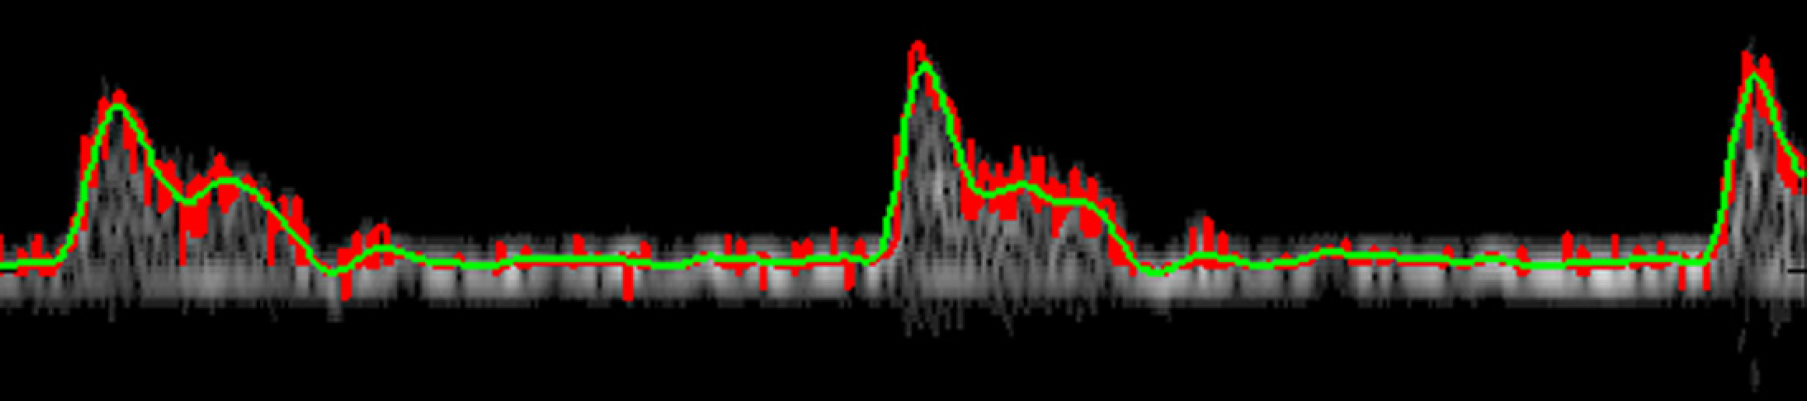
Extracted peak velocity tracing overlaid with raw Doppler output.
The most common example of an experimental design made possible by imaging is the randomized, parallel-group longitudinal study. In this design, a cohort of animals is scanned at baseline; subsequently, each animal is randomly assigned to one of several treatment groups. Each group receives a distinct intervention, which may include different compounds, different doses of the same compound, a vehicle control, and so forth. The animals are rescanned at several fixed time points after dosing begins. This allows tracking potential changes in biomarker values, because of disease progression and therapeutic intervention, in the same animals over time. Statistical analyses of data from such a design can be implemented with the use of mixed effect models, which attribute sources of variability to both between- and within-animal components. 15,–17 For instance, the time point, treatment group status, and their interaction can be used as fixed effects and animal as a random effect, as predictor variables in a statistical model, with any biomarker as the response variable. A simple within-subject correlation structure is usually assumed, such as compound symmetry or first-order autoregressive. 15 –17 Statistical contrasts are used to form hypothesis tests, such as comparing the difference between two treatment groups at any fixed postbaseline time point, subtracting their baseline group difference. Semiautomation of statistical modeling can be implemented using standard software, such as the R/S-plus package “nlme.” 18
The Doppler signal output from the VEVO 770 is composed of two channels, I and Q; a result of quadrature demodulation. The I and Q channels are used to construct the complex signal I + jQ, which contains both amplitude and phase information. This complex signal is used to create the spectrogram with magnitudes corresponding to signal strength, y-position corresponding to frequency shift, and x-position corresponding to time. The creation of this spectrogram matrix in Matlab is achieved by a subroutine that takes into account parameters from the VisualSonics raw data export. We use the spectrogram function in Matlab with a Blackman filter and an overlapping moving window to reconstruct the Doppler matrix. This matrix of the image is typically displayed on Doppler monitors. The Doppler frequency shifts correspond to the red blood cell (RBC) velocities crossing over a specified Doppler window, at a given axial location along an artery. Artifacts because of pure reflection without any frequency shift (such as underlying tissue, and so forth) also produce strong peaks in the Doppler spectra near the zero frequency shift.
To extract the peak Doppler velocity waveform from the matrix, a semiautomated method is used. Each time interval of the Doppler signal represents a spectrum of RBC velocities occurring within a range of frequency shifts (which may vary by Doppler settings). Magnitude of the spectrum at a discrete frequency corresponds to a distinct group of RBCs moving at a particular velocity. Because of factors, such as harmonic dispersion and acceleration effects, a single velocity is represented by a distribution of velocities centered about the primary velocity. The reconstruction of the peak Doppler velocity waveform begins with the identification of a velocity at each time interval. Using the zero crossing of the second derivative of spectral magnitude with respect to frequency to identify peak magnitudes in the spectrum, the algorithm subjects the identified points to the condition that their magnitude must be greater than a percent threshold of the noise floor. The noise floor is interpreted as the mean value of the matrix at the upper limit of the negative frequency range where no true signal should exist. This assumes that the noise floor is uniform across frequencies, that is, so-called “white noise.” The algorithm then determines the maximum frequency shift of the identified points by determining the greatest frequency shift from zero (either positive or negative) using a maximum function. When shifts are present in both positive and negative directions, the largest shift from baseline is assumed to be the true shift of the underlying signal. The maximum frequency shift, not the magnitude of the spectrum, is then used to compute the velocity over the time interval once combined with the Doppler parameters noted previously. The algorithm then iterates this process for each time interval in the Doppler spectrogram. A two-dimensional extraction of the maximum Doppler shifted frequency as a function of time is then created. A waveform can then be constructed by filtering the data with a Tukey filter (cutoff at 85 Hz) to smooth the data while still retaining as many of the peak velocities and inflections as possible. Once the peak velocity waveform is established, the toolbox can then proceed to segment the time-velocity signal into cardiac cycles.
Beat-to-beat analysis of hemodynamic features can only be done after appropriate segmentation. Segmentation refers to identification of both position and magnitude within the time-velocity curve. The proceeding segmentation results are compiled in separate arrays for biomarker identification and analysis (explored later). To identify individual heart beats, the toolbox first identifies the principle definition of a pulse wave; the beginning of systole. We define the beginning of systole, or begin systole, as a change from negative to positive slope immediately before another feature, namely the peak velocity during systole, or peak systole, defined as a change from positive to negative slope. We use a centered difference scheme to compute slopes and identify begin systole and peak systole points by their respective zero crossing using Matlab's find function. To extract only the true points and not those caused by noise or other factors, the algorithm uses a set of thresholds. In the case of peak systole, the threshold restricts peaks to those that have magnitudes within a certain percentage (approximately 85%) of the maximum value found in the recorded data set. Additionally, a distance threshold (dependant on sampling rate of acquisition and heart rate of the subject) limits the proximity of two peak systole points and yields local maximum peaks within the data set. Begin systole is identified by applying a magnitude threshold that is below a certain percentage (approximately 30%) of the maximum value of the data set, thus restricting it to near baseline values. Additionally, the begin systole values occur immediately before each peak systole, and thus every local velocity maximum (peak systole) has a preceding point (begin systole). This restriction is implemented by an iterative identification of the maximum time value of local begin systole points that are less than each peak systole time point. Because of the effects of respiration, heart rate, and so forth, these thresholds can easily be manipulated by the user for each data set. Typically, the same set of thresholds is likely to extract these features accurately for many data sets without user intervention because they are based on percentages of each data set. Just as begin systole was found immediately preceding the peak systole, the end of systole or end systole is found similarly. We define end systole, that is, the location of the incisura, as the first point after peak systole where forward flow changes slope from negative to positive, with the criteria that the magnitude is less than a threshold percentage of the maximum value (approximately 70%) of the waveform. The last segmentation parameter computed by the toolbox is the position of maximum acceleration of flow velocity. This value is found during the upstroke of each heart beat and is identified by the maximum magnitude of the first derivative of the time-velocity curve located in the time segment between adjacent begin systole and peak systole pairs. Segmentation of velocity-time curve allows for the extraction of hemodynamic conditions that represent the time course of physiology rather than a numerical mean. Additionally, beat-to-beat analysis may better characterize complicated physiology through serial biomarker identification, thereby providing power to analysis and subsequent interpretation. Toolbox segmentation of the Doppler waveforms is an effective way to identify local key points in the waveform and allows subsequent hemodynamic calculations to be made.
Hemodynamic biomarkers measure physical or functional responses of the heart and vasculature. Perhaps the most simple and straightforward biomarker extracted by the toolbox is cardiac period, calculated on a beat-to-beat basis, by computing the length of time occurring between each time point of begin systole. Segmentation not only yields positions but also values, and hence peak velocity and maximum acceleration are also obtained for each heart beat.
By comparing the timing of events in the waveform, the toolbox can identify periods of flow time (presumably from the left ventricle) dynamics. Systolic (ejection duration) and diastolic intervals can be computed on a beat-to-beat basis by computing the difference of begin systole and end systole times from the adjacent peak systole time. Subsequently, the commonly used LVETc (by Bazet's formula) can be computed on a beat-to-beat basis by dividing each flow time by the square root of measured pulse period. 4 The time interval between begin systole and the adjacent maximum acceleration or peak systole can be calculated and may provide important physiological information as well. Mean velocity is simply computed as the time-average of the velocity waveform within each cardiac cycle (defined as the time-velocity curve between adjacent begin systole points). Minimum velocity and the corresponding position in the cardiac cycle can be found using the intrinsic minimum function in Matlab. Another significant biomarker calculated for each pulse wave is the VTI. This value corresponds to an average flow rate for a given cross sectional area. Utilization of the trapezoidal rule for numerical integration of the time-velocity curve between each adjacent pair of begin systole points extracts this pertinent biomarker. When taken close to the heart, VTI is also known as stroke distance and can yield stroke volume measurements when combined with measurements of aortic area.
The algorithms applied in this toolbox extract a rich multi-variate data set characterizing complex physiology. This Doppler toolbox is capable of batch data analysis and storage. With user input threshold values, Doppler pulse waveform analysis can be computed accurately and efficiently over large data sets. This results in true beat-to-beat measurements that can be applied to experimental medicine studies.
Experimental Methods
All animal testing was completed under the protocols and guidelines of the Merck Institutional Animal Care and Use Committee and were performed in an Association for Assessment and Accreditation of Laboratory Animal Care International-accredited facility. As a hemodynamic example of toolbox analysis, one rat was anesthetized under isoflurane (2–3% isoflurane, L/min) as were Ldlr-null mice (2% isoflurane, 2 L/min). L-NAME was administered after the animal was hemodynamically stable, at a dose of 30 mpk by intravenous tail injection in volume less than 150 μL of saline solution.
Pulse-wave Doppler images were acquired with VisualSonics' VEVO 770 High-Resolution Imaging System (VisualSonics, Toronto, Canada), via the 710 (rat model) and 704 (mouse model) scan head. Offline analysis was performed by a single user, with VisualSonics' software following protocols outlined in the Vevo 770 operator manual (version 1.8). Raw data were exported from Visual Sonics and processed by the Doppler toolbox. Analysis by the semiautomated Doppler toolbox was performed by a separate operator, who optimized the previously described threshold parameters without knowledge of treatment. The results are computed and recorded with each successive waveform and saved in a database. These data can then be interpreted and statistically analyzed offline.
Validation of Semiautomated Algorithms
The semiautomated Doppler image processing/biomarker quantification algorithms were tested by comparing two of its quantified biomarkers, namely peak velocity and VTI, with the corresponding values obtained through a manual tracing method, on the same set of Doppler images. The manual tracing method was provided by VisualSonics' onboard software, which allowed for a user-guided identification of the maximum Doppler shift waveform by manipulation of image visualization parameters. Their software package displayed the Doppler image file, while the user adjusted a set of values to enable a trace or “blanket” outlining the maximum Doppler shift. After correctly blanketing the waveform, another trace function was implemented to yield several quantities, such as the peak velocity and VTI. The user delineated a length of wave-form(s) with the cursor, selecting an appropriate VTI “tool” and then fitted a new trace. By using the cursor to manually move trace points, the new trace may then be manipulated again by the user to better fit the contours of the previously outlined peak velocity waveform. From the second trace, VisualSonics' software computed values over the selected waveform segment (usually more than one waveform). The semiautomated values we processed from Doppler images showed several (usually more than 30) cardiac cycles of data. Raw biomarker values are obtained on a pulse-by-pulse basis. Postprocessing allows for automated correction of error because of respiration effects or signal attenuation. Reported biomarker values are calculated from the median of the raw values, and error bars are computed from the median absolute deviation-based estimate of one standard deviation. 13
The data for the validation study were from 50 age- and sex-matched transgenic mice on a common diet, as part of a larger (proprietary) therapeutic study. A Doppler ultrasound recording in the left midcarotid artery was obtained for each mouse. The manual tracing method was performed by a single analyst to obtain peak velocity and VTI values for each mouse. (VTI was found by tracing three consecutive waveforms and then dividing the output of the VisualSonics software by three.) These values were compared with the corresponding output from the semiautomated algorithm run on the same set of Doppler images, using Bland-Altman analysis. 14 This type of analysis provides a bias-variance decomposition and avoids well-known misleading features of other comparison methods, such as correlation and regression analyses. The Bland—Altman analysis provides a quantification of the disagreement between the paired measurements with 95% limits of agreement. Because the Bland—Altman plot can show spurious correlation if there are large differences in mean or variance in the original data, we preceded the analysis with simple unpaired and paired comparisons as initial exploratory plots. Also, graphical checks on the approximate normality of the data were carried out (not shown).
The comparison of peak velocity is provided in Figures 3 and 4. Figure 3 indicates that the distributions of the two measurements are close, with the manual measurements having a small systematic upward shift relative to the semiautomated measurements. Figure 4 provides the Bland—Altman analysis of peak velocity, quantifying the amount of the relative constant bias between the two measurements, as well as the random scatter. No evidence of proportional bias was seen. A similar comparison of VTI is provided in Figures 5 and 6. Again, the distributions of the two measurements are close, with the manual measurements having a systematic upward shift relative to the semiautomated measurements. No evidence of proportional bias was seen in the Bland—Altman plot. The small differences between the automated and the manual measurements are because of different underlying algorithms.
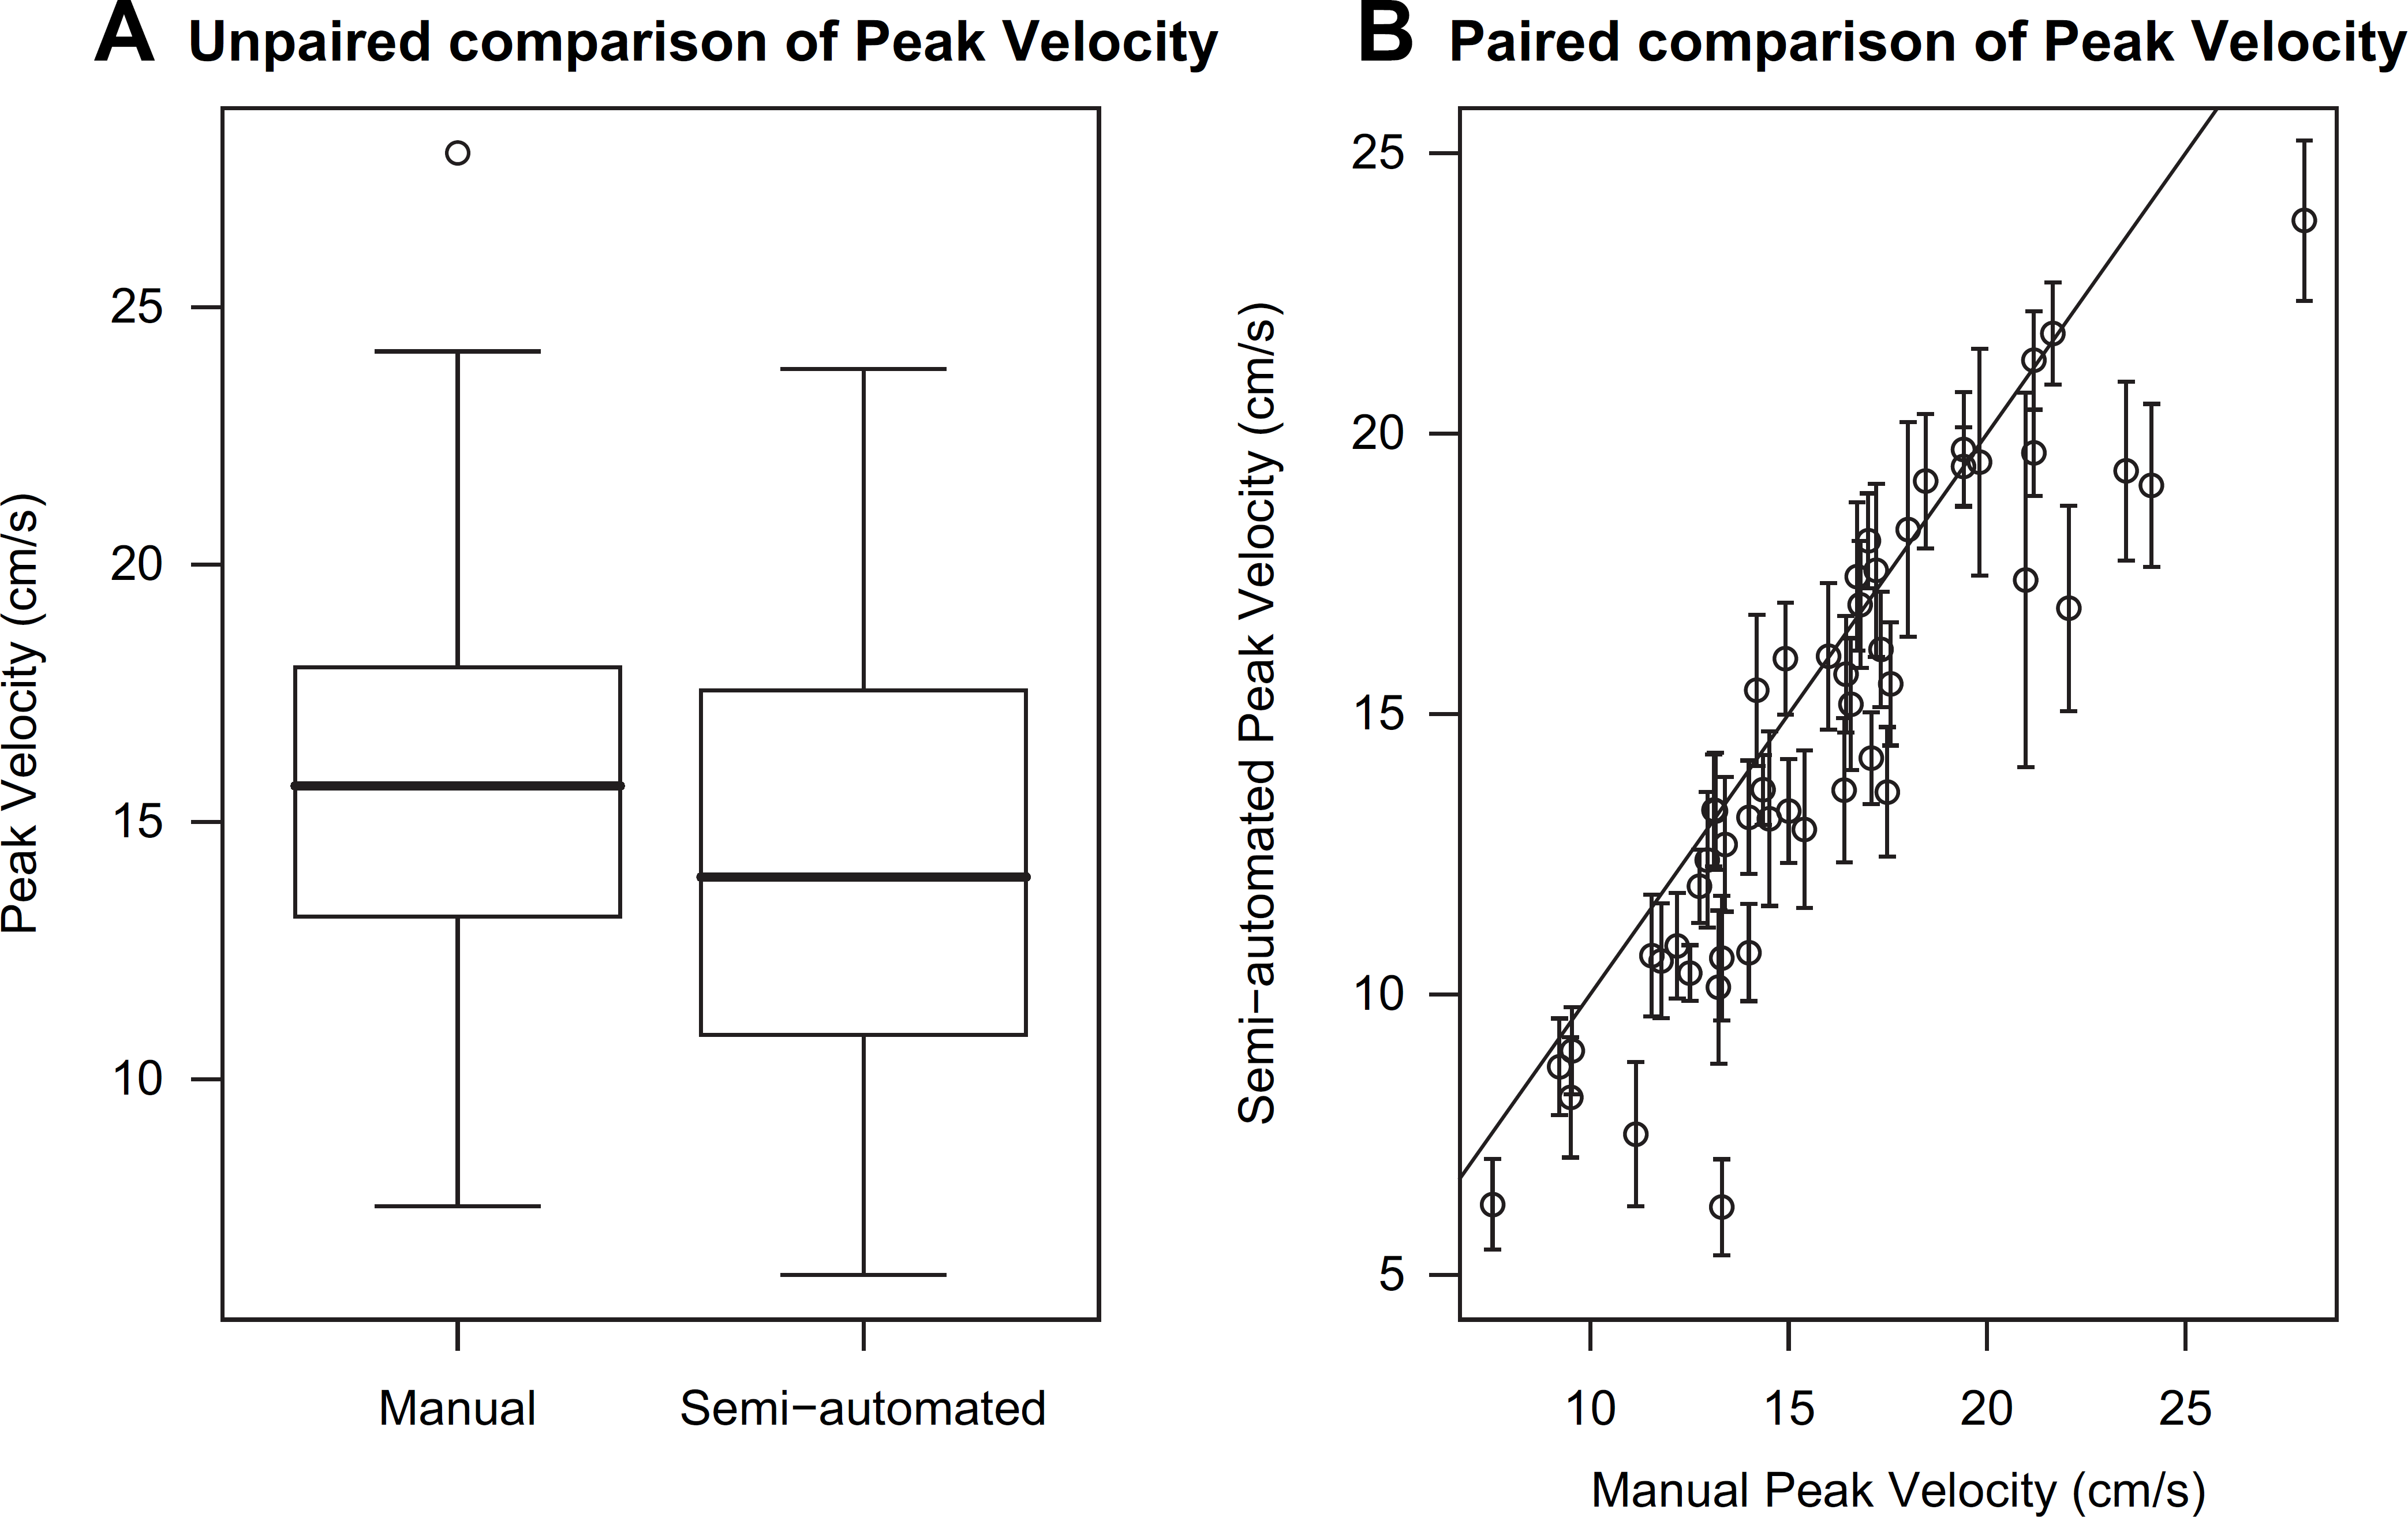
(A) Unpaired and (B) paired comparisons of peak velocity from manual tracing and semiautomated algorithm. The unpaired comparison uses standard box-and-whisker plots. The paired comparison uses a correlation scatterplot, with error bars provided for semiautomated values (see text). The solid line is the 45-degree line of agreement. The medians are 15.7 and 13.7 cm/s, respectively for manual and semiautomated values, and the corresponding interquartile ranges are 4.7 and 6.4 cm/s, respectively. The Pearson correlation is 0.90 with 95% confidence interval (0.84, 0.94).
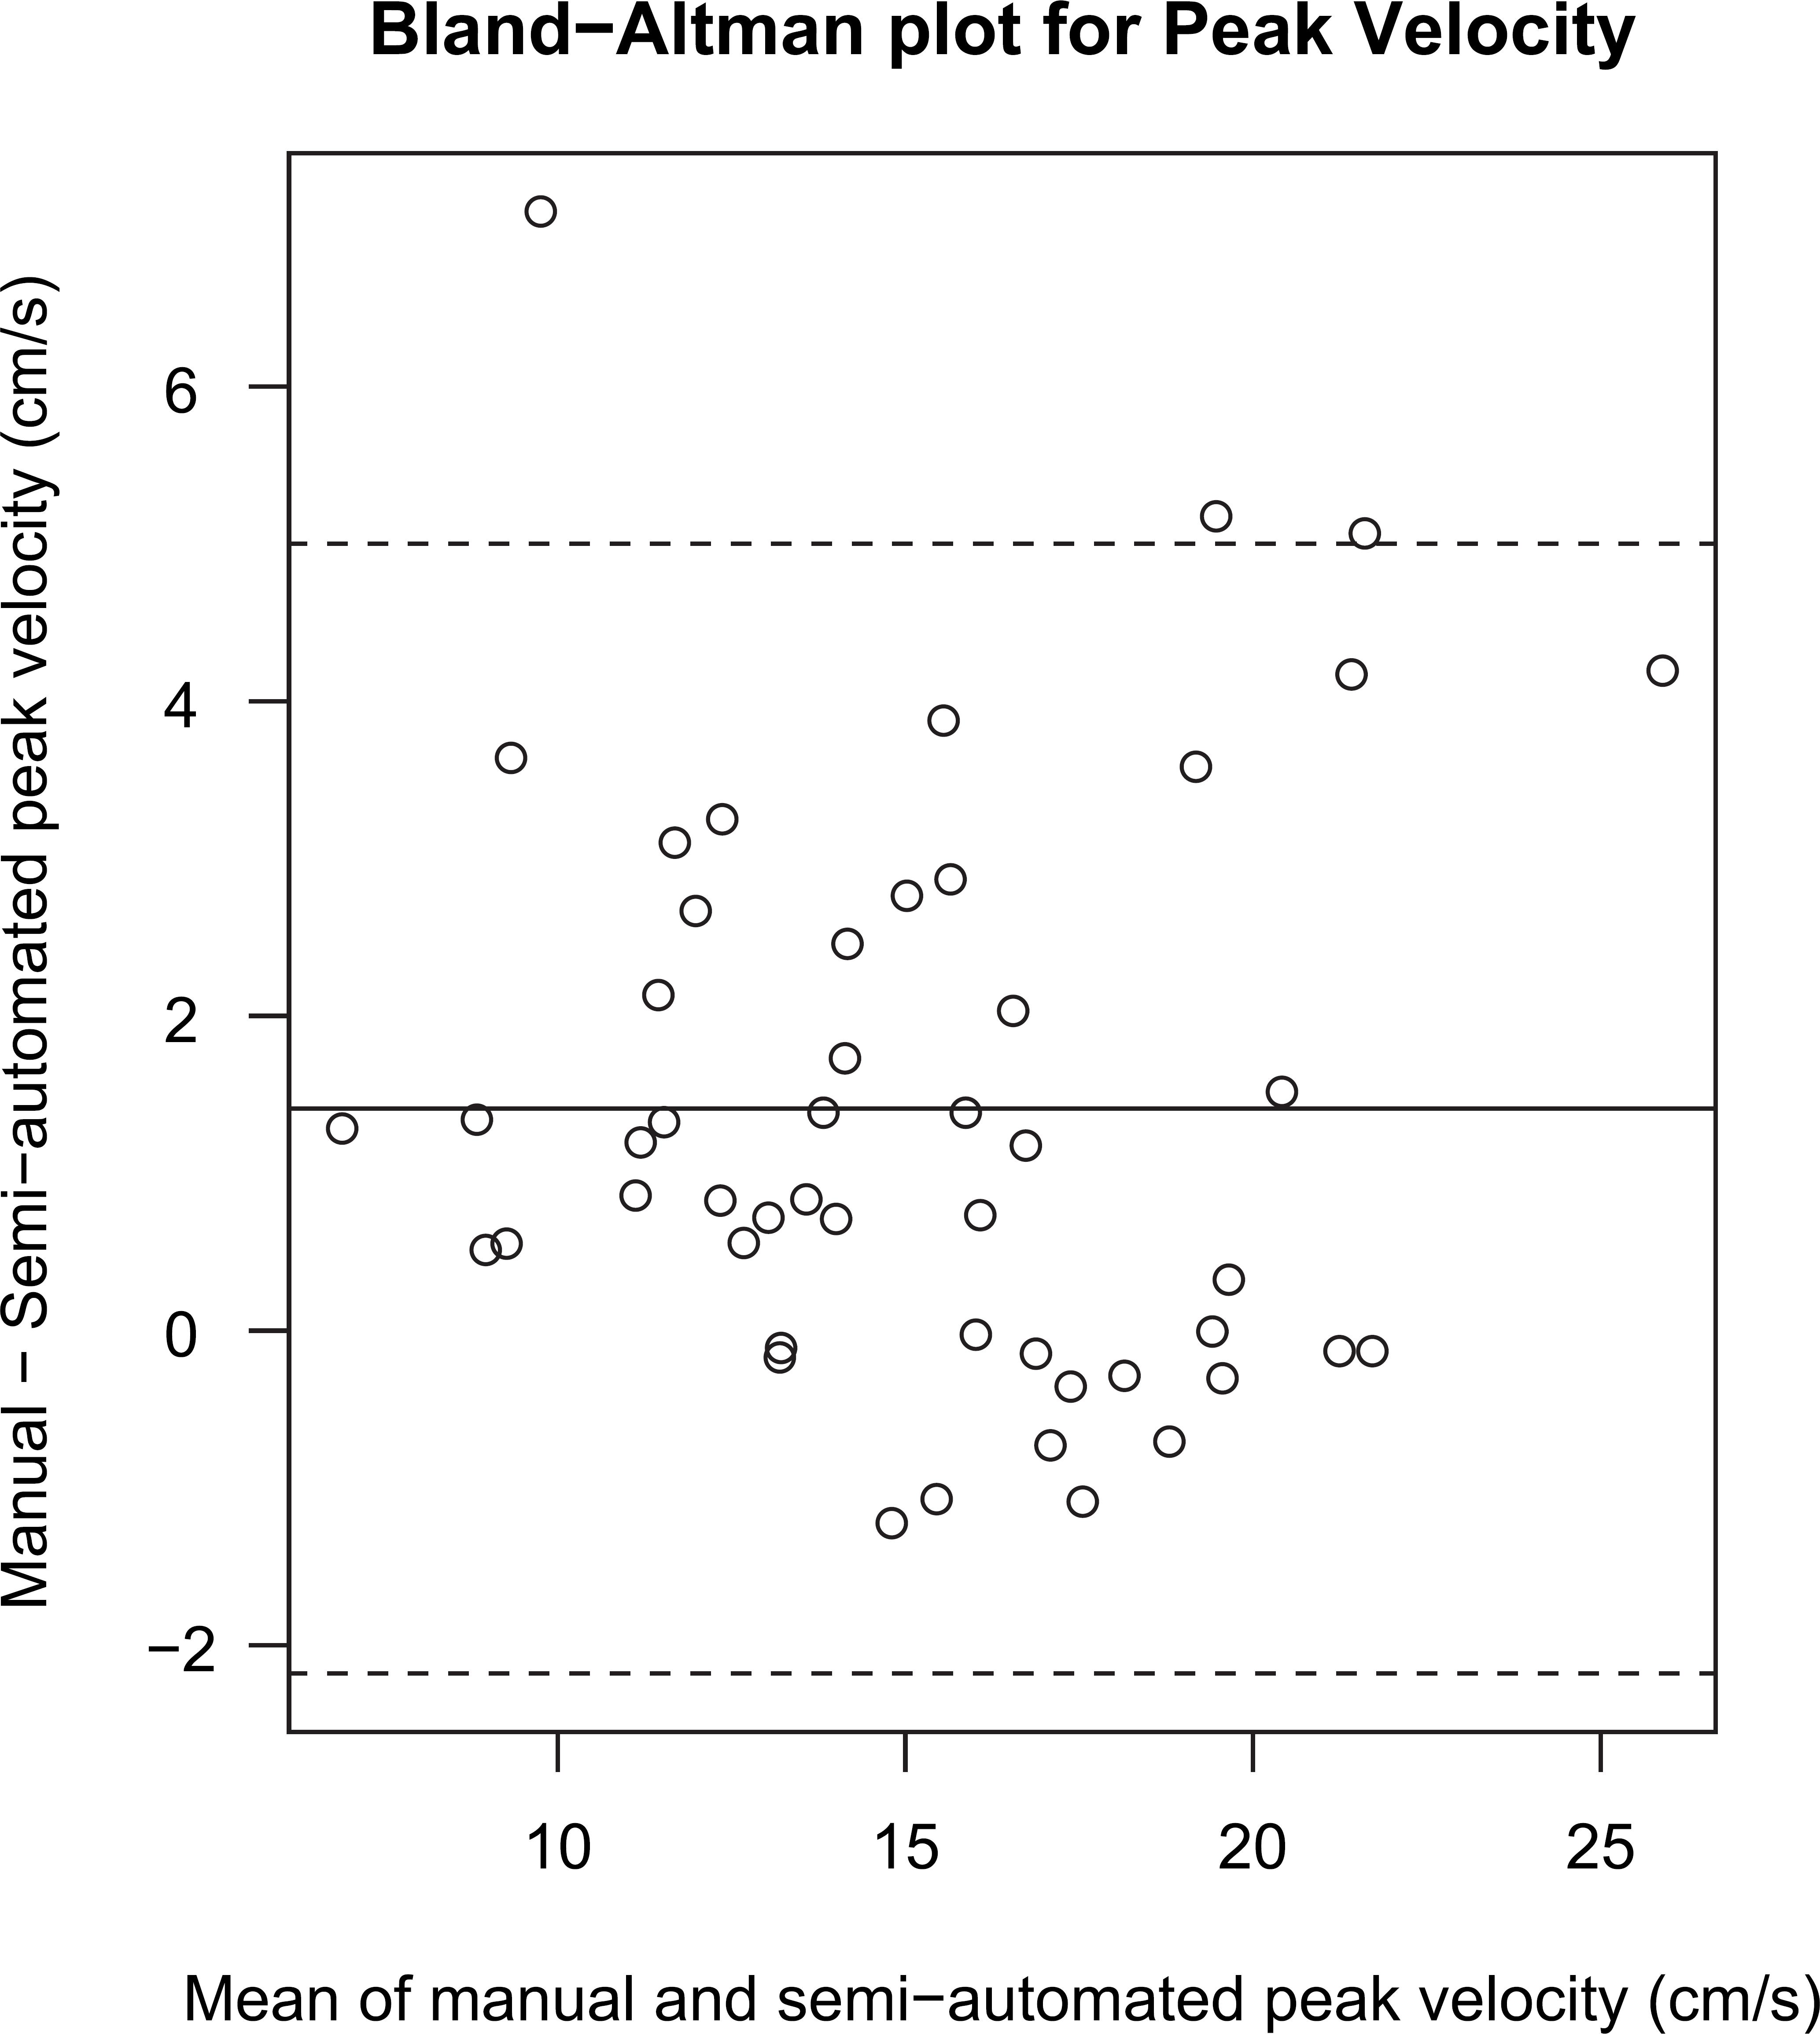
Bland—Altman plot for peak velocity. The solid line is the mean of the differences between manual and semiautomated values and the dashed lines indicate the 95% limits of agreement. The mean and limits of agreement have values 1.4 ± 3.6 cm/s. The Spearman rank correlation test does not reject the null hypothesis of no monotonic trend (P = 0.35).
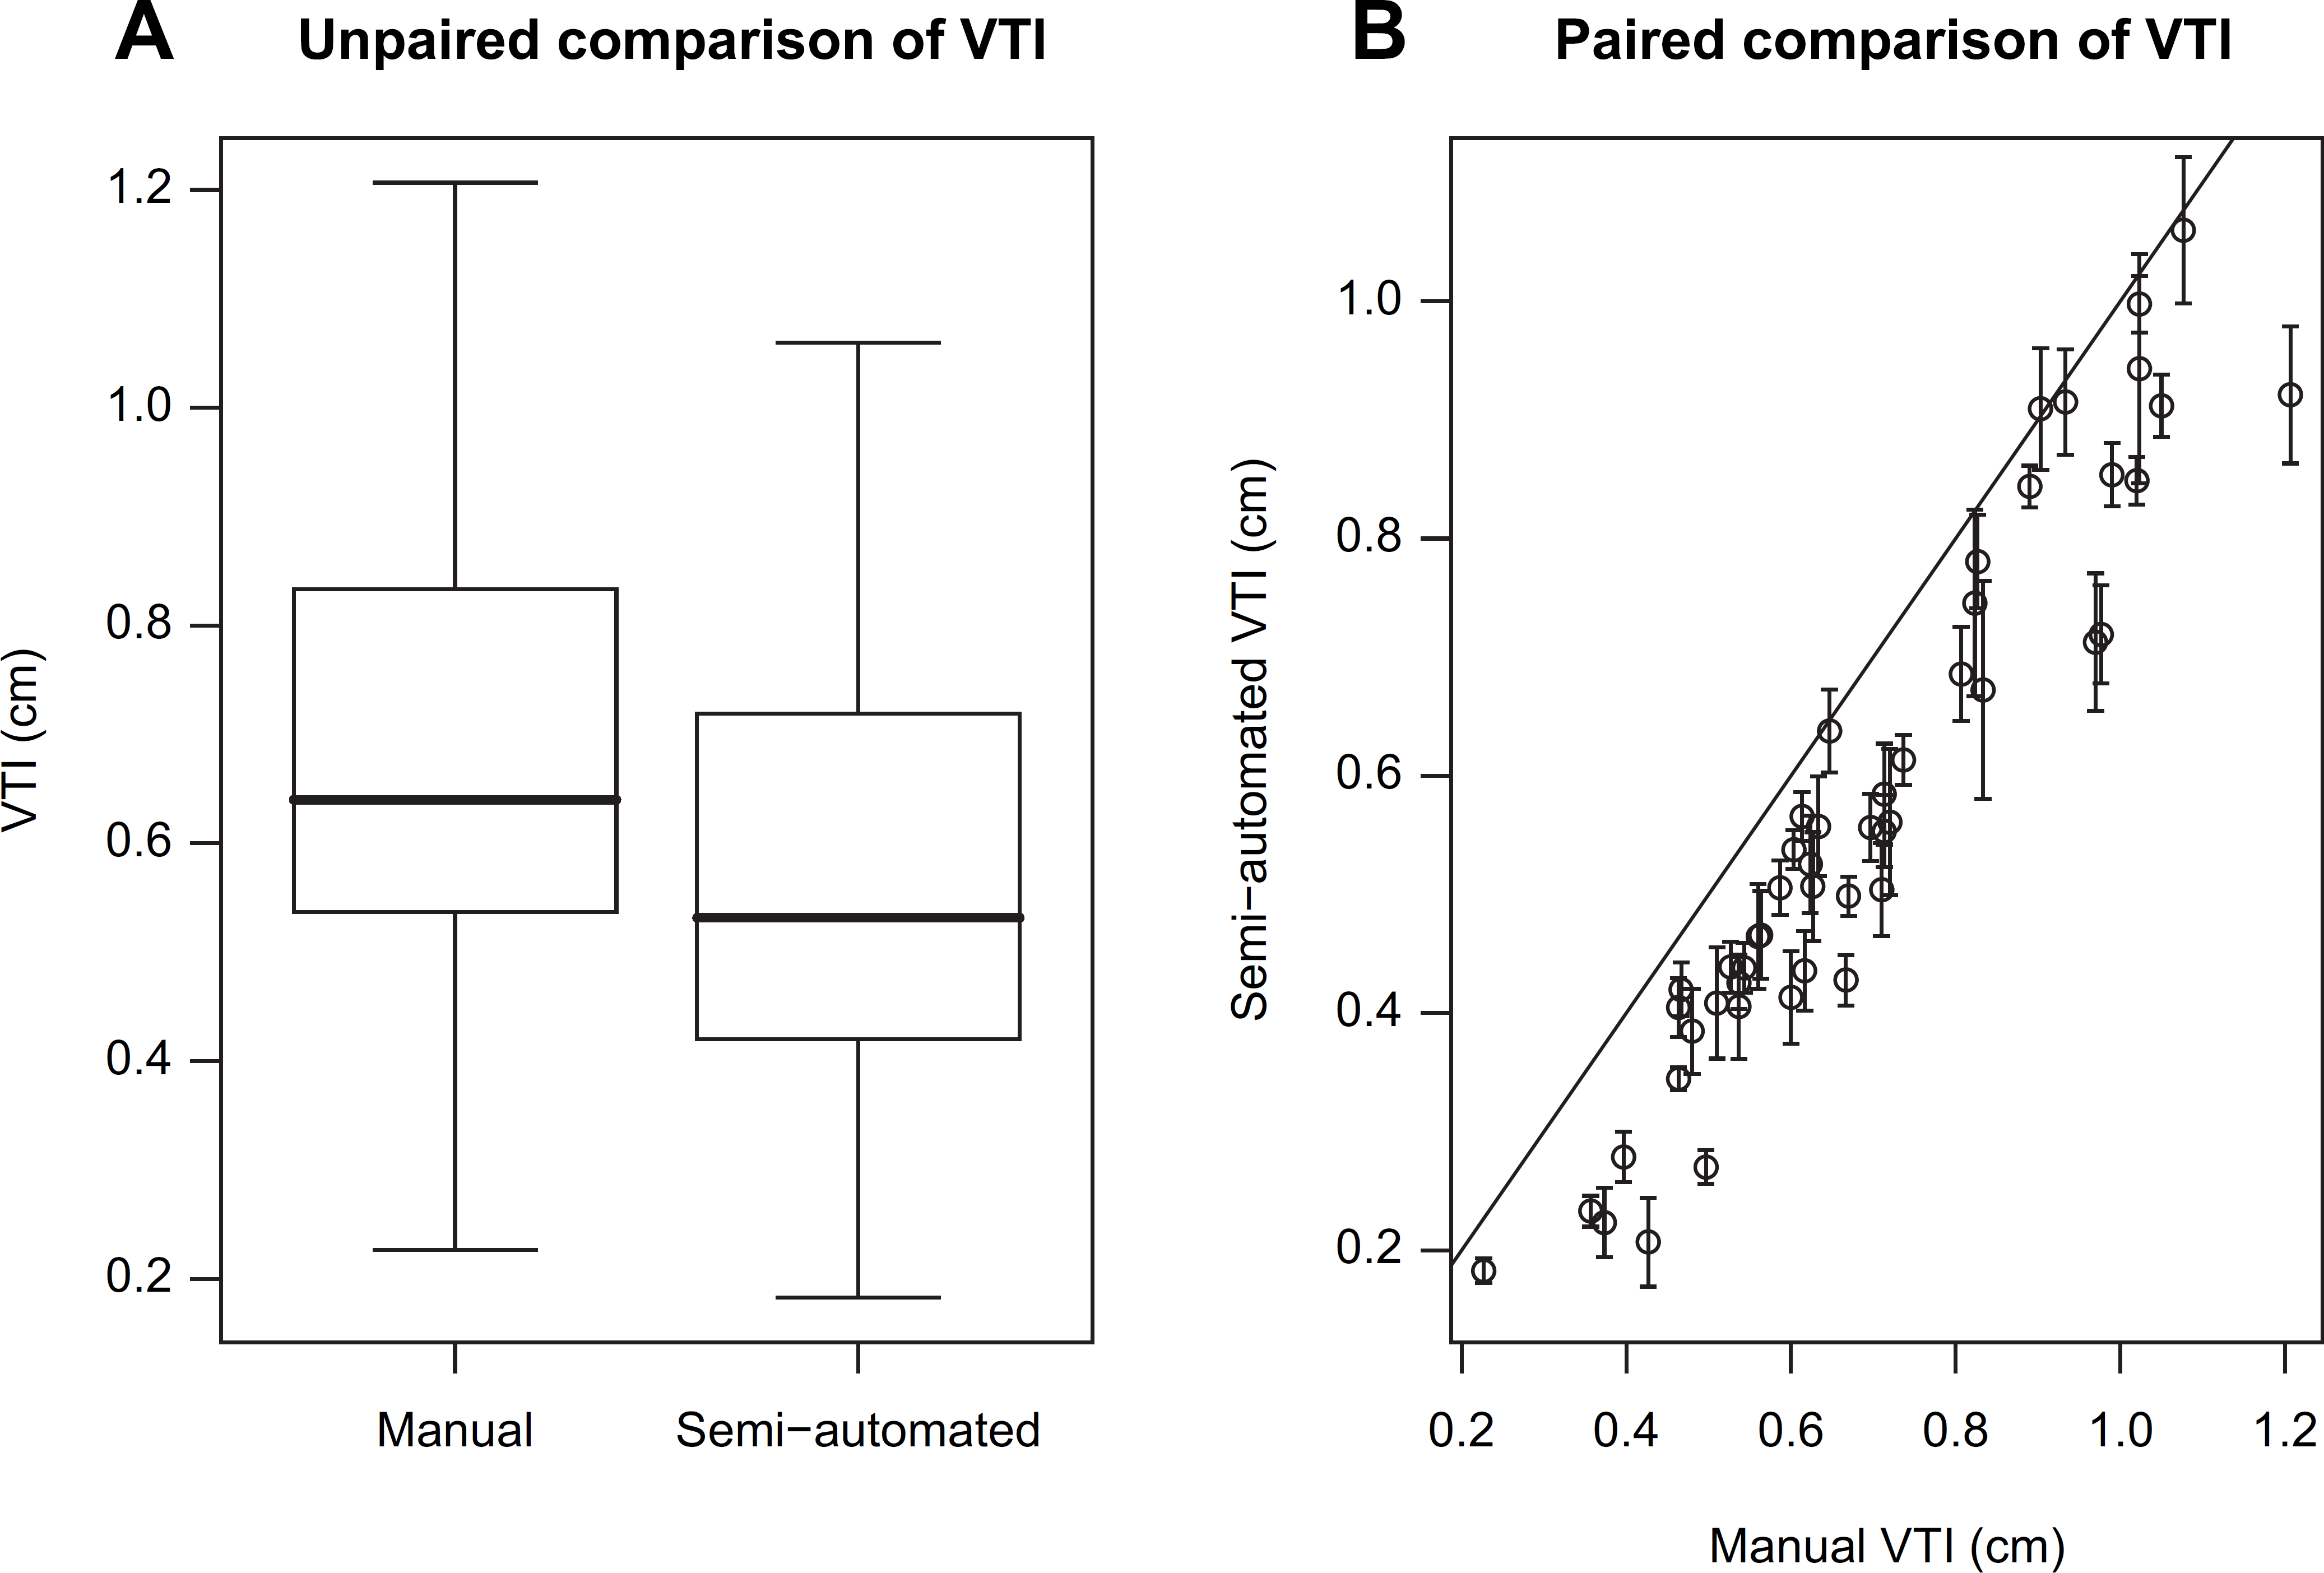
(A) Unpaired and (B) paired comparisons of VTI from manual tracing and semiautomated algorithm. The unpaired comparison uses standard box-and-whisker plots. The paired comparison uses a correlation scatterplot, with error bars provided for semiautomated values (see text). The solid line is the 45-degree line of agreement. The medians are 0.64 and 0.53 cm, respectively for manual and semiautomated values, and the corresponding interquartile ranges are both 0.30 cm, respectively. The Pearson correlation is 0.95 with 95% confidence interval (0.92, 0.97).
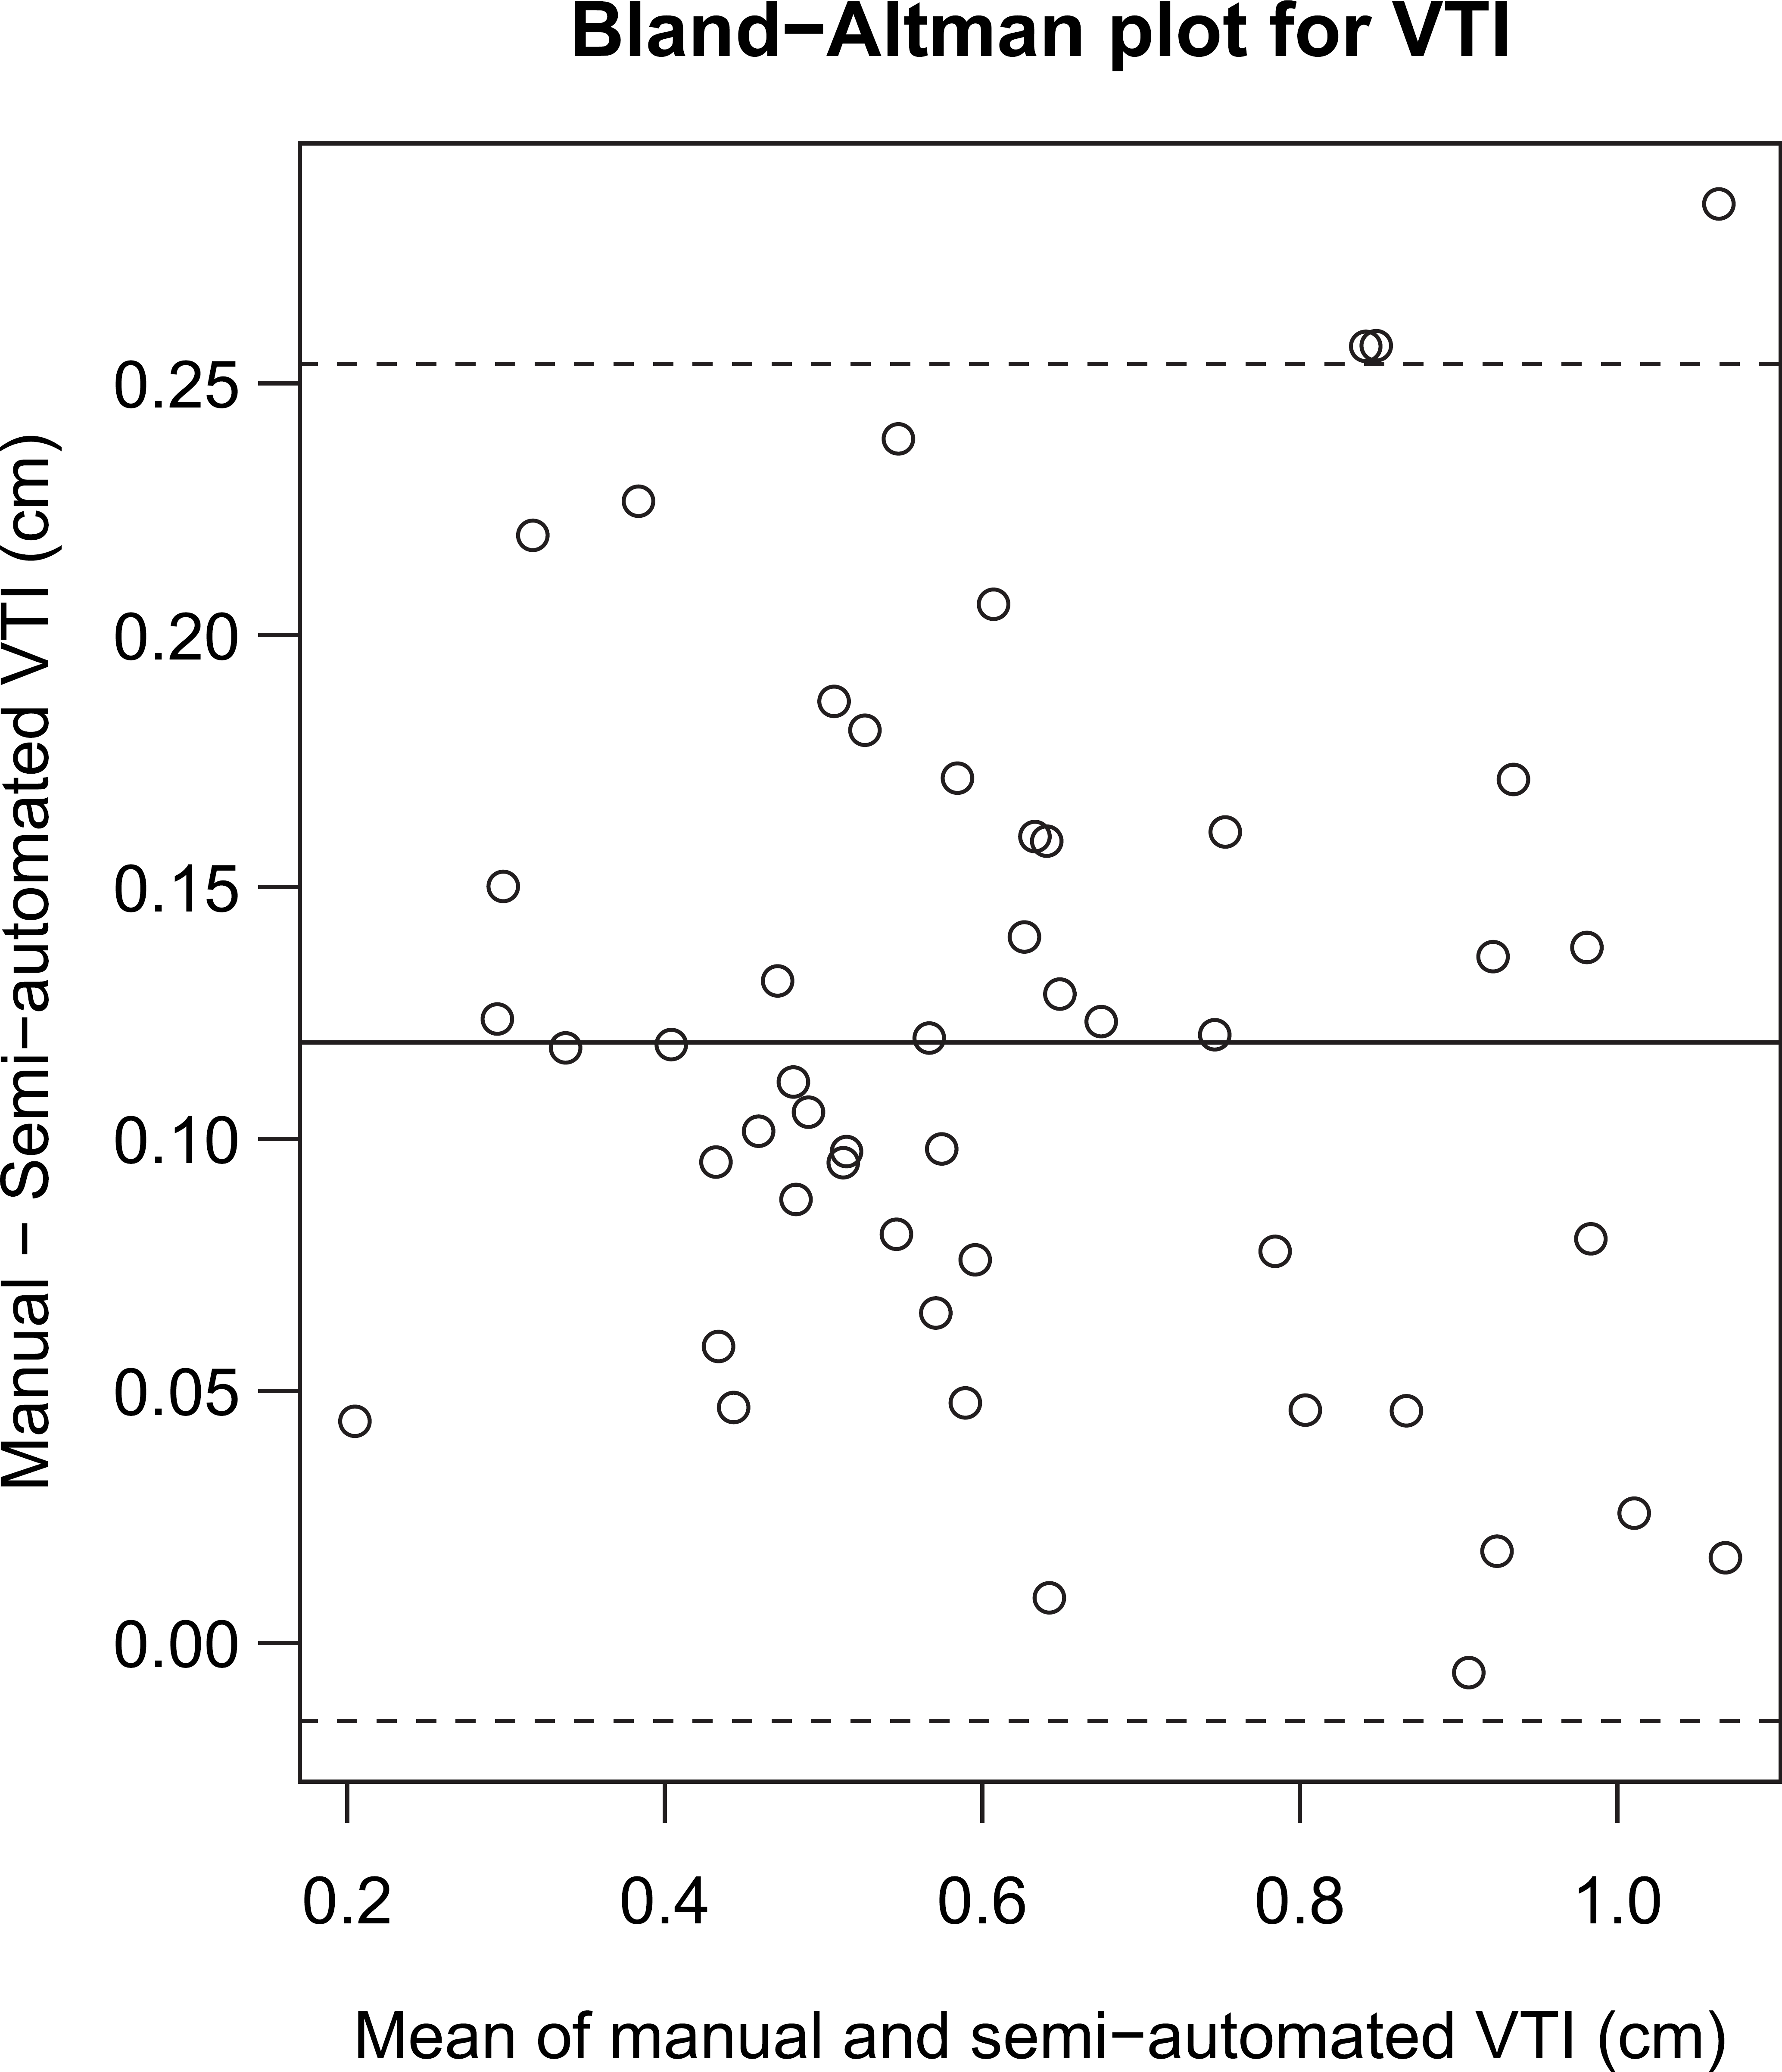
Bland—Altman plot for VTI. The solid line is the mean of the differences between manual and semiautomated values and the dashed lines indicate the 95% limits of agreement. The mean and limits of agreement have values 0.12 ± 0.13 cm. The Spearman rank correlation test does not reject the null hypothesis of no monotonic trend (P = 0.61).
Because the automated method compares well to a manual expert segmentation, the automated method can be deployed for analysis without the risk of sacrificing output quality. Moreover, the advantages of using a semiautomated toolbox for the analysis are many, over and above an increase in speed. They include the following:
The toolbox enables the enhancement of the design of the biological experiments themselves by alleviating the burden of analysis from experimental design considerations. In the drug discovery context, we are capable of acquiring imaging data at a rate of 400+ mice per week (among three ultrasound machines). The toolbox extends the imaging acquisition from a qualitative or diagnostic tool, to a formal pharmacological/ pharmacodynamic assay of biomechanical/anatomical information. The toolbox frees up each of the imaging systems and experts for acquisition by enabling offline analysis. This advantage again improves not only just analytical speed but also overall experimental speed. Furthermore, the toolbox allows us to remove the concern of ongoing test—retest validation that may be necessary in the case of manual quantification by varying operators. Ultimately, without efficient toolboxes, ultrasound imaging would be relegated to qualitative evaluation only and/or as a diagnostic tool only. This semiautomated toolbox eliminates completely the experimental bottleneck that results from manual assessments. Removal of this bottleneck increases the overall imaging drug development speed by allowing us to get earlier reads during go/no-go phase of compound screening. For example, we are able to make decisions between four compounds (and a control) instead of comparisons between just two compounds over the same time horizon.
Discussion of Hemodynamic Results
Figures 2,7 and 8 demonstrate the ability of the Doppler toolbox to both accurately reconstruct and segment aortic Doppler waveforms and discriminate hemodynamic changes with therapeutic intervention of L-NAME in the rat model of hypertension. Large sample size and long scan duration enables researchers to view trends in data because of respiration, drug effects, or other factors. Hemodynamic results are shown with the automated removal of respiration effects. Clear differences are shown between baseline and treatment in the Doppler analysis.
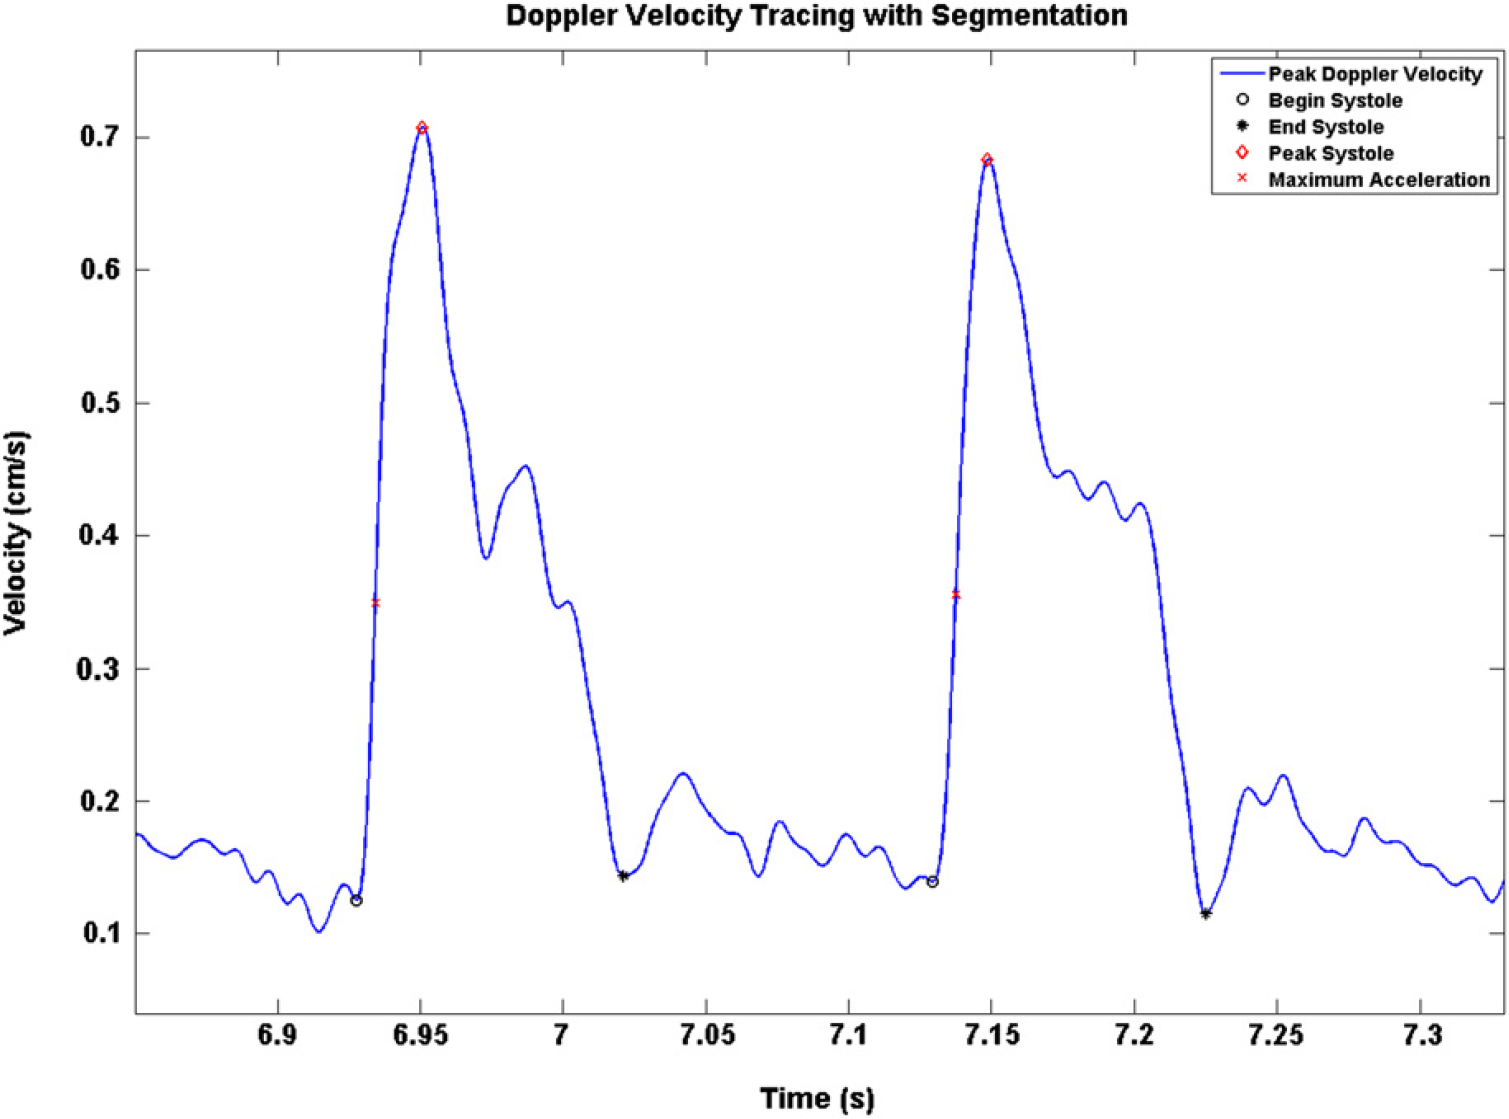
Doppler peak velocity tracing with segmentation.
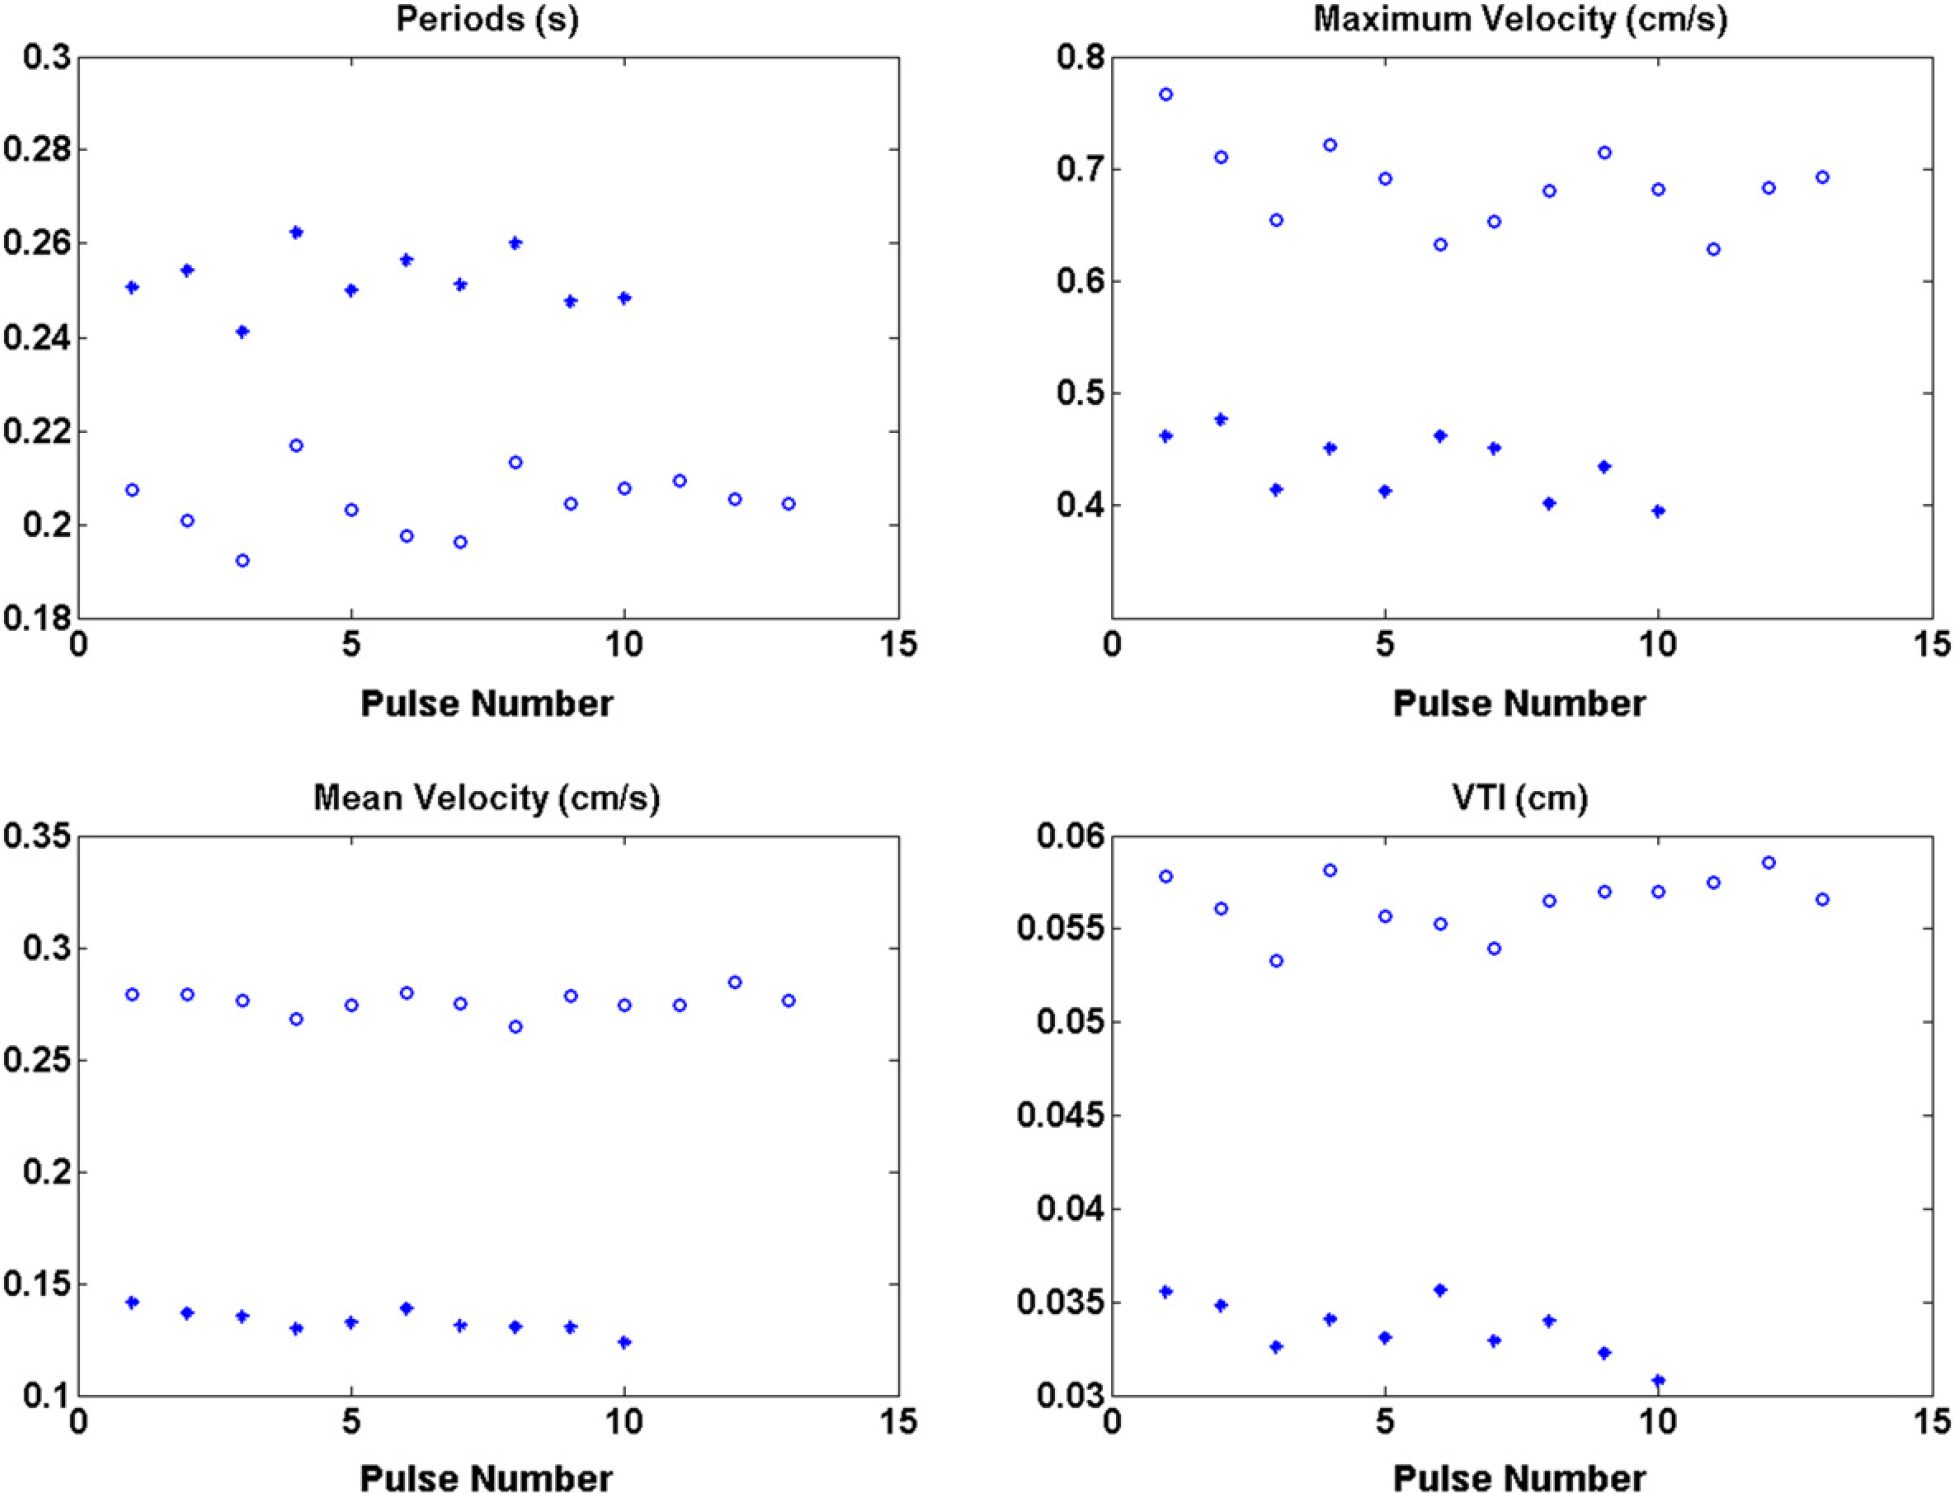
Periods, maximum velocity, mean velocity, and VTI for baseline (◯) and treatment (*).
The semiautomated toolbox extracted peak velocity waveform seen in Figure 7 and was calculated without the use of a user-defined trace, which eliminated subjectivity in producing the waveform. A comparison of the peak velocity waveform overlaid on the raw Doppler image is seen in Figure 2, in both its filtered and unfiltered form. This method may better distinguish the signal from background noise and eliminate error from computer visualization of the Doppler image. This step is indeed significant in that it creates a standard platform for further pulse wave analysis. The focus then shifts to interpretation of hemodynamics rather than interpretation of a complex Doppler image.
Although this toolbox analyzes data from raw form, it does not interpret results. It is intended to aid clinicians and researchers alike in Doppler ultrasound investigation. The vascular region of interest and position of the Doppler probe will have a profound effect on the meaning and interpretation of each biomarker. Some biomarkers, such as maximum and minimum velocity are universally applied and reveal the underlying flow character of the vessel. Other biomarkers, such as maximum acceleration may only yield inotropic relevance when taken close to the heart. This is not to say that these biomarkers are without merit, however, the meaning must be reevaluated to reflect the underlying vasculature. This toolbox can be applied to any Doppler measurement; only the user can interpret the results with significance.
On administration of L-NAME, a potent vasoconstrictor, VTI decreases, as does mean and maximum velocities, whereas cardiac period increases, as seen in Figure 8. This can be interpreted as a decrease in preload; heart rate slows to increase diastolic filling of the left ventricle. There was no change in maximum acceleration after treatment with L-NAME. Although mean and median biomarker values of the data set are analyzed here, tracking trends in biomarkers during acute intervention may provide an alternate analysis regarding cardiovascular regulation.
Semiautomated and automated analysis of Doppler waveforms is indeed a powerful technology; however, automated systems may not be able to discriminate inaccurate waveforms (or time segments) to the same degree as human operators. Ultimately both semiautomated and manual analyses alike are dependant on the input waveforms and the skill of the ultrasonographer to consistently and accurately measure the underlying physiology. In a controlled environment with trained experimenters, the Doppler toolbox has been shown to extract the peak Doppler velocity waveform from raw data, segment each waveform, and reported changes in hemodynamics after administration of a potent vasoconstrictor. As the graphs indicate, L-NAME demonstrates an acute vasoconstrictive hemodynamic response that is primary to the vasculature.
Conclusion and Recommendations
Drug development and discovery demands high-throughput technologies that can keep up with large-scale compound screening processes generating disease markers or compound efficacy markers that are sensitive enough not to be washed out by basal disease variability. Doppler ultrasound imaging is a proven technology for measurement and assessment of flow in the vasculature. However, without automated quantification integrated with the technology, it becomes difficult, if not impossible, to meet the high-throughput and sensitivity demands in a drug development and discovery setting while extracting the maximum amount of physiologic information from Doppler ultrasound. The Doppler toolbox as developed in our study allows for semiautomated processing and analysis. The data agrees well with manual measurements and have been shown to be both sensitive and accurate in distinguishing between a basal and a vasoconstrictive state. The automated system also allows for analysis of a significantly larger portion of the acquired data, because manual analysis of each individual waveform is infeasible. Moreover, because the analysis is semiautomated, it relieves the user of much of the analysis burden and helps to focus efforts on experiment and interpretation. When integrated with other imaging modalities, the toolbox may be part of a complete hemodynamic evaluation package that may be used to characterize cardiovascular state. This toolbox then allows researchers to investigate both cardiac and vascular responses to therapeutic interventions as well as providing a framework for the innovation of new flow biomarkers and physiological events. Mathematical algorithms to extract waveform parameters can easily be added to the toolbox, thus allowing innovative physiological experimentation. Additionally, hemodynamic evaluation may prove to be a significant factor in the process of drug development and cardiovascular risk. Further integration of Doppler and other measurements, such as pressure, ECG, and respiration may provide supplementary and complementary information and aid in interpretation.
The toolkit may also be used for testing of translational biomarkers that have the potential for use in the clinic. Translational methods enable enhanced integration of preclinical with clinical decision making on drug development programs. In an environment where biomarkers play a vital role, a toolkit that integrates biomarker quantification for both preclinical and clinical studies is required. This toolkit is also valuable in the integration of biomarker development efforts with mathematical models of disease. Such mathematical models are used on a daily basis for a very wide range of reasons, including prediction of disease development and compound effect, pharmacokinetic and pharmacodynamic modeling, and many more. Validation, calibration, and use of mathematical models in the imaging realm requires much preprocessing. This is because information needs to be extracted from images for input into the models. Having a toolkit that provides the preprocessing enables and facilitates the integration into the mathematical models.
A Doppler imaging toolbox, as developed in our study, enables large-scale, sensitive quantitative imaging in a drug development and discovery environment with computational capabilities that exceeds current methods. This developed toolbox may also render a line of sight toward noninvasive preclinical and clinical stratification of cardiovascular health that has the potential to change the course of morbidity and mortality.
Summary
Quantification of hemodynamics of blood flow in large arteries during development of cardiovascular diseases or in atherosclerosis, and post compound intervention may prove to be invaluable in a drug development setting. Imaging modalities, such as Doppler ultrasound provide noninvasive assessment without damaging the physiology of interest. One of the challenges in the application of imaging technologies in a drug development setting is the large volume of data that needs to be quantified in a short amount of time. In this article, we focus on methods developed for large-scale hemodynamic quantification, as measured from high-frequency Doppler ultrasound in rodents. We describe an integrative semiautomated method developed in Matlab to extract Doppler peak-velocity waveforms, segment and calculate hemodynamic parameters in rats with administration of L-NAME, a potent vasoconstrictor. This results in beat-to-beat calculations of cardiac and vascular parameters without the influence of subjective bias or the associated time cost. This Doppler toolbox has been validated against manual measurements of maximum velocity and VTI and show good agreement (1.4 ± 3.6 cm/s and 0.13 ± 0.14 cm, respectively). These validation methods and results are also discussed. Experimentally, this toolbox allows for a comprehensive hemodynamic evaluation of in vivo physiology as the result of medical intervention, thus enabling compound screening in preclinical drug development. The power of the toolbox is enhanced through noninvasive ultrasound, which allows for repetition of measurements while the native physiology remains intact and diminishes the need for large subject groups. Additionally, novel experimental algorithms may be developed and applied to the automated system for evaluation. This high-throughput capability allows for compound screening and assists in the discovery of differentiated effects on the heart and vasculature, which would otherwise be very challenging.
Acknowledgments
The authors thank Kerri A. Parsons, Kavita Saini, and Sharmilee L. Ramcharan for their contributions to the validation.
Competing Interests Statement: The authors certify that they have no relevant financial interests in this manuscript.