
Abstract
Advances in automation have enabled screening methods, such as enzymatic assays and ELISAs, to be performed in a high-throughput fashion. Instruments can perform each of the steps more rapidly and with fewer errors than humans, however, in many cases, humans still perform the key steps of integrating the instruments and Laboratory Information Management Systems (LIMS). Typically, the screening process involves multiple steps for sample testing, manual data entry and design of protocols to handle the positive samples, and final processing of positives. Fully integrated systems such as Protedyne's BioCube™ System combine liquid handling, LIMS, plate washing, and plate reading in a device that is controlled via a single user interface. As an example, we present the results of automating plate reading and retesting of positive samples in a model protocol based on ELISA testing. By performing an automated initial screening of results, our system enables positive samples to be retested at higher stringency or sent to a technician for corroboration of results. The screening process then becomes a single protocol that starts with a sample set and results in a data set of tested and retested/reflux tested positives as well as re-arrayed plates of positive samples that are ready for additional downstream processing. (JALA 2004;9:135-9)
Overview
Purpose
The purpose of this example was to automate key steps of ELISA testing on a BioCube System LX2000 (Protedyne Corporation, Windsor, CT), using a data driven protocol to feedback the results of the initial test, and then prepare specified samples for secondary testing or dilution and retesting without operator interaction. For data tracking purposes, the data was exported into a generic file format for import into LIMS.
Methods
We automated key steps, which are typically performed off-line, in a generic protocol based on the OptEIA Human IL-2 ELISA kit (BD Biosciences, San Jose, CA). The ELISA protocol was programmed offline using the CILA-View™ application development software and subsequently exported to the BioCube System. The data-driven sample re-array subroutine was programmed both in CILA-View and directly on the BioCube System using Computer Integrated Lab Automation (CILA™) system software. We exported the data from the reader and then imported it into Microsoft Excel for presentation.
Results
The data-driven re-array subroutine worked as intended using dye as a control sample. The other steps of the ELISA protocol, which included dilution and reflux testing, were successfully automated and tested. The software successfully exported the data from the plate reader in a format readable by Microsoft Excel.
Introduction
Objective
Our primary objective was to take advantage of the BioCube System's integrated data handling capabilities to dynamically perform subsequent protocol operations based on the results obtained during the primary protocol execution without manual intervention. We chose to automate ELISA type testing since it is prevalent in both drug discovery and clinical diagnostics. We created a data-driven protocol that performed real-time hit picking and sample retesting based on direct feedback from the plate reader and on-line analysis of the data on the system.
Background
Data-driven protocols are critical for fully automating a process. As the sample sizes of test runs increase, the number of permutations of testing and reflux testing quickly becomes too great for a human operator to process efficiently. Most standalone liquid handling instrumentation either does not handle data directly, or at best only logs partial data. Therefore, automation such as the BioCube System, which completely integrates data handling, liquid handling, and plate management functions and the tight integration of third party devices, such as plate readers, is necessary for full protocol automation. In the past, we have automated ELISA testing, and the results have been exported for storage in customer LIMS. However, our LIMS Interface Layer (LILY™) data management software allows us to import, as well as export, data with a live XML data connection. We can use the data integration to automate steps that are often performed off-line by technicians. In this case, we are re-arraying hits from sample plates based on data from the integrated plate reader in real time. Additionally, we are re-arraying out-of-range samples, diluting them, and sending them back for retesting.
Methods
Hardware
We performed all of the experiments on our BioCube System LX2000 automation platform (Figure 1). The enclosed system consists of a 30-position deck, 256-plate carousel with integrated barcode reader at ambient temperature (Figure 2), 4-axis robot arm with on-the-fly changeable tools using SmartTool™ technology, plate gripper Smart-Tool, 200 μL(Figure 3), 96-channel pipettor SmartTool (Figure 4), and integrated PowerWave HT™ plate reader (Bio-Tek Instruments, Winooski, VT) (Figure 5). The system performed all of the steps of the protocol without operator intervention, with the exception of loading the plates into the carousel and placing the diluent trough on the deck prior to starting the protocol. The robot arm automatically changed tools when needed for plate and liquid handling as required by the protocol.
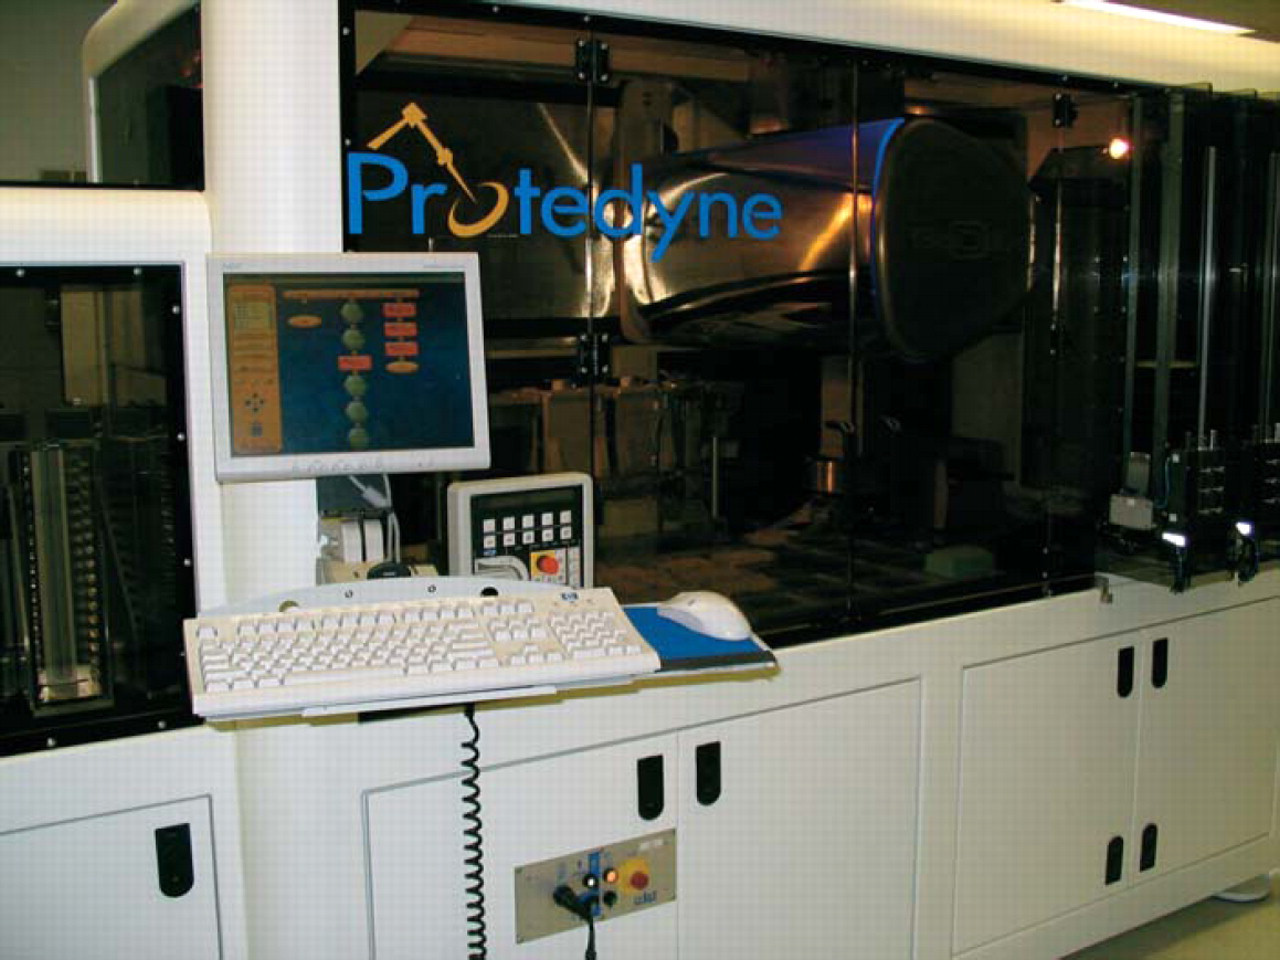
Exterior view of the BioCube System LX2000.
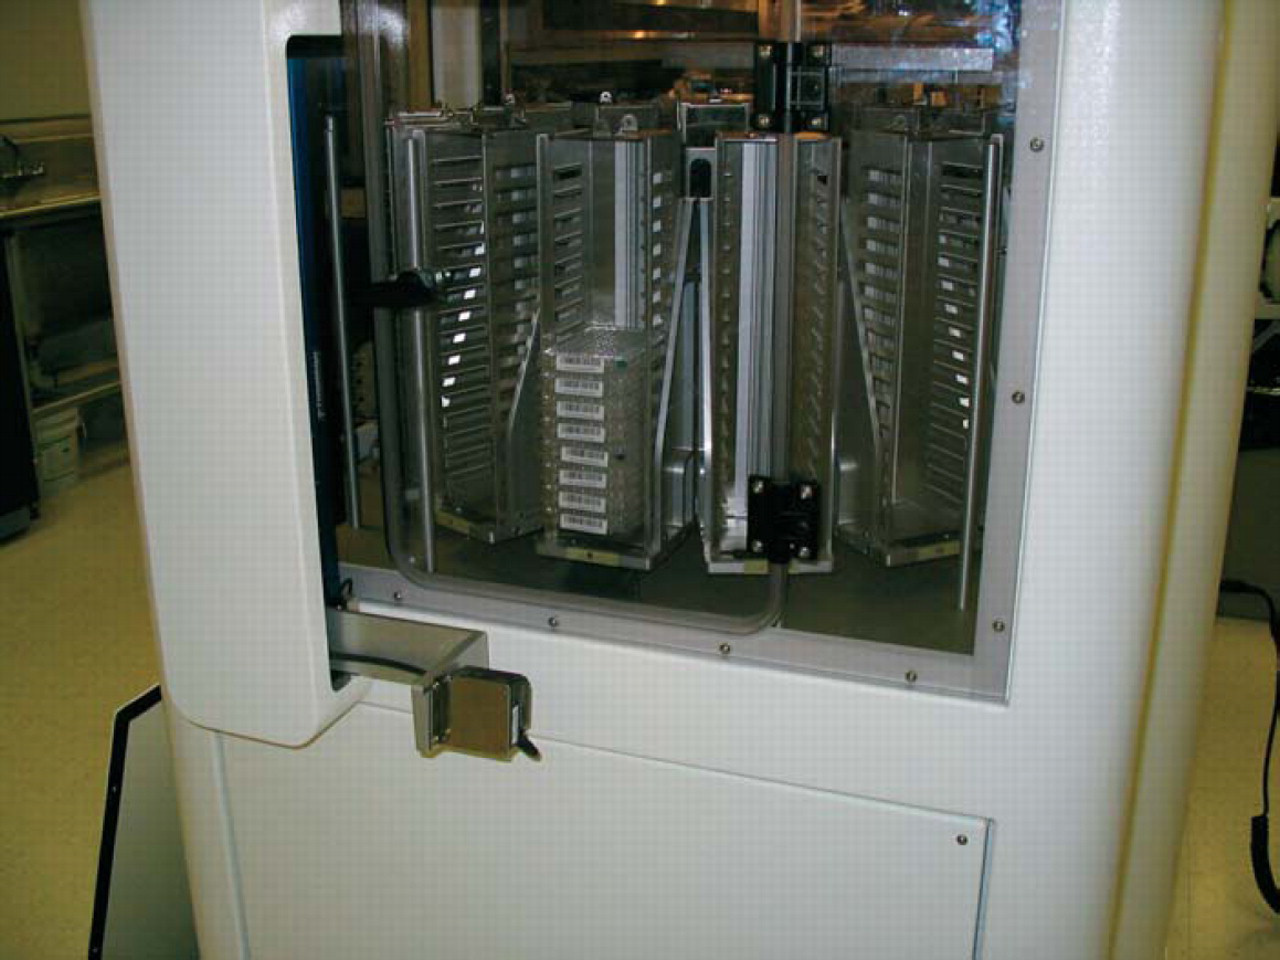
Operator loading door on the carousel. After loading, bar codes are read for plates and empty slots.
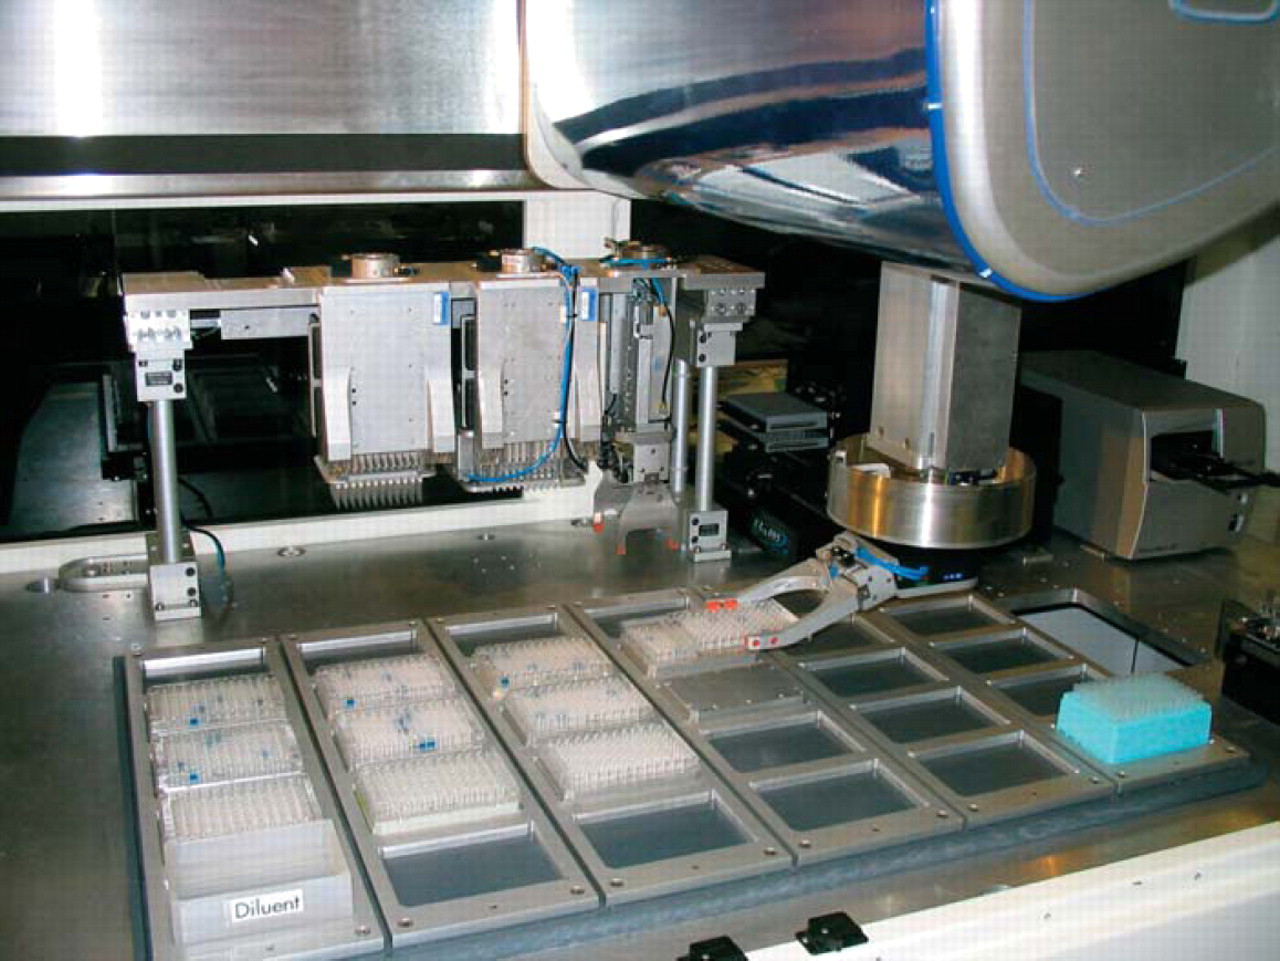
Deck view with plate gripper tool attached to main robot arm.
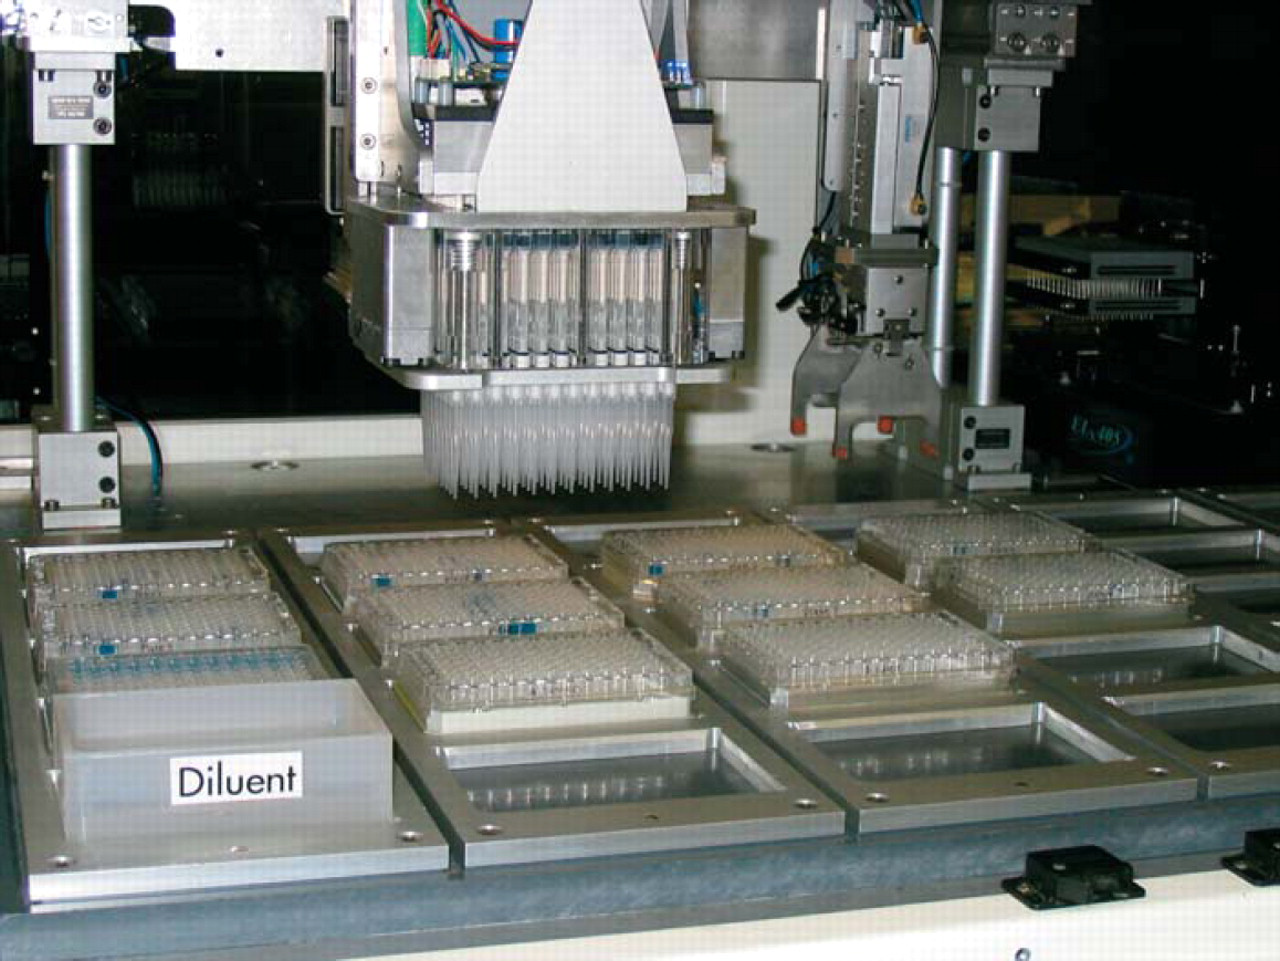
Deck view with 96-channel pipettor tool attached to the main robot arm as diluent is added to the dilution plate.
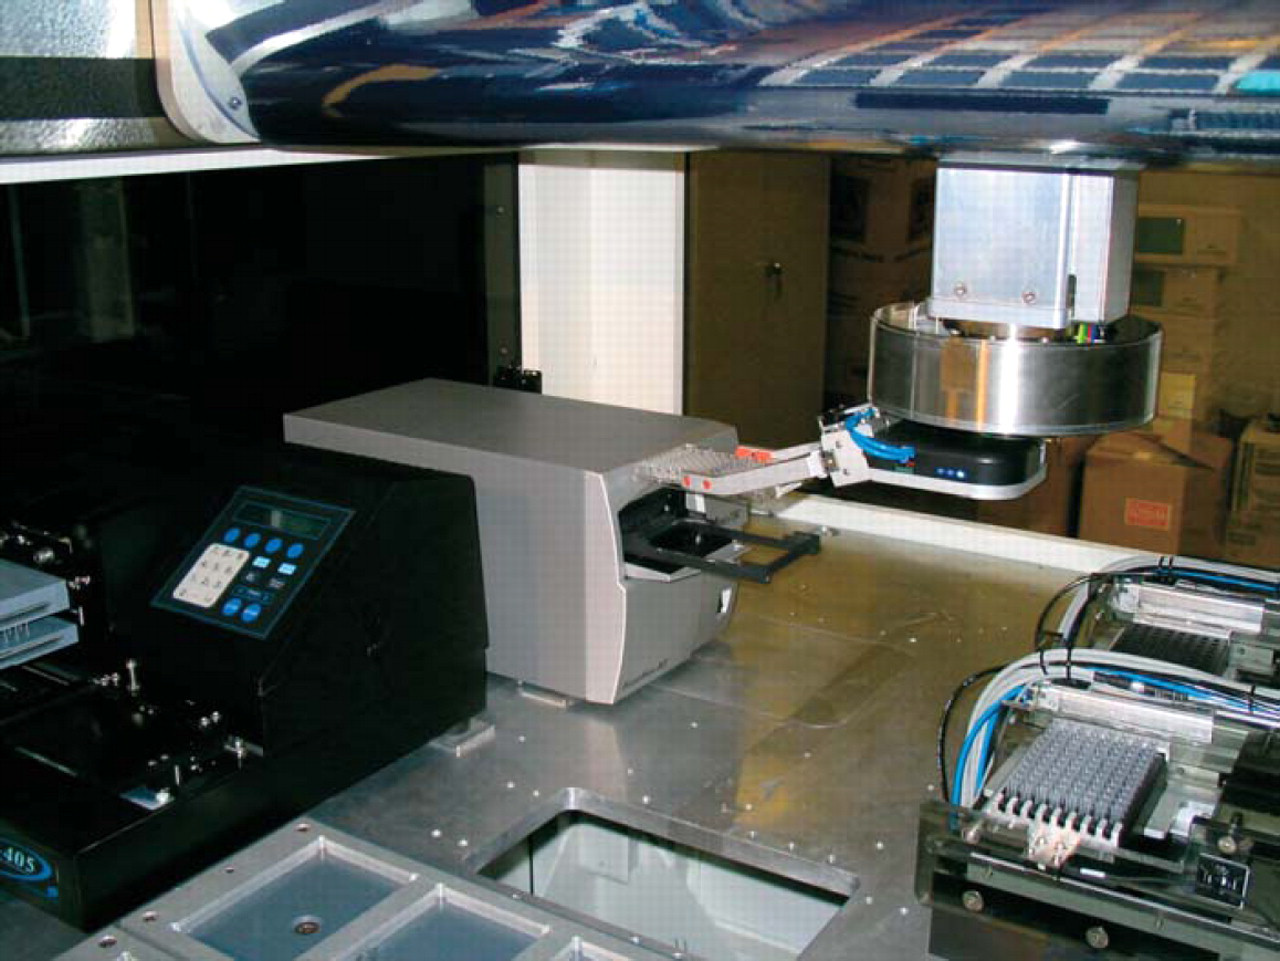
Deck view with sample plate being loaded into the integrated plate reader. The integrated plate washer is located to the left of the reader.
Software
The system uses an Adept controller running CILA robot control system software, an in-house modified version of the Adept A+ operating system. We created the real time plate reading and re-array protocol off-line using our CILA-View application development software (Figures 6 and 7). We downloaded the programs into CILA for execution. Data from the reader was passed between the device and the robot controller via a serial connection and stored as either a binary array for use in the re-array step or as raw absorbance data for export into Microsoft Excel.
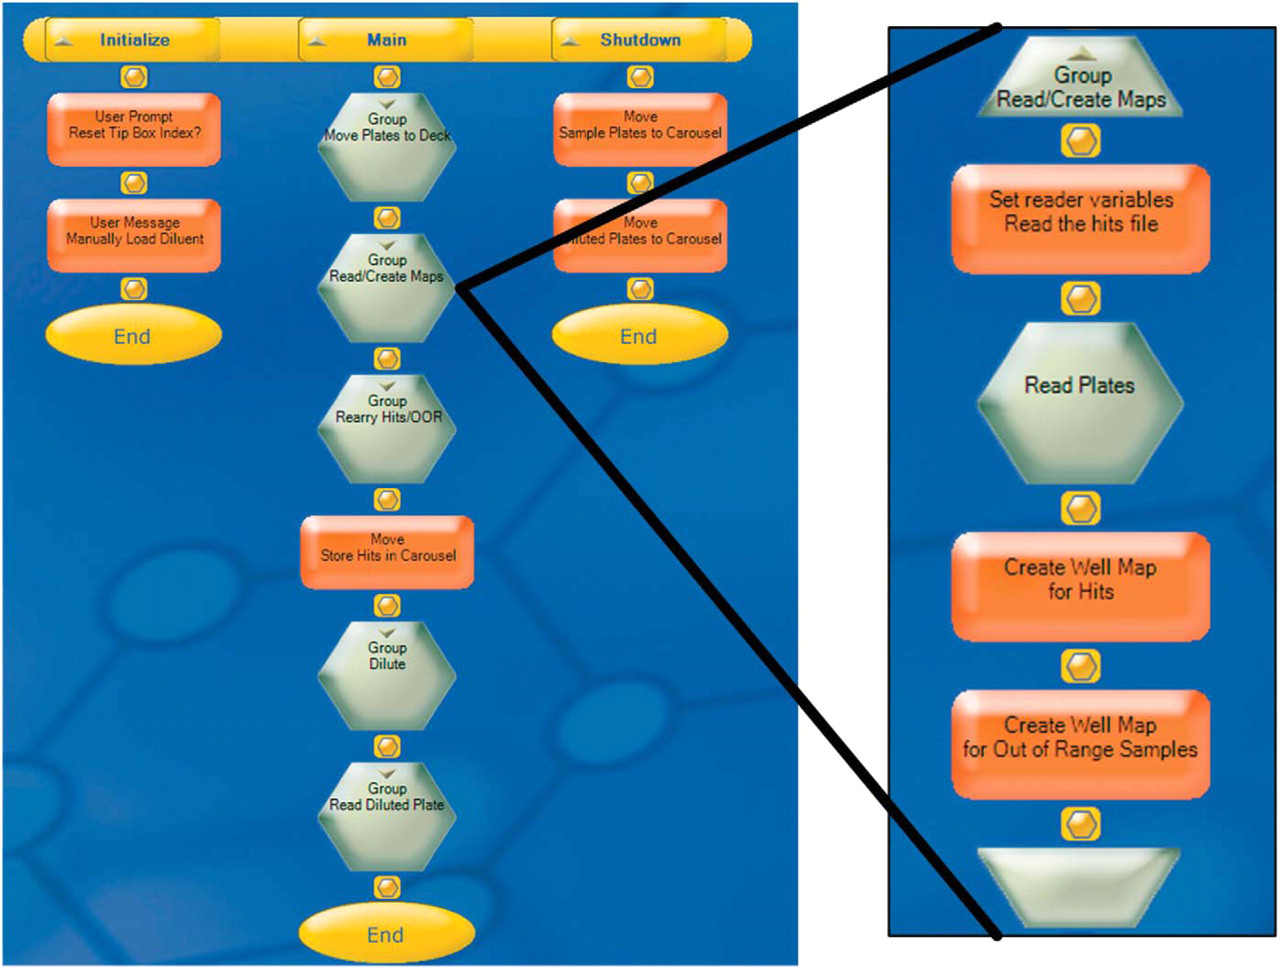
Real-time hit picking protocol shown in the CILA-View programming tool. One of the read/re-array steps is shown in the exploded view. Samples are first brought out to the deck then read to generate an absorbance map. Hits are determined by thresholding and are then re-arrayed. Out-of-range samples are diluted and then re-read.
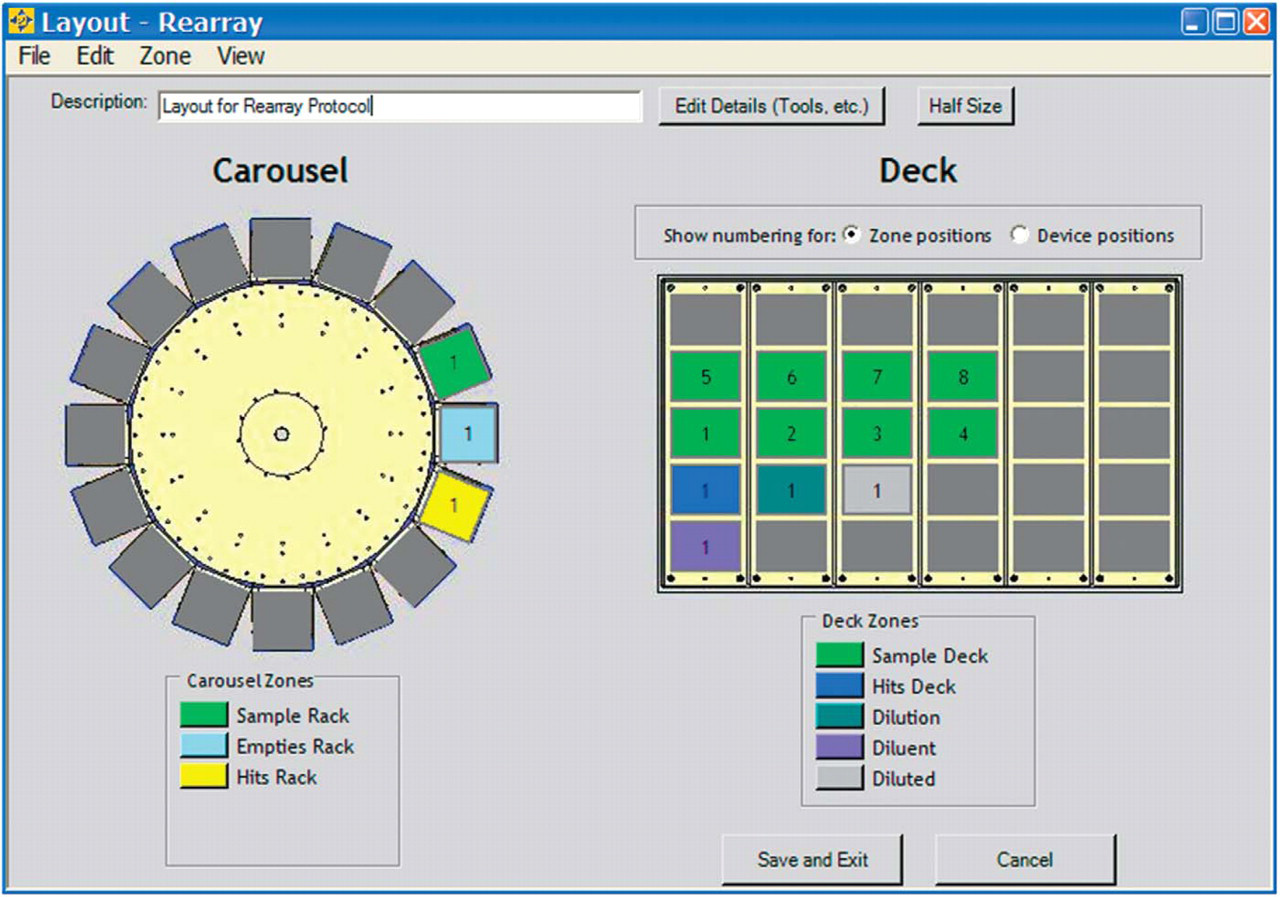
Deck layout window in CILA-View showing the zones as defined in the protocol.
Reagents
We used optically clear, flat bottomed 96-well plates (Costar) with the appropriate deck nests to accurately locate them on the deck. Protocol testing was performed with Brilliant Blue FCF dye (FD&C Blue #1) at 1×, 2×, and 4× concentrations to simulate positive “hits” and out-of-range samples. Absorption data was taken at 410 nm and normalized to 1 cm path length. The protocol was modeled after the OptEIA Human IL-2 ELISA kit, which will be used in future stages of this project.
Results
The ELISA model protocol was successfully automated and the real-time re-array step was successfully implemented. Data from the reader was successfully exported into a Microsoft Excel readable format. During execution, the protocol correctly identified and re-arrayed all samples that fit the positive criteria into one plate and those with absorption values above the specified range were re-arrayed to a separate plate. The out-of-range samples were diluted two-fold and re-read to simulate sample retesting (Figure 8). Dilution and retesting could be looped until all samples are able to be read correctly.
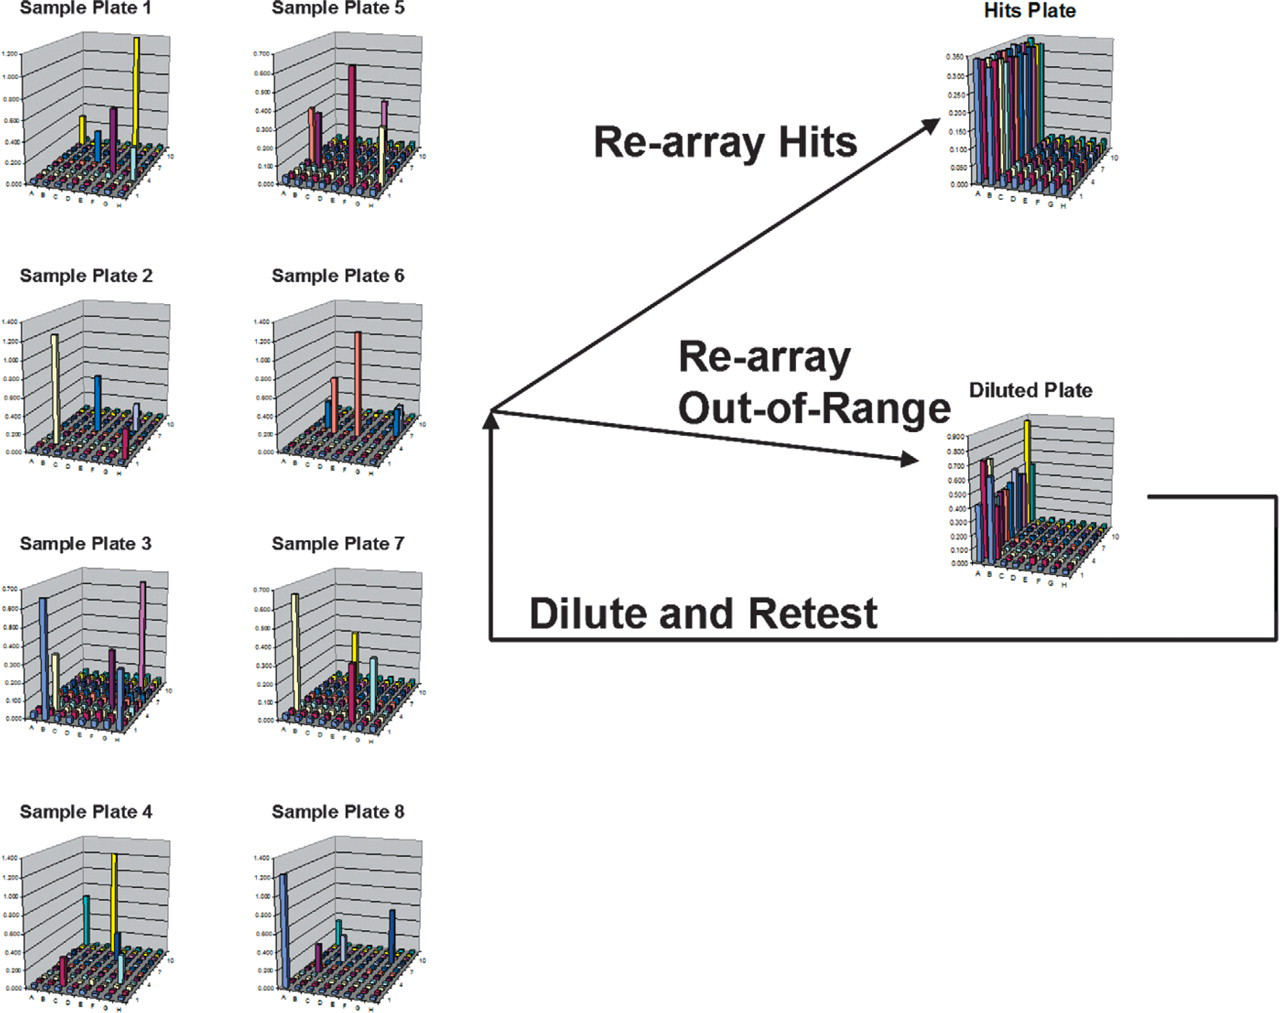
Raw data from each of the eight plates shows wells that are hits and out of range. Hits were re-arrayed into a fresh plate while out-of-range samples were sent to a separate plate for dilution and re-reading.
Conclusions
Our real time re-arraying protocol is generally useful in any protocol where data is generated and immediately used to control the outcome of the protocol. In our case, the data was generated by an absorbance spectrophotometer and used to re-array samples, however the same principles could be applied to, for example, DNA concentration quantitation by the PicoGreen fluorescence assay and subsequent normalization. And likewise, whereas our protocol diluted some of the samples and retested them, the protocol could have performed a secondary screening on the positive samples. By integrating data management along with liquid and plate handling, we are able to dramatically increase the level of automation in a protocol to increase throughput and lower user induced errors.