
Abstract
The consumer ethnocentrism tendencies scale (CETSCALE) was developed by Shimp and Sharma in 1987 to measure consumer ethnocentrism. It is one of the most commonly used scales in the marketing literature. As well as the original 17-item version, there are many empirical applications using other adapted versions of CETSCALE. These versions differ in terms of the number (and composition) of items, incorporating additional items and even accounting for the nationality of the foreign products under study. Some of these papers question the unidimensionality of such a scale. We intend to analyse the dimensionality of the CETSCALE. In order to do this, an extensive review of previous studies that have considered CETSCALE—whatever the version—is developed. In addition, we analyse the dimensionality of an adapted version of the CETSCALE including the product category (vegetables) under study. Our results support the multidimensionality of the CETSCALE.
Keywords
Introduction
Consumer feelings towards foreign products have long been an issue of great interest both in the field of consumer behaviour and in the field of international marketing (Luque-Martínez et al., 2000). This interest has been reinforced as a result of the increasing globalization of markets and increased international competition between products and services and additionally as a consequence of a new “global scenario” in which consumers feel more involved with their cultural identities and ethnicity (Netemeyer et al., 1991; Vida et al., 1996). In this context, the concept of ethnocentrism plays a major role in the decision to enter foreign markets (Thomas and Hill, 1999), especially because consumer beliefs, perceptions and emotions linked to the goods’ country of origin determine buying behaviour. Therefore, when entering into international markets, it is necessary to know if consumers have an ethnocentric attitude in their buying behaviour, because this may be a restriction to successful market penetration. However, the fact that a consumer is ethnocentric and therefore has a greater preference for domestic products does not always have to mean the rejection of those from abroad. Indeed, when domestic production is clearly limited and demand is high, non-ethnocentric consumer behaviour would be expected as domestic consumption depends on imports from foreign countries.
To measure consumer ethnocentrism, the literature has extensively used the consumer ethnocentrism tendencies scale (CETSCALE). The CETSCALE was developed by Shimp and Sharma (1987) in the context of U.S. consumers; there are many international studies validating this scale. In particular, many empirical applications support the unidimensionality and the internal consistency of the scale (e.g. Netemeyer et al., 1991; Durvasula et al., 1997; Luque-Martínez et al., 2000; Supphellen and Rittenburg, 2001; Orth and Firbasova, 2003; Kwak et al., 2006; Nadiri and Tümer, 2010). However, as previous studies over the last 20 years have used adapted versions of the original CETSCALE, which differ in terms of how many and what items are included, the results have varied substantially, thereby questioning the unidimensionality of the scale. Indeed, in parallel with literature that provides support for the unidimensional character of the CETSCALE, there are many studies undertaken in different cultural contexts that question the existence of a single dimension, e.g. Marcoux et al. (1997) in Poland; Mavondo and Tan (1999) in Malaysia; Supphellen and Gronhaug (2003) in Russia; Douglas and Nijssen (2003) in the Netherlands; Bawa (2004) in India; Saffu and Walker (2005) in Russia; Khan and Rizvi (2008) in India; Wei et al. (2009) in China. These studies obtained two or, in many cases, three or even four different dimensions that explain the individual's ethnocentric tendencies within a specific cultural geographical context.
Among those studies supporting the multidimensionality of the CETSCALE, there are empirical applications that use the standard 17-item scale version originally proposed, other papers that consider the shortened version (10 items) also proposed by Shimp and Sharma's (1987) pioneering study and papers using adapted versions of the CETSCALE. These adapted versions differ both in the number of items included (e.g. three, four, five, 11, 14 or 16 items) and what items are considered for measuring consumer's ethnocentric tendencies. Nevertheless, the common feature of all these studies is that—beyond adaptation to original citizenship in each case—they do not modify the items originally proposed by Shimp and Sharma (1987). We have to note that such items do not include, in any case, the origin of foreign products attitudes to which are being measured, nor—if any—the specific product category under study. As a result, all the studies named CETSCALE as the scale used in their empirical analysis, 1 even if many of them did not use any of the two original proposals (17 or 10 items) offered by Shimp and Sharma (1987).
According to this practice, this paper will use the term CETSCALE for all those scales used to analyse consumers’ ethnocentric behaviour, provided they have the original version of this scale as a starting point, regardless of the number of items used in each empirical application.
Nevertheless, there are two papers that modified the original items developed by Shimp and Sharma (1987): the paper by Douglas and Nijssen (2003) and that by Altintas and Tokol (2007). The former, in addition to modifying the original CETSCALE by translating it into Dutch (the paper is focused on the Dutch context), adds a specific item related to the particular relationship between the Netherlands (the country in which ethnocentric tendencies are analysed) and Germany (the country of origin of the foreign products under study). Altintas and Tokol (2007), meanwhile, use only six of the 17 items of the original CETSCALE to analyse Turkish consumers’ aversion towards European products, replacing the term “foreign products” with “European products”. To our knowledge, these two papers are the only examples of modification of the CETSCALE—beyond translation of the language—used to analyse the ethnocentric tendencies of a particular group of consumers. On the contrary, there are no studies in the literature that include the product category under study in the original item statements.
The goal of this paper is to examine the question of the dimensionality of the CETSCALE in depth. In order to do this, we first develop an extensive review of the main aspects of those papers supporting the multidimensionality of the CETSCALE. The objective of this analysis is to ascertain what aspects of each empirical application (i.e. CETSCALE version, items considered, sample size, sample type, etc.) might be the source of the multidimensionality result. Secondly, given the absence of previous CETSCALE versions that include the specific product category in the drafting of the items, we check the dimensionality of an adapted CETSCALE including the product category (vegetables) under study. We should note that vegetables have rarely been used in the context of ethnocentrism studies. In addition, there is only one study (Netemeyer et al., 1991) that has analysed the dimensionality of the CETSCALE in the context of German consumers. These authors supported the unidimensionality of the scale originally proposed by Shimp and Sharma (1987). The sample used in our study is based on German tourists. Another goal of this paper is, therefore, to establish whether including the product category in the drafting of the items may influence the dimensionality of the CETSCALE version used.
The rest of the article is organized as follows. Section 2 briefly analyses the concept of consumer ethnocentrism. Following this, an extensive review of previous literature considering the question of CETSCALE dimensionality is developed in Section 3. The empirical study analysing German consumers’ ethnocentric tendencies when purchasing vegetables is described in Section 4. Section 5 presents the results of the empirical analysis. We conclude with the contributions of this study and a discussion of both its limitations and directions for further research in Section 6.
Ethnocentrism is a word composed of the terms “ethnic”, which means group, and “centrism”, which means focused (Usunier and Lee, 2005). William Summer introduced the term ethnocentrism in 1906 from a sociological point of view and defined it as the “view of things in which one's own group is the centre of everything, and all others are scaled and rated with reference to it” (p. 13). Thus one's own group is construed as the “ingroup” and all others as “outgroups”. Ethnocentric individuals believe in the inherent superiority of their own ethnic group.
Following Sumner's definition, Luque-Martínez et al. (2000) state that ethnocentrism represents a universal tendency to see an individual's own group as the centre of the universe, thus rejecting those individuals who are culturally different and blindly accepting those who are culturally similar. Indeed, Chang and Ritter (1976) consider ethnocentrism to be composed of two dimensions: a positive attitude towards one's own group and a negative attitude towards outgroups.
From the sociological and psychological perspective of the term coined by Sumner in 1906, Shimp and Sharma (1987) proposed an economic version and developed the concept of consumer ethnocentrism. The main objective was to analyse the emotional implications for consumers in relation to buying foreign products, especially in situations where the domestic economy is not in a strong position.
According to Shimp and Sharma (1987), consumer ethnocentrism focuses on the responsibility and morality of purchasing foreign-made products vs. consumers’ loyalty towards products made in their own country. For an ethnocentric consumer, importing products from other countries is not appropriate because it is not patriotic and is detrimental to the economy and domestic employment (Yagci, 2001; Supphellen and Gronhaug, 2003). As a result, ethnocentric consumers will evaluate their own products differently from those manufactured in other countries (Huddleston et al., 2000), overestimating the attributes and overall quality of domestic products, and underestimating those of foreign products (Sharma et al., 1995).
Nevertheless, the ethnocentric consumer does not always respond in such a “radical” manner. Although there is a lower probability of information concerning the country of origin being considered objectively when the consumer is extremely ethnocentric (Gurhan-Canli and Maheswaran, 2000), in cases in which the perception of the product is associated with a good image of the country (e.g. level of industrialization, political situation, economic development, or admiration for the country), foreign products will be evaluated positively (Yagci, 2001). Therefore, a consumer may be ethnocentric with regard to certain products for which domestic production is obviously superior to that of foreign products, but at the same time he/she may not have a negative attitude towards other goods in which his/her country is clearly deficient or is clearly far from offering the levels of quality that foreign countries provide. Additionally, the concept of consumer ethnocentrism cannot be generalized in terms of explaining the stronger preference for local products given that it may differ depending on the brand or the product category under analysis (Sharma et al., 1995). Indeed, previous literature has confirmed that in the case of generic product categories, the higher the tendency for consumer ethnocentrism the stronger the preference for national products and the weaker the preference for foreign ones (e.g. Netemeyer et al., 1991; Sharma et al., 1995). However, in the case of particular brands, the conclusions are not so unequivocal. Thus, many authors (e.g. Supphellen and Rittenburg, 2001; Li and He, 2013) argue that the positive relationship between ethnocentrism and the preference for domestic products still remains and is even stronger; however, there is virtually no relationship in terms of foreign brands (i.e. such brands are not rejected by ethnocentric consumers). In contrast, other authors (e.g. Nijssen and Douglas, 2004) conclude that the ethnocentric feeling exists even if local brands are not available.
Using the CETSCALE to measure consumers’ ethnocentrism
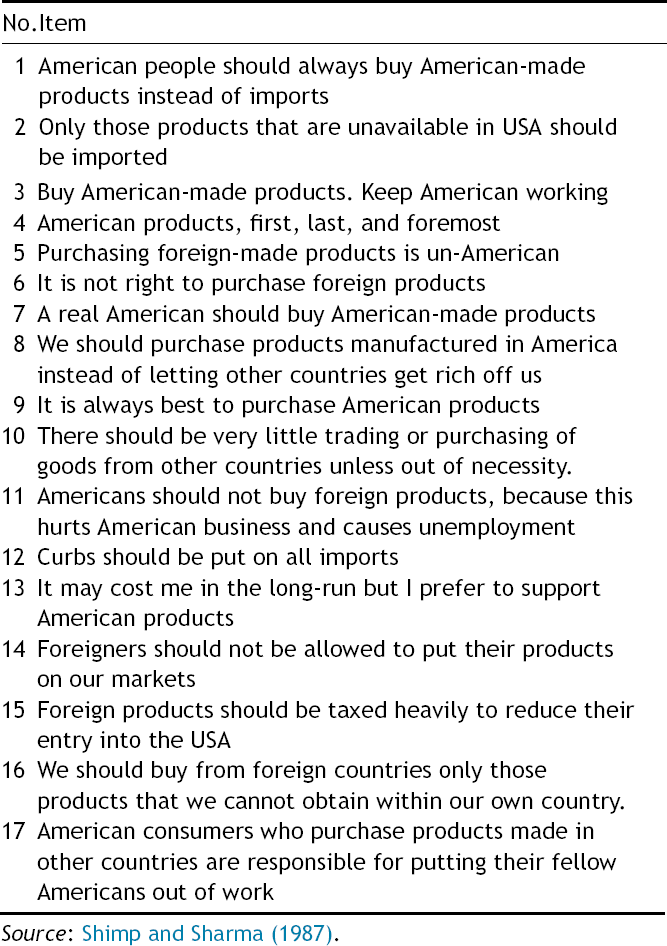
The CETSCALE is a 17-item scale (see Appendix 1) developed by Shimp and Sharma in 1987. It was initially designed to represent the beliefs of American consumers about the appropriateness of purchasing foreign products. In Shimp and Sharma's original work, the CETSCALE explains consumers’ beliefs, attitudes, purchase intention and consumer choice. Nevertheless, as Shimp and Sharma (1987: 281) point out, the scale is “a measure of ‘tendency’ rather than ‘attitude’, because the latter term suggests a greater degree of object specificity than the CETSCALE is intended to capture. ‘Attitude’ is used most appropriately in reference to the consumer's feeling towards a specific object”. Since 1987, the CETSCALE has been used widely by numerous studies analysing aspects related to the individual's ethnocentric tendencies in different countries and for many different product categories. Table 1 shows an exhaustive list of the main papers published since the appearance of the scale and geographical scope.
Main studies (after Shimp and Sharma, 1987 work) using the standard or adapted CETSCALE versions.

Main studies (after Shimp and Sharma, 1987 work) using the standard or adapted CETSCALE versions.
As Table 1 shows, the CETSCALE has been used in very different countries and geographical areas. Nevertheless, there is a lack of papers analysing ethnocentrism in Latin American countries.
In many of the works contained in Table 1 (e.g. Netemeyer et al., 1991; Good and Huddleston, 1995; Durvasula et al., 1997; Luque-Martínez et al., 2000; Orth and Firbasova, 2003; Saffu and Walker, 2005; Nadiri and Tümer, 2010), the CETSCALE exhibits a high degree of reliability. 2 However, in terms of providing information, the CETSCALE exhibits many important limitations. Thus, as Al Ganideh and Al Taee (2012) indicate, the CETSCALE does not allow the ranking of consumers in terms of their ethnocentrism level. Bawa (2004) shares this point of view; she notes that the scale only reveals whether or not the consumer is ethnocentric, but does not provide information on his/her ethnocentrism level.
Reliability is defined as the extent to which a scale produces the same results on repeated trials. The way to measure reliability varies according to the focus of the investigation and the nature of the data. The most common internal consistency measure is
A scale's unidimensionality—considered by many authors (e.g. Wright and Masters, 1982; Wright and Stone, 1998) an essential requirement for a scale generating good measures—implies that a single latent trait or construct is located at the base of a set of items (Hattie, 1985). That is, a scale is unidimensional if all the items of the scale measure one common latent variable. While it is true that, in practice, no measurement instrument can be perfectly unidimensional (Wright and Linacre, 1998), the goal is to find instruments or scales essentially showing dimensionality. In this respect, it is most important for a measurement instrument to be capable of representing a single dominant factor with its scores. This is accomplished by obtaining a single latent attribute explaining as much as possible of the variance in individuals’ responses to the items comprising the instrument (Embretson and Reise, 2000).
In the original work developed in the U.S., Shimp and Sharma's (1987) CETSCALE was proposed as a reliable scale, showing internal consistency and being unidimensional. Soon, Netemeyer et al. (1991) validated all these parameters in countries such as France, Japan and Germany (in addition to the U.S.), confirming the scale's international applicability. Nevertheless, these authors suggested that the scale exhibited problems in terms of its nomological validity. Over the years, studies similar to that developed by Shimp and Sharma (1987) have been developed. The objective of such studies was to test the internal consistency and dimensionality of the CETSCALE (using both standard and adapted versions) when applied to developed countries such as Spain (e.g. Luque-Martínez et al., 2000), the Netherlands (e.g. Douglas and Nijssen, 2003), the U.K. (e.g. Balabanis and Diamantopoulos, 2004), Iceland (e.g. Bandyopadhyay, 2012) and Israel (Shoham and Brencic, 2003); in emerging countries such as China (e.g. Pereira et al., 2002; Wei et al., 2009; Chang and Cheng, 2011; Qing et al., 2012), Russia (Saffu and Walker, 2005; Thelen et al., 2006) and India (Pereira et al., 2002; Bawa, 2004; Khan and Rizvi, 2008; Naved and Raza, 2008); in Eastern European countries such as Poland (Supphellen and Rittenburg, 2001) and the Czech Republic (Orth and Firbasova, 2003), and even in more “exotic” countries such as Jordan (Al Ganideh and Al Taee, 2012), the Republic of Mauritius (Ramsaran-Fowdar, 2010) and Ethiopia (Mangnale et al., 2011).
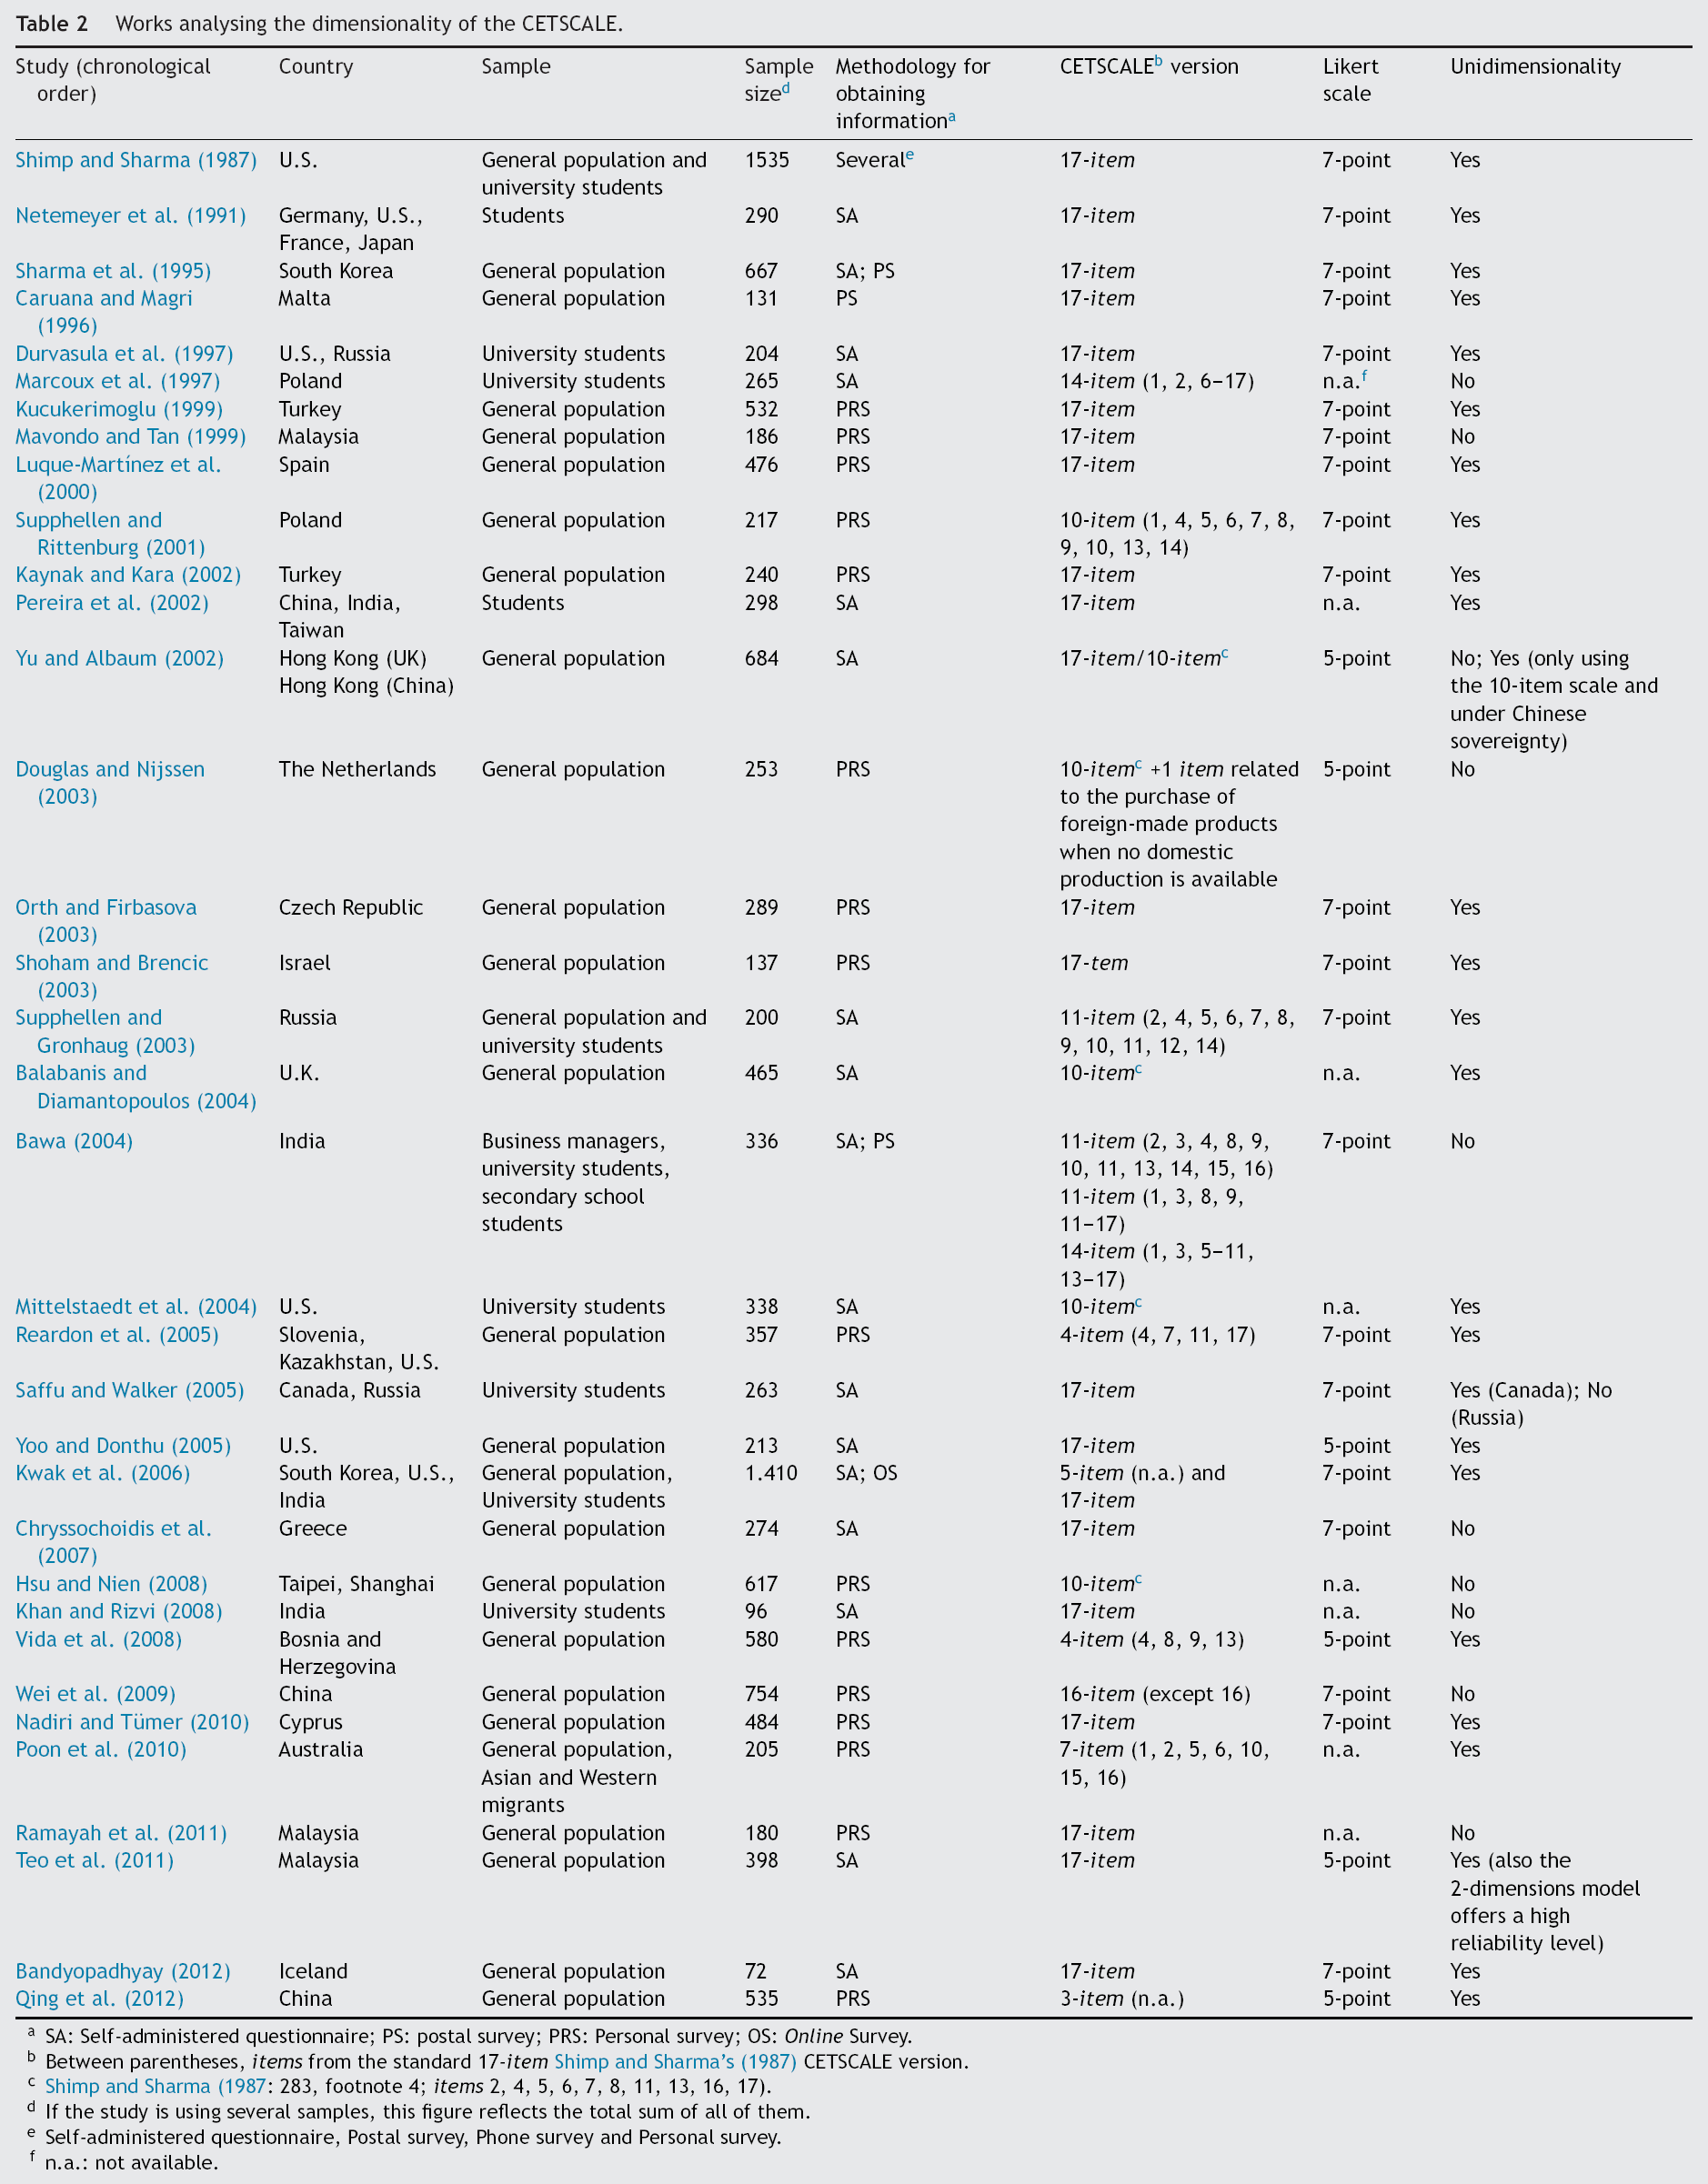
Although many of these works confirm the internal consistency of the CETSCALE, not all support its unidimensionality. Table 2 shows the main features of those studies analysing the dimensionality of the CETSCALE (as the main aspect or as a secondary purpose).
Works analysing the dimensionality of the CETSCALE.
SA: Self-administered questionnaire; PS: postal survey; PRS: Personal survey; OS: Online Survey.
Between parentheses, items from the standard 17-item Shimp and Sharma's (1987) CETSCALE version.
Shimp and Sharma (1987: 283, footnote 4; items 2, 4, 5, 6, 7, 8, 11, 13, 16, 17).
If the study is using several samples, this figure reflects the total sum of all of them.
Self-administered questionnaire, Postal survey, Phone survey and Personal survey.
n.a.: not available.
Works analysing the dimensionality of the CETSCALE.
SA: Self-administered questionnaire; PS: postal survey; PRS: Personal survey; OS:
Between parentheses,
Shimp and Sharma (1987: 283, footnote 4;
If the study is using several samples, this figure reflects the total sum of all of them.
Self-administered questionnaire, Postal survey, Phone survey and Personal survey.
n.a.: not available.
As Table 2 shows, most of the studies confirm the unidimensionality of the CETSCALE. These papers include many different countries, such as the U.S. (e.g. Durvasula et al., 1997; Mittelstaedt et al., 2004; Yoo and Donthu, 2005), South Korea (e.g. Sharma et al., 1995; Kwak et al., 2006), Spain (Luque-Martínez et al., 2000), Russia (Supphellen and Gronhaug, 2003), Turkey (e.g. Kucukerimoglu, 1999; Kaynak and Kara, 2002), China (e.g. Pereira et al., 2002; Qing et al., 2012), Malta (Caruana and Magri, 1996), Iceland (Bandyopadhyay, 2012), Israel (Shoham and Brencic, 2003) and Cyprus (e.g. Nadiri and Tümer, 2010).
This variety of geographical contexts is similar in the case of those studies supporting the multidimensionality of the CETSCALE; nevertheless, most of them were developed in Asian countries. This is the case of China (Wei et al., 2009), Malaysia (Mavondo and Tan, 1999; Ramayah et al., 2011), India (Bawa, 2004; Khan and Rizvi, 2008) and Taipei and Shanghai (Hsu and Nien, 2008). Only in Russia (Saffu and Walker, 2005), the Netherlands (Douglas and Nijssen, 2003) and Poland (Marcoux et al., 1997) do we find European countries in which the unidimensionality of the CETSCALE has not been confirmed. Notably, the paper by Yu and Albaum (2002) analyses the consumer ethnocentrism of Hong Kong residents before and after the change in sovereignty (on 1 July 1997 Britain transferred sovereignty over Hong Kong to China in a peaceful manner). In order to do this, they use both the standard 17-item version and the short 10-item version. Using the standard 17-item scale, their results support the multidimensionality of the scale, obtaining four factors for the pre-handover sample and two factors for the 1998 post-handover sample. Using the short 10-item version of the CETSCALE, Yu and Albaum (2002) also obtain two factors for the pre-handover sample; however, for the 1998 post-handover sample only one factor explaining 62% of the total variance is obtained.
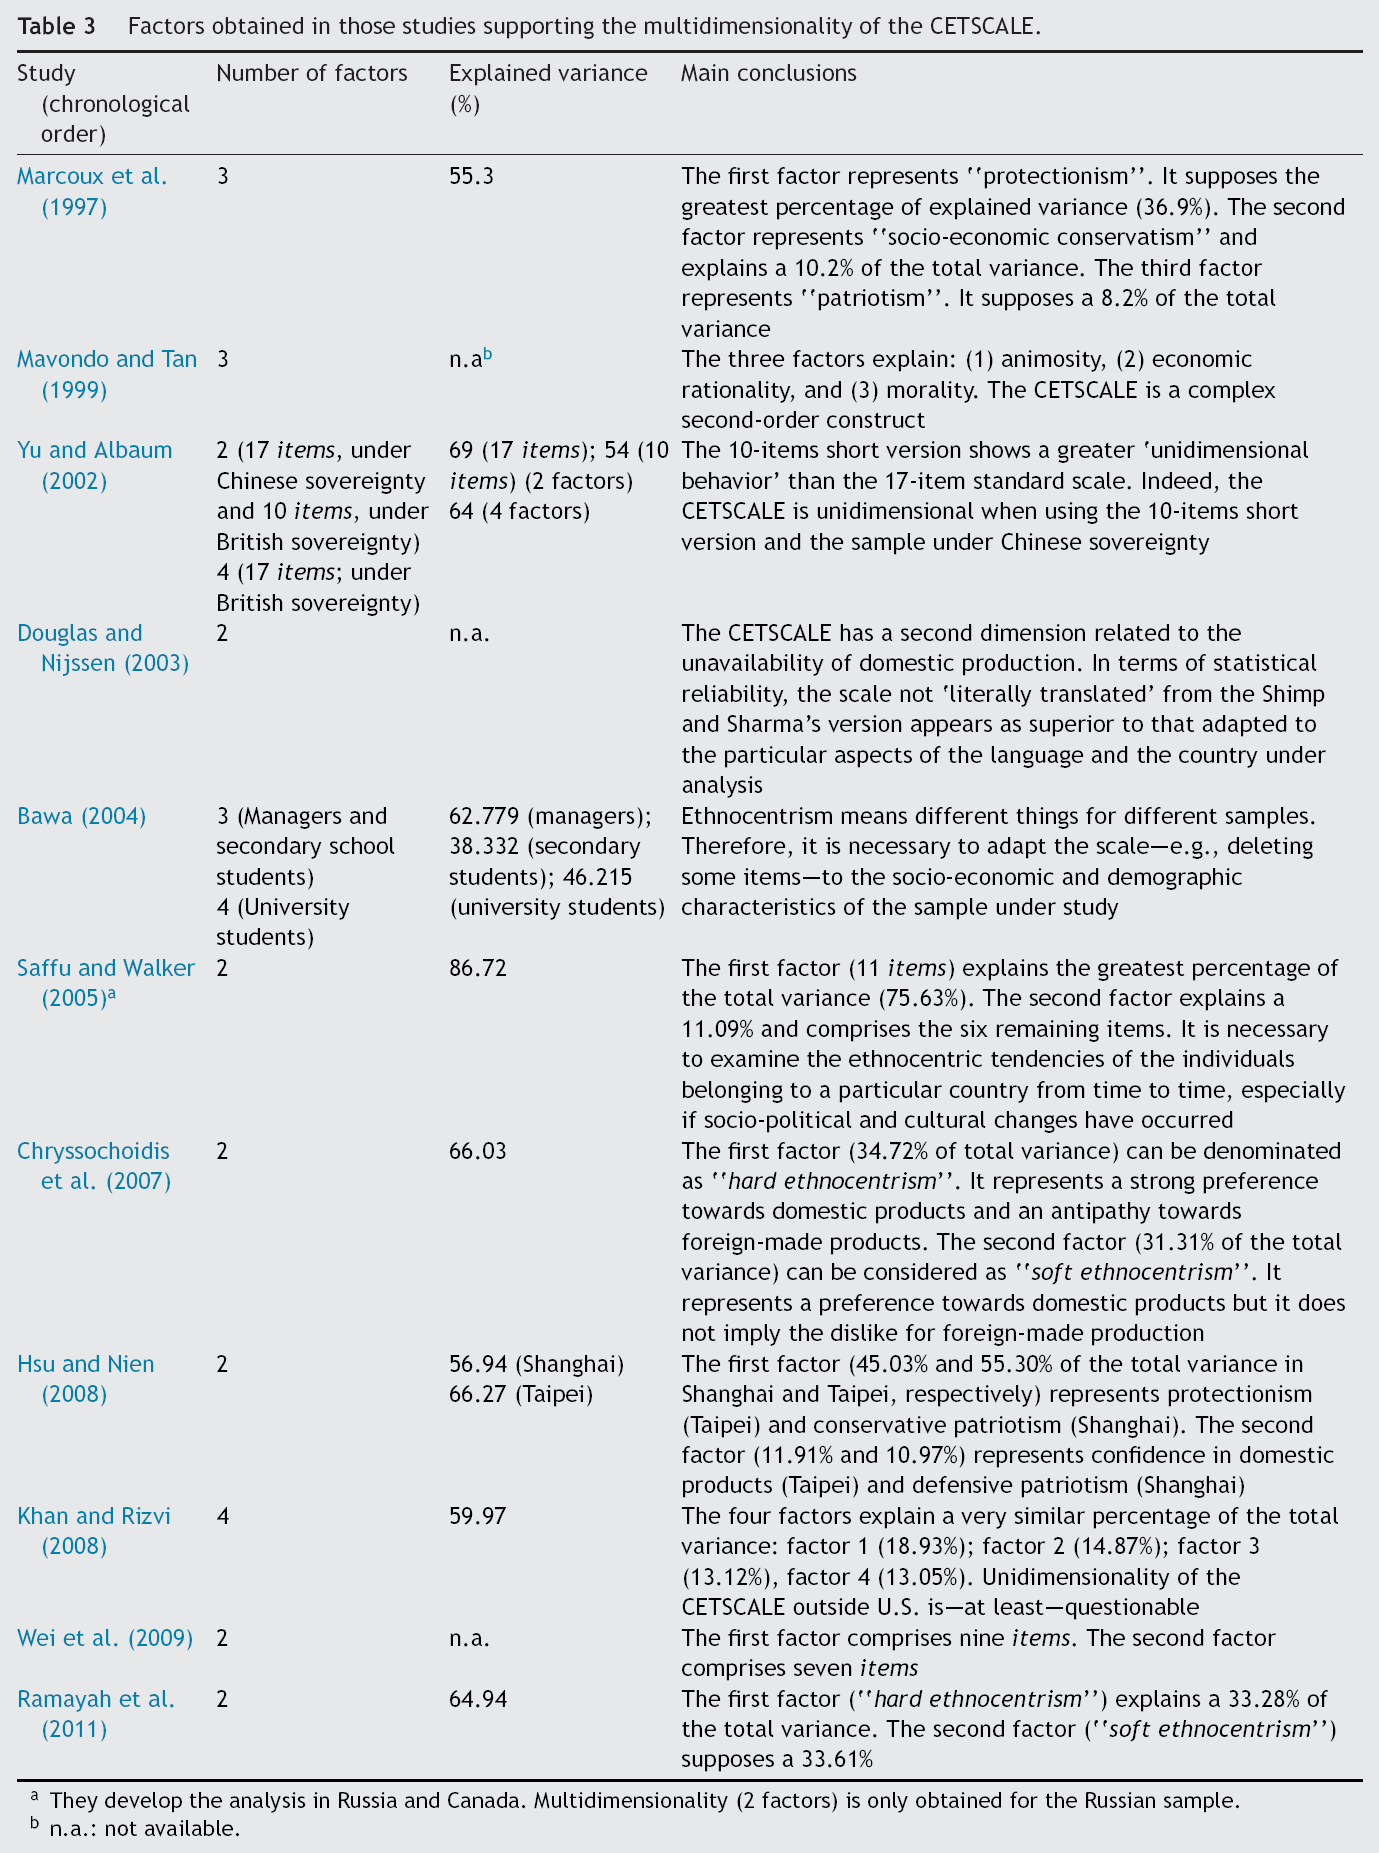
With regard to those papers supporting the multidimensionality of the CETSCALE, the results point out that there are between two and four factors explaining ethnocentric behaviour. Table 3 shows the number of factors and the main conclusions obtained in those studies not supporting the unidimensionality of the CETSCALE.
Factors obtained in those studies supporting the multidimensionality of the CETSCALE.
They develop the analysis in Russia and Canada. Multidimensionality (2 factors) is only obtained for the Russian sample.
n.a.: not available.
As Table 3 shows, most of the papers support the existence of two dimensions in the CETSCALE. This is the case in the papers by Yu and Albaum (2002) (in two of the four analyses developed), Douglas and Nijssen (2003), Saffu and Walker (2005), Chryssochoidis et al. (2007), Hsu and Nien (2008), Wei et al. (2009) and Ramayah et al. (2011). In all these studies, the total variance explained by these two factors is higher than 54%, even achieving 86.72% in the paper by Saffu and Walker (2005) (for the Russian student sample). In most of these papers, the two dimensions identified represent two different perspectives of ethnocentric behaviour: a dimension showing the individual's aversion towards foreign products on the one hand and a dimension showing the individual's preference for and protection towards domestic production on the other. Chryssochoidis et al. (2007) and Ramayah et al. (2011) designate these dimensions as “hard ethnocentrism” and “soft ethnocentrism”, respectively, whereas Hsu and Nien (2008) term them as “protectionism” and “defensive patriotism”.
Marcoux et al. (1997), Mavondo and Tan (1999), and Bawa (2004) (in two of the three samples used) support the existence of three factors. According to Mavondo and Tan (1999), the CETSCALE can be considered a complex second-order construct consisting of three components that reflect: (1) animosity towards foreign people and their products; (2) the group's “self-preservation” desire through developing economic actions; (3) the moral obligation to support domestic products. Marcoux et al. (1997) point out that of these three factors, that representing an individual's protectionist tendencies is the most important. In contrast, patriotism is the dimension that least explains the individual's ethnocentric behaviour.
Finally, Yu and Albaum (2002) (for the pre-handover sample and using the standard 17-item CETSCALE), Bawa (2004) (for the university student sample), and Khan and Rizvi (2008) obtain four different factors explaining—in the case of the papers by Yu and Albaum (2002) and Khan and Rizvi (2008)—approximately 60% of total variance. On the other hand, Bawa (2004) finds that these four factors underlying the CETSCALE only explain just over 42% of total variance. According to Khan and Rizvi (2008), the importance of each of these factors is similar, reflecting that the CETSCALE is questionable in terms of dimensionality when it is analysed outside the U.S. context.
Studies supporting the multidimensionality of the CETSCALE employ different arguments in justification. Thus, many authors (e.g. Marcoux et al., 1997; Supphellen and Rittenburg, 2001; Bawa, 2004) argue that these results are mainly a consequence of socio-demographic aspects of the sample under study because differences in terms of age and education level can lead to differences in the dimensionality of the scale. However, this argument does not seem to be confirmed according to our literature review. As Table 2 shows, papers supporting both the unidimensionality and the multidimensionality of the CETSCALE use student samples and also the general population.
Another argument is related to the version of the CETSCALE each study employs. As we indicated before, this is the case in Yu and Albaum's (2002) study. In our opinion, this is a very interesting aspect to be analysed. Although it is true that most previous applications of the CETSCALE have used the standard 17-item version, other papers have proposed different adaptations with a significantly lower number of items. Thus, there are many studies using the short 10-item version 3 —also proposed by Shimp and Sharma (1987) in their original work—that conclude the CETSCALE is not unidimensional. This is the case in papers by Douglas and Nijssen (2003) 4 and Hsu and Nien (2008). However, there are also studies using the same short version and obtaining a single underlying factor (e.g. Balabanis and Diamantopoulos, 2004; Mittelstaedt et al., 2004); these results make us doubt whether the use of the 10-item version may cause multidimensional results. Nevertheless, as Table 2 suggests, many of those studies obtaining more than one explanatory factor do not use the standard 17-item standard CETSCALE. Thus, in addition to the aforementioned works that use the 10-item version, we can highlight the paper by Marcoux et al. (1997). These authors analyse the ethnocentrism of Polish students using a 14-item adapted version (items 3, 4 and 5 were omitted). A similar version (14 items) is used by Bawa (2004) in her analysis of the ethnocentrism of Indian secondary school students, although she eliminated items 2, 4 and 12 from the original CETSCALE. This study also employs two different 11-item adapted versions for two additional samples of business managers and university students.
Shimp and Sharma (1987, p. 283, footnote 4; items 2, 4, 5, 6, 7, 8, 11, 13, 16, and 17 from the original 17-item version).
These authors add to the 10-item short version an additional item related to the origin of foreign products (German origin in this case) when there is no domestic (Dutch) product available.
In contrast, most of the papers supporting the unidimensionality of the CETSCALE use the full 17-item version. Nevertheless, it is true that there are also studies that use very few items and support the unidimensionality of the scale, e.g.: three items (Qing et al., 2012); four items (Reardon et al., 2005; Vida et al., 2008); five items (Kwak et al., 2006); seven items (Poon et al., 2010). Using these adapted and reduced scales is very common practice, as Li and He (2013) point out, due to the high internal correlation that items belonging to a scale exhibit when they are very numerous as in the standard CETSCALE. In addition, Steenkamp and Baumgartner (1995) suggest that it is an effective and a reliable procedure. However, exempting the 10-item version, it is confirmed that those authors not using the full 17-item version consider very different items in their respective analyses; this seems to be a consequence of the need to adapt the CETSCALE to the geographical and socio-cultural contexts in each empirical application.
Another aspect influencing the results obtained with regard to the dimensionality of the CETSCALE is sample size. In this respect, those papers supporting the unidimensionality of the CETSCALE generally use larger samples than those supporting the multidimensionality of the scale. Indeed, as can be extrapolated from the figures shown in Table 2, the average sample size in papers supporting the unidimensionality of the CETSCALE is 428 individuals compared to 329 individuals in papers supporting the contrary result. 5 Even though there is no final criterion regarding how many individuals are necessary for a factor analysis to provide reliable results, it seems that larger samples are preferred to smaller ones because the typical error of correlation coefficients will be smaller. The criteria that can be considered in establishing the minimum size of the sample are as follows (Morales, 2011:8): (1) the number of individuals should be double the number of variables; (2) the sample should not be fewer than 100 individuals (Kline, 1994) even though the number of items may be very small. This second aspect is, in fact, the minimum criterion. In the case of the CETSCALE, the former criterion would suppose a minimum number of 34 individuals in the sample under study (using the 17-item scale); this number is exceeded by all the studies analysing the dimensionality of the scale (see Table 2).
In calculating the average sample size of these papers, we have not considered the studies by Yu and Albaum (2002) and Saffu and Walker (2005) given that they obtain “mixed” results (both unidimensionality and multidimensionality) in the same analysis.
Nevertheless, the criterion most used is that indicated by Nunnally (1978) and Thorndike (1982) who recommend using a sample (
In order to shed more light regarding the dimensionality of the CETSCALE as an appropriate scale for measuring consumers’ ethnocentric tendencies, this paper analyses the case of German consumers, a nationality whose ethnocentric tendencies have scarcely been analysed. Indeed, since Netemeyer et al.'s (1991) study, no one has analysed the level of German consumer ethnocentrism. With this goal, we use vegetables as the category under study. There is a lack of papers using this product category for measuring ethnocentric tendencies; it is more common to find studies focused on other categories (e.g. beverages, personal computers, motorcycles or appliances). Germany is the strongest market in the EU and one of the most important economies in the world. Indeed, Germany is the first global food importer with around 40 million tons. Of this amount, 4.2 million tons relate to fruits and 2.7 million tons to vegetables; with regard to the latter product category, Germany is the main EU importer and the second worldwide. In addition, the German market is the main destination of Spanish vegetables (more than one million tons in 2011); therefore, the relevance of the sample used in this study is entirely justified.
The most relevant methodological contribution of this paper is the adaptation of the original 17-item CETSCALE, considering explicitly the category under analysis (i.e. vegetables) when wording items (see Table 4). Given the lack of previous studies explicitly incorporating the category under analysis in the CETSCALE version used, our study will demonstrate whether such an aspect could influence the existence of more than one dimension in the scale.
German version (vegetables-related) of the CETSCALE.
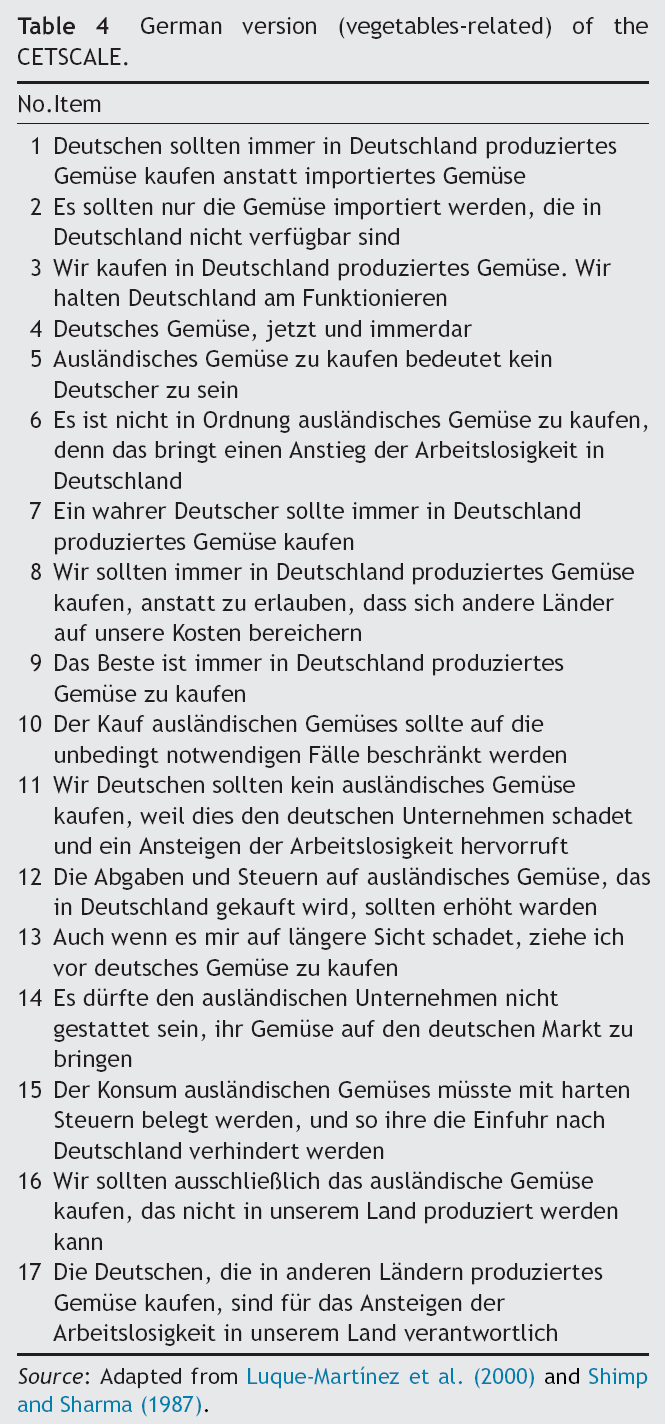
Source : Adapted from Luque-Martínez et al. (2000) and Shimp and Sharma (1987).
German version (vegetables-related) of the CETSCALE.
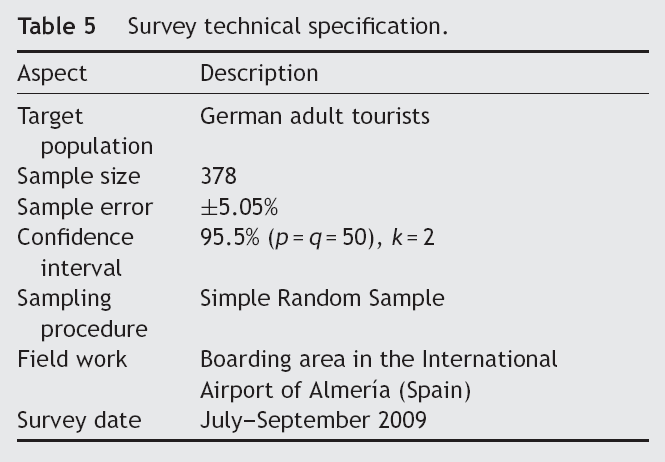
The study was developed between June and September 2009. The survey was deployed in the boarding area of the international airport in Almería (Spain) while German citizens were waiting for their flight back to Germany after a stay in Spain; this increased the probability of the participants knowing the vegetables under analysis. More details of the survey are shown in Table 5.
Survey technical specification.
Of those responding, 43.4% participants were male and almost a half of them (47.9%) were aged between 18 and 20 years. 6 Given the sample size of our study (378) and taking into account that we were using 17 items, the average number of individuals per item in our study 7 (22.235) is clearly higher than the minimum level of 10 individuals recommended by Nunnally (1978).
More information about the sample is available from corresponding author on request.
It should be noted that this average number is exactly in the median position of the ranking of those papers analysing the dimensionality of the CETSCALE (see Table 2) if such papers are sorted in descending order of the average number of individuals per item (14th position if we consider sample size in absolute terms).
To ensure understanding of the scale, the reverse translation technique was used (Brislin, 1980). Thus, items were translated from Spanish to German and then three bilingual persons translated the questionnaire back to Spanish. Finally, we compared the original version of the scale (see Table 4) and the “re-translated” one. Very few differences were observed and they were resolved. However, in order to check that the reverse translation had really been effective and before developing the final survey, the questionnaire was revised by six German individuals sharing the same profile as the final sample.
In order to achieve our goals and after a previous analysis of reliability to measure the internal consistency of the scale, we developed an exploratory factor analysis (EFA) aimed to establish whether items included in the scale measure the same dimension (unidimensionality) or whether there are more dimensions. Using the solution offered by EFA, we estimated a confirmatory factor analysis (CFA) to confirm—in a more robust manner—the dimensional structure suggested by the EFA. In addition, other measures for confirming the dimensionality of the scale were used.
Scale reliability
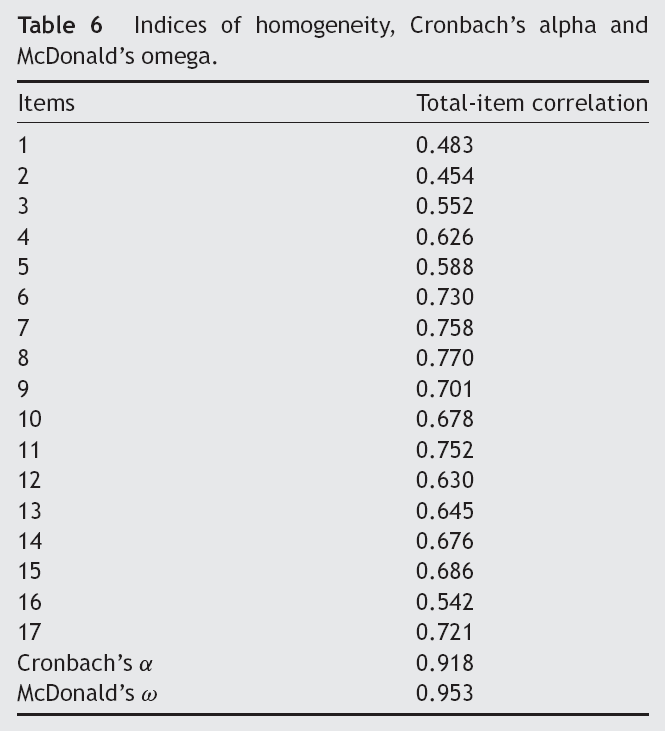
The analysis of reliability of the 17-item adapted version of the CETSCALE offered an acceptable result in terms of three measurements of internal consistency: the corrected total-
Indices of homogeneity, Cronbach's alpha and McDonald's omega.
Indices of homogeneity, Cronbach's alpha and McDonald's omega.
Regarding the values needed to support the consistency of the scale, it is important to highlight that there is no single rule related to the minimum value. In this respect, Hair and colleagues (1999) suggest that Cronbach's alpha must be higher than 0.7, whereas total-
Therefore, according to the above arguments, the consistency of our scale is confirmed; both Cronbach's alpha and McDonald's omega (0.918 and 0.953, respectively) are at levels considered very acceptable. In the same way, all total-
Once the reliability of the scale has been confirmed, the second step aims to check whether it is composed of a single factor or dimension. There are several methods and indexes available in order to confirm the unidimensionality of a particular scale. In this respect, Hattie (1985) provides an extensive review of such procedures and indexes. He classifies them into five groups: (1) those based on answer patterns; (2) those based on reliability; (3) those based on principal components analysis; (4) those based on factor analysis; (5) those based on latent trait models. In brief, 30 different indexes are supported by more than 80 research papers. 8
For an analysis detailing the different indexes, see Hattie (1985).
This study employs factor analysis in order to evaluate the dimensionality. This methodology is still one of the most used and extended techniques at an empirical level (Joan, 1996). Before undertaking factor analysis, the use of two confirmatory measurements is recommended: Bartlett's test of sphericity and the KMO (Kaiser–Meyer–Olkin) measure of sampling adequacy. In this case, the former (3541.789) is significant (
We started by developing an ordinary least squares (OLS) EFA. Table 7 shows the results of this analysis. 9
For the development of factor analysis, FACTOR software (Lorenzo-Seva and Ferrando, 2006) was used.
Rotated component matrix.
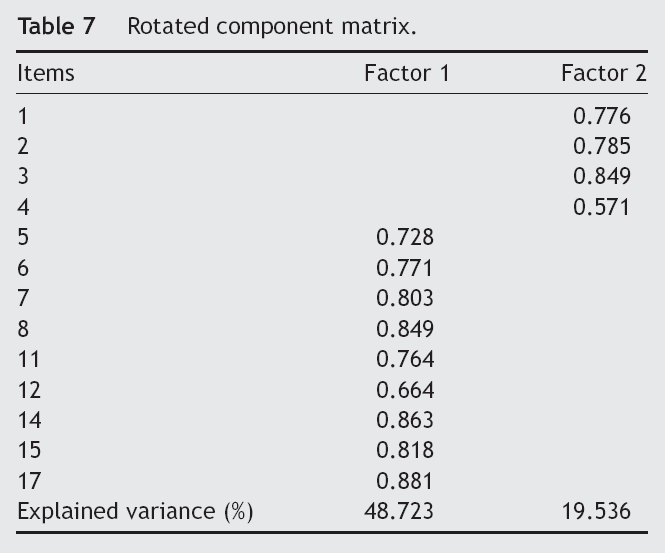
As Table 7 shows, the EFA estimated by the OLS offers a two-factor solution; these factors contain nine and four factors, respectively and together they explain 68.259% of the total variance (48.723% and 19.536% for the first and second factors, respectively). This solution is obtained once the initial matrix is rotated
10
starting from a final scale composed of 13 items after deleting items 9,10,13 and 16 which loaded to both factors with very similar values. Factor loadings over a minimum level of 0.30 are significant for a sample size of
The
In order to confirm the multidimensionality (two factors) result proposed by EFA, a CFA was developed. In order to do this, we estimated (using AMOS software) the measurement model starting from a global confirmatory analysis for all scales included. After that, we assessed the quality of fit indexes and evaluated the quality of all measures. 11
We only offer those fit indexes we obtained. Additional information related to other aspects of CFA is available from the corresponding author upon request.
All fit indexes confirm that the two-factor structure initially proposed by the EFA does fit our data as all of the values are within the recommended acceptance levels for each index. The root mean square error of approximation (RMSEA) is 0.091 (value included in the acceptance range); the goodness-of-fit index (GFI) is 0.912; the comparative fit index (CFI) is 0.947; the Tucker-Lewis index (TLI) is 0.931; the normed fit index (NFI) is 0.932; the incremental fit index (IFI) is 0.947. Finally, the value of χ2 (2.098) is also significant (Hair et al., 1999; Schreiber et al., 2006; Martínez-López et al., 2013).
According to the statistical confirmation of the existence of two factors in the adapted version of the CETSCALE we developed and taking into account each item loading,
Consumers showing a negative attitude towards foreign-grown vegetables
Our results are in line with those obtained by Chryssochoidis et al. (2007) 12 in their analysis of the ethnocentrism of Greek consumers towards food products. These authors also obtained two factors; furthermore, the items loading on the first factor are the same as those in our study. They designate this first factor “hard ethnocentrism”. The second factor—that in the study by Chryssochoidis and colleagues is composed of the remaining eight factors—is described as “soft ethnocentrism”, distinguishing between a “more radical” attitude towards foreign-made products and another “more conciliatory” one towards imported products, given that the latter is focused on a preference for domestic production.
These authors analysed the ethnocentrism of Greek consumers using the standard 17-item version of the CETSCALE. Their results support the reliability and unidimensionality of the scale, obtaining an explained variance of 59.6%. However, when they developed a factor analysis and rotated the loading matrix (using the Varimax with Kaiser normalization procedure), the scale appeared bidimensional with two factors explaining 66.03% of the variance. In this second case, the results are similar to those obtained in our analysis.
As we indicated before, our results are in line with those obtained in previous studies in terms of the scale's reliability (internal consistency) but not in terms of its dimensionality. In this respect, our factor analysis indicates a non-unidimensional scale, in line with many previous authors (e.g. Mavondo and Tan, 1999; Douglas and Nijssen, 2003; Bawa, 2004; Saffu and Walker, 2005; Hsu and Nien, 2008; Khan and Rizvi, 2008; Wei et al., 2009; Ramayah et al., 2011). Nevertheless, it cannot necessarily be concluded from obtaining several factors that the scale is multidimensional (Nunnaly and Bernstein, 1994), i.e. that it measures different and strongly differentiated concepts. In this respect, as Morales (2011) points out, obtaining several factors can be compatible with a clear and single interpretation of the whole scale. As a result, in this paper we have employed alternative rules in order to confirm the multidi-mensionality suggested by the factor analysis.
In accordance with Hattie (1985), we use four additional measures to test the multidimensionality of the scale. Some of such indexes are also employed in the above mentioned papers by Yu and Albaum (2002), Bawa (2004), Khan and Rizvi (2008), Hsu and Nien (2008), and Wei et al. (2009), in which the scale was also found to be multidimensional. The four indexes or measures are the following: (1) number of eigenvalues higher than 1; (2) ratio between the first and second eigenvalue; (3) ratio between the first and second eigenvalue difference and the third and second eigenvalue difference; (4) scree test. Table 8 and Fig. 1 show the results of these indexes.
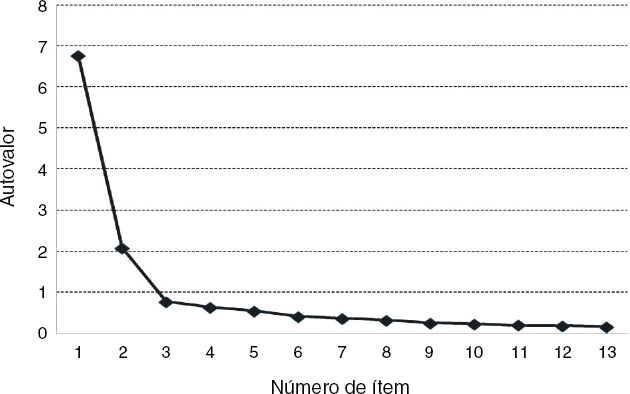
Screen plot.
Indices of unidimensionality.
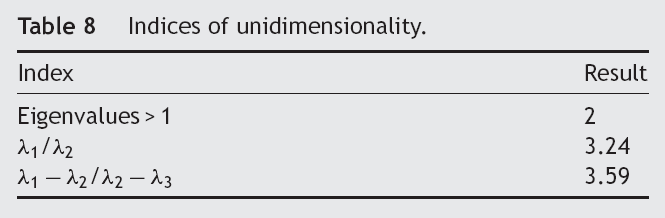
As Table 8 shows, three quantitative indexes support the non-unidimensionality of the scale. First, factor analysis yields two eigenvalues higher than 1; second, the ratio between the first and the second eigenvalues is equal to 3.24—lower than 4, suggested by Linacre (2008) to confirm multidimensionality; third, the ratio between the first and second eigenvalue difference and the second and third eigenvalue difference is equal to 3.59, also lower than 4.
Fig. 1 shows the scree test in which the number of items is shown on the
At this point, it is necessary to offer a justification for the result obtained in the context of our study. Unlike other studies, we use a sample from a developed country not exclusively composed of university students. In addition, our analysis is not focused on
Nevertheless, it is surprising to confirm the ethnocentric feelings of German consumers when they buy vegetables given that Germany is a market highly dependent on foreign produce because of their limited domestic production. This result concerning a seemingly irrational behaviour, as O'Cass and Lim (2002) and Nijssen and Douglas (2004) suggest, in terms of the application of the CETSCALE—both in its standard and adapted versions—leads to the conclusion that consumers exhibit an ethnocentric behaviour (Al Ganideh and Al Taee, 2012).
The study of consumer ethnocentrism is a field of great importance in the marketing literature. It is especially relevant at the present time as a consequence of the globalization of markets and the considerable opportunities for companies to enter foreign markets with their products. Without doubt, the CETSCALE is that most used in the literature to analyse ethnocentric consumer behaviour. It has been validated in many studies that highlight its internal consistency and unidimensionality. However, in recent years many other studies have confirmed the consistency of the scale but not its unidimensionality, suggesting that the CETSCALE is composed of different dimensions when it is applied outside the U.S. As a result, Thelen et al. (2006) warn researchers not to assume that scales developed in a specific culture or country can validly be applied to a different context. Indeed, in the same cultural context using different samples may lead to different results (see Marcoux et al., 1997; Supphellen and Rittenburg, 2001; Bawa, 2004); this leads us to believe that ethnocentrism means different things for each sample, so applying the same type of scale is not appropriate. The socio-demographic characteristics of each of sample should be taken into account.
In the same manner, the dimensionality of the CETSCALE can be conditioned by the number of items employed in each empirical application (e.g. Yu and Albaum, 2002), or may be due to considering foreign-made products in general or a particular product category. An example can be found in this paper; thus, our results are different to those obtained by Netemeyer et al. (1991) for German consumers. In this respect, an individual can be very ethnocentric with regard to a specific category of foreign-made products but favourable to other categories of products from the same foreign country.
In our opinion, the review of the literature and the empirical application developed open up a clear debate on the convenience of using the CETSCALE with the same level of reliability in different geographical contexts, with different product categories and for heterogeneous samples of consumers. It provides evidence that results may be quite different depending on the extent to which the original conditions under which the scale was developed change.
Alongside these discrepancies regarding the dimensionality of the CETSCALE, studies such as that of Bawa (2004) or more recent research such as Al Ganideh and Al Taee (2012) also call into question the degree of information the scale provides. In particular, these authors consider that the CETSCALE shows whether a consumer is (not) ethnocentric, but it is limited in that it does not quantify the
We believe, therefore, that after 25 years of the application of the CETSCALE and a great number of studies showing the limitations such a scale presents, it might be time for a
Limitations and further research
In this paper, we have seen that over the last few years the literature has questioned the unidimensionality of the CETSCALE and especially the disparity of the criteria used in each empirical application. In this respect, the number of items has been the most significant factor. Further research we intend to develop includes the definition and validation of a
Footnotes
Appendix 1. Standard 17-item CETSCALE version
| No. Item |
|---|
|
American people should always buy American-made products instead of imports Only those products that are unavailable in USA should be imported Buy American-made products. Keep American working American products, first, last, and foremost Purchasing foreign-made products is un-American It is not right to purchase foreign products A real American should buy American-made products We should purchase products manufactured in America instead of letting other countries get rich off us It is always best to purchase American products There should be very little trading or purchasing of goods from other countries unless out of necessity. Americans should not buy foreign products, because this hurts American business and causes unemployment Curbs should be put on all imports It may cost me in the long-run but I prefer to support American products Foreigners should not be allowed to put their products on our markets Foreign products should be taxed heavily to reduce their entry into the USA We should buy from foreign countries only those products that we cannot obtain within our own country. American consumers who purchase products made in other countries are responsible for putting their fellow Americans out of work |