
Abstract
Process management and workflow optimisation have become key issues of good laboratory management 1 and now seem to be predominant over traditional challenges such as the quality of analytical testing. The first author of this paper has conducted several workflow optimisation studies for clinical laboratories in Europe (Universities of Zurich 2 and Amsterdam, Manchester Royal Infirmary and others) and in the US (University of Virginia 3 ), using a laboratory-specific simulation software called Simlab™ for realistic computer modeling of laboratory scenarios 4 . Since data input and calibration of the models against reality have always been a challenge in these studies, we looked into possibilities of using automated data extraction to extract as much information as possible from the laboratory information system. In this paper we describe our first experience with a Microsoft Excel™-based software program called Simlab 1, which uses the ASCII file transfer protocol to extract data from the LIS.
METHOD
The laboratory information system at Russells Hall Hospital is ACT MedisysTelePath MUMPS version 1.3. The system possesses a flexible search utility (List Generator), which enables a user-defined query (sift) of the data base. Using this facility, all of the samples received on particular days can be retrieved from the system and exported to a text file with five fields per line:
Laboratory specimen number
Time sample data first entered into the system
Time results authorised
Priority of the sample (routine, stat)
Test requested
The sift had the following format:

The TAB-delimited data set had the following format:
Turnaroud times (TATs) were calculated as TAT = t1 - t0, where t0 is the accessioning time, t1 is the time of completion, and prio is the priority (R = routine and U = urgent). We developed a program written in VBA to check these files for correctness, eventually convert lines into the right format (e.g. eliminate blank lines, replace TAB by semicolon, etc.) and pass them to Excel™, where calculations and assessments could be performed either directly or using a VBA program. The original purpose of the VBA program was to create input files for computer simulation, but in the course of the project we added more functionality, which could also be used without simulation.
The main deliverable of the final VBA program, which we called Simlab 1 is a turnaround time histogram: differences between arrival and release times were calculated and sorted into time slots of 1 to 15 min, 16 to 30 min and so forth. These histograms were not only used to test the plausibility of our computer simulations (see results) but also to monitor the daily distribution and reproducibility of turnaround time peaks, to detect bottlenecks in the process or simply to count which and how many tests have been ordered on a given day.
The following useful calculations were included in the VBA program:
Counting how many samples were accomplished within 1–15 min, 16–30 min and so forth
Listing all test names requested on a particular day and counting request frequencies
Counting how many samples arrived within a given hour (total, routine, stat)
Counting how many samples were released within a given hour
Counting how many samples had open test requests at the end of a given hour
Item 1 resulted in the TAT histogram, and the other lists were transformed to Excel™ graphs as well. In addition, we automated the calculation of medians, means and percentiles.
RESULTS
Checking and Converting Original LIS Data
Our queries resulted in data sets, which were almost 100% consistent with the requirements given in the methods section. However, we obtained a few blank lines, and in cases where a test was not authorised on the same day, there were blank fields instead of the second time stamp. We therefore wrote a file converter, which checked each line for a typical sample ID (character, followed by a comma) and filled empty time stamps with 00:00. Furthermore, we decided to convert TAB into semicolon to meet the csv standard format, which can be read by all Microsoft Office programs. Finally, we collected the date of the file by a user dialogue and filled it in to meet the full IEEE standard.
The details of VBA I/O procedures and string operations are outside the scope of this paper. A template program for data conversion can be obtained from the first author either as add-on to the commercial software package Simlab 1 or within the scope of a scientific cooperation.
Direct Evaluation on the Worksheet
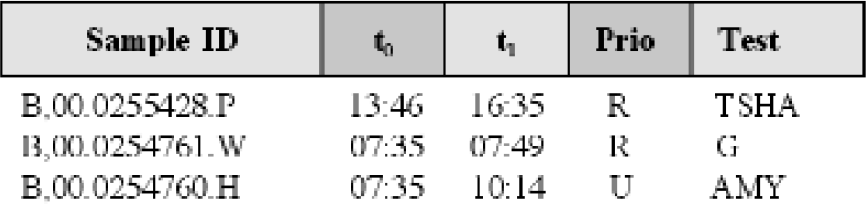
In a first study, we calculated turnaround times from a data set of the structure described in the methods section by opening the text file directly with Excel™ and using the inbuilt mathematical functions for data evaluation (fig. 1). For example, if the arrival time is in cell B1 and the release time is in cell C1, then the Excel™ formula for the turnaround time is = C1 - B1. Copying this formula to all cells of column F will result in a list of turnaround times. However, this is a tedious method, which is amenable to automation.

Direct calculation of turnaround times on a Excel™ worksheet.
Evaluation with a VBA Program
Figure 2 shows the user interface of Simlab 1, which allows the user to simulate a typical workload (demo version can be downloaded for free from http://www.trillium.de ) or to read real laboratory data from his own text files (licensed version).

Data evaluation with Visual Basic for Applications.
The reading funtion is activated by the lower button shown in Figure 2 (arrow) and either evaluates the file indicated in the Autostart text box or opens a File open… user dialogue. If the program detects incorrect or incomplete data lines in the original LIS file, it automatically starts the file converter and “repairs” the defect.
Results are presented in three different formats:
Immediate presentation of a data overview on the screen (not shown)
Generation of a detailed Excel™ report (examples shown below)
Export as ASCII files for further processing by other pro grams (not shown)
The screen report includes a workflow recorder for “play back” of the day back and forth and a slider bar for the analysis of percentiles (for example, the user may wish to determine how long it took to complete 80% or 90% of all samples). The printable Excel™ report includes a set of charts for each of the above functions plus a list of the slowest stat and routine samples for detailed investigation of the causes of delays. It is easy to modify the Excel™ tables and charts, to add further calculations (e.g. test-related direct costs) and to copy and paste the charts into Microsoft Word™ or Powerpoint™.
Example Data
Figure 3 shows a typical turnaround time histogram, obtained from Simlab 1 (blue bars) and the corresponding histogram calculated with Simlab™ (purple bars). In both cases, turnaround times were calculated as differences between arrival and release times for a given day and counted as described in the methods section. The difference between the two graphs is that in the first case samples were processed in the real laboratory whereas in the second case the Simlab™ model, which included all of the process characteristics, calculated the theoretical data for the same processes 4 .

Comparison of real turnaround times with virtual data calculated by computer simulation with Simlab™. Both graphs match very closely, except that the “virtual” laboratory is a bit faster, because it works more strictly according to the theoretical rules (see text).
The “real” histogram showed a first peak with a typical Gaussean shape around 0.5 hours and a plateau-type series of 3 more peaks between 1 and 3.5 hours. Computer simulation revealed about the same pattern except that the Gaussean peak was much more pronounced and the shape of the plateau showed a Gaussean shape as well.
For a detailed analysis, we used the checklist function (Table 1) and the statistics (Figure 3) of Simlab 1. For that specific day, we saw that prolonged processing was partly caused by erythrocyte sedimentation rates (ESR) arriving shortly after lunch time (Table 1), just during the regular break of most technicians (12:30 to 13:30). These tests took almost 100% longer in practice than in theory. Figure 4 shows that most technicians went to lunch later than expected, as indicated by a decreased release rate (arrow) and that just during that time the afternoon peak of incoming samples started at a higher rate than usual. This in turn led to a bottleneck at the ESR machine (StarrSed), which according to our simulation results accounted for about 50 out of 300 open requests at 3 pm (Figure 4, right side). Another 120 were due to a calculated waiting queue in front of the H2 blood counter (not shown).
Simlab 1 checklist (ordered by TAT) for detailed analysis of delays.
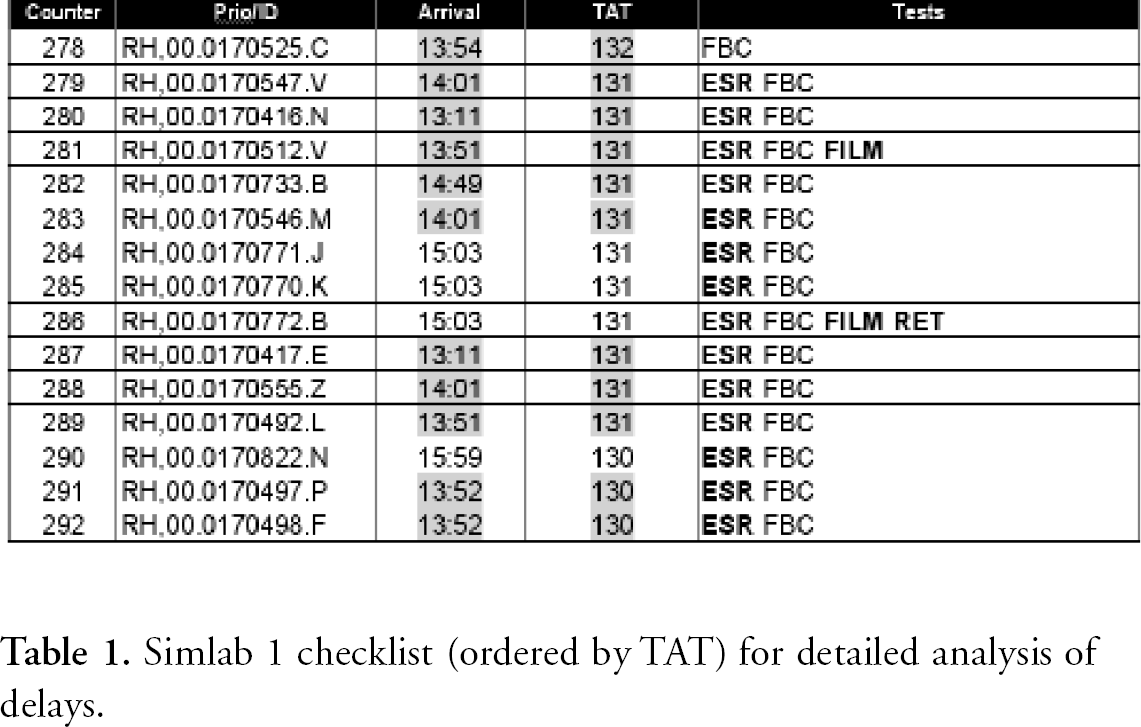

Comparison of samples with open requests and released samples (left side) shows that the low release rate shortly after the official lunch break (arrow) may have been a reason for the steep increase of open requests later in the process. Another reason was a sample queue at the ESR machine around 3 pm, calculated by computer simulation (right chart).
DISCUSSION
The main problem of today's laboratory management is to optimise the triangle of quality, price and speed 1 : While the requirements for high quality must never be questioned, the balance of price and speed can and should be negotiated. A few years ago, costs were a major concern, while the focus is now shifting towards higher speed (shorter turnaround times). This has become a need, in order to avoid abundant point-of-care testing and in some countries such as in the US, the UK and Germany, to provide faster diagnoses for DRG-based reimbursement.
The approach presented here is a contribution to turnaround time and bottleneck management. The Simlab 1 software calculates and assesses useful process data on a daily basis and helps to identify the reasons for delays. As we showed with a few examples given in Table 1 and figures 3 and 4, a large amount of valuable information can be derived without any computer simulation just from five parameters, which are easily available on any LIS: Sample ID, arrival time, release time, priority flag and test name. If this technique is combined with computer simulation, even more detailed analyses can be made and what-if scenarios can be conducted for use in future process optimisation. 3 -5 In our case, the observed bottleneck appeared as a combination of staff overload around noon, late lunch break just when an unexpectedly high number of ESR tests arrived plus an ESR analyser, that was too slow for this workload. A typical what-if scenario would help to find out whether this bottleneck could be eliminated by reorganisation or rather by a higher degree of automation in the ESR area.
Using data base queries in combination with a file converter, we are now able to record the workflow of our laboratory and to replay it at any time, in order to monitor turnaround times as a general measure of process quality, to analyse bottlenecks and to detect opportunities for short- and long-term improvement.
ADDENDUM
While this paper was in the review process, version 2.0 of the program was launched and can be downloaded from the Internet (www.trillium.de).