
Abstract
An approach to customizing the data acquisition and interpretation process of liquid chromatography electrospray mass spectrometry (LC-MS) analysis of compound libraries is presented. Macro programs, using Microsoft Visual Basic, were applied to allow the seamless flow of data from the sample synthesis stage through data acquisition/interpretation and reporting, with minimum user interaction. Logical functions were also incorporated into the macros to allow automated actions to be performed based on experimental results. The application of this approach as a universal method for supplementing the automation process of other instruments controlled by the Microsoft Windows PC platform is also discussed.
INTRODUCTION
Combinatorial chemistry is a widely utilized approach to promoting rapid discovery and development of novel compounds. With advances in lab automation to aid combinatorial synthesis experiments, large and complex compound libraries can be prepared in a relatively short period of time. As a result, there is a need for fast high-throughput analytical methods to characterize the large sample arrays and accommodate the increasing sample load from discovery and development research. 1
The most widely utilized approach for characterizing large compound libraries is liquid chromatography electrospray mass spectrometry (LC-MS). 2–3 This method typically employs two detectors: electrospray mass spectrometry (ESI-MS) and UV absorption. ESI-MS is used to characterize the LC effluent for compounds that match the theoretical mass of the target compound. 4 Peaks, from the extracted-ion chromatogram, are correlated with those from the UV or other detectors (e.g., light scattering, nitrogen) to derive relative purity information. 5 6 Applied with a fast LC separation method, samples can be quickly characterized by LC-MS with high selectivity and sensitivity. However, to accomplish fast characterization of large sample arrays, researchers must rely on computer automated handling of data and instrumentation.
To date, most commercial instrument manufacturers supply computer software automation packages that are capable of acquiring signals, interpreting data, and creating reports. Although the instrument software is robust and sophisticated, it often cannot be fully configured by the instrument user for the specific demands and requirements of each individual research facility, project, or application. For example, information present in data worksheets or databases from combinatorial chemistry labs may not be seamlessly imported into the data acquisition program for runsheet or sequence file generation due to file format incompatibility. Similar problems in data format may be encountered in the reporting process, where the report files generated by the instrument software may not be presented in an appropriate format acceptable to established database and archive resources. For smaller libraries, the solution to this matter is typically the manual editing of the worksheet or report files by using cut-and-paste functions between different applications. However, this approach would be too laborious to perform for larger libraries and more likely to introduce errors during file editing.
Another limitation of much instrument automation software is that the software cannot be programmed or directed to perform actions (e.g., re-analysis of a sample), based on criteria or conditions defined by the instrument operator. It would be highly valuable if data acquisition and processing could be controlled with logical functions, where the experimental data would determine the next course of action for each sample automatically (e.g., re-try failed analysis with alternative method, different column, ion mode polarity). This would be possible for instruments supporting integrated scripted programming. 7 However, much instrument automation software either lacks or has not fully implemented this custom programming option. In addition, the macro programs developed in this manner cannot be readily adapted to other instrumentation of different platforms.
In this communication, we describe a universal approach to improving the flow of compound library data and applying logical control functions to LC-MS instrument automation software that do not fully support custom integrated macro functions. This approach involves the application of Microsoft Visual Basic macro programs, which interact with the instrument software by send-key commands. Also, the application of this approach to other data acquisition software on Microsoft Windows PC platforms is discussed.
EXPERIMENTAL
The schematic of experimental setup is shown in Figure 1. Auto-injection, LC separation, and UV diode-array detection of compound library samples were performed on an HP1100 HPLC system (Agilent, Wilmington, DE). Direct mass analysis of the LC effluent was performed on a VG Platform II quadrupole electrospray mass spectrometer (Micromass, Beverly, MA). HPLC and MS instrumentation were controlled by Micromass Masslynx™> and Openlynx™ software applications. Compound library data are incorporated into a worksheet by Accord (Synopsys Scientific Systems, Leeds, UK) for Microsoft Excel 97 (Microsoft, Redmond WA). Custom automation of LC analysis (i.e., runsheet generation, LC, and MS analytical method selections) was accomplished by the development of macro programs using Microsoft Visual Basic for Excel 97.
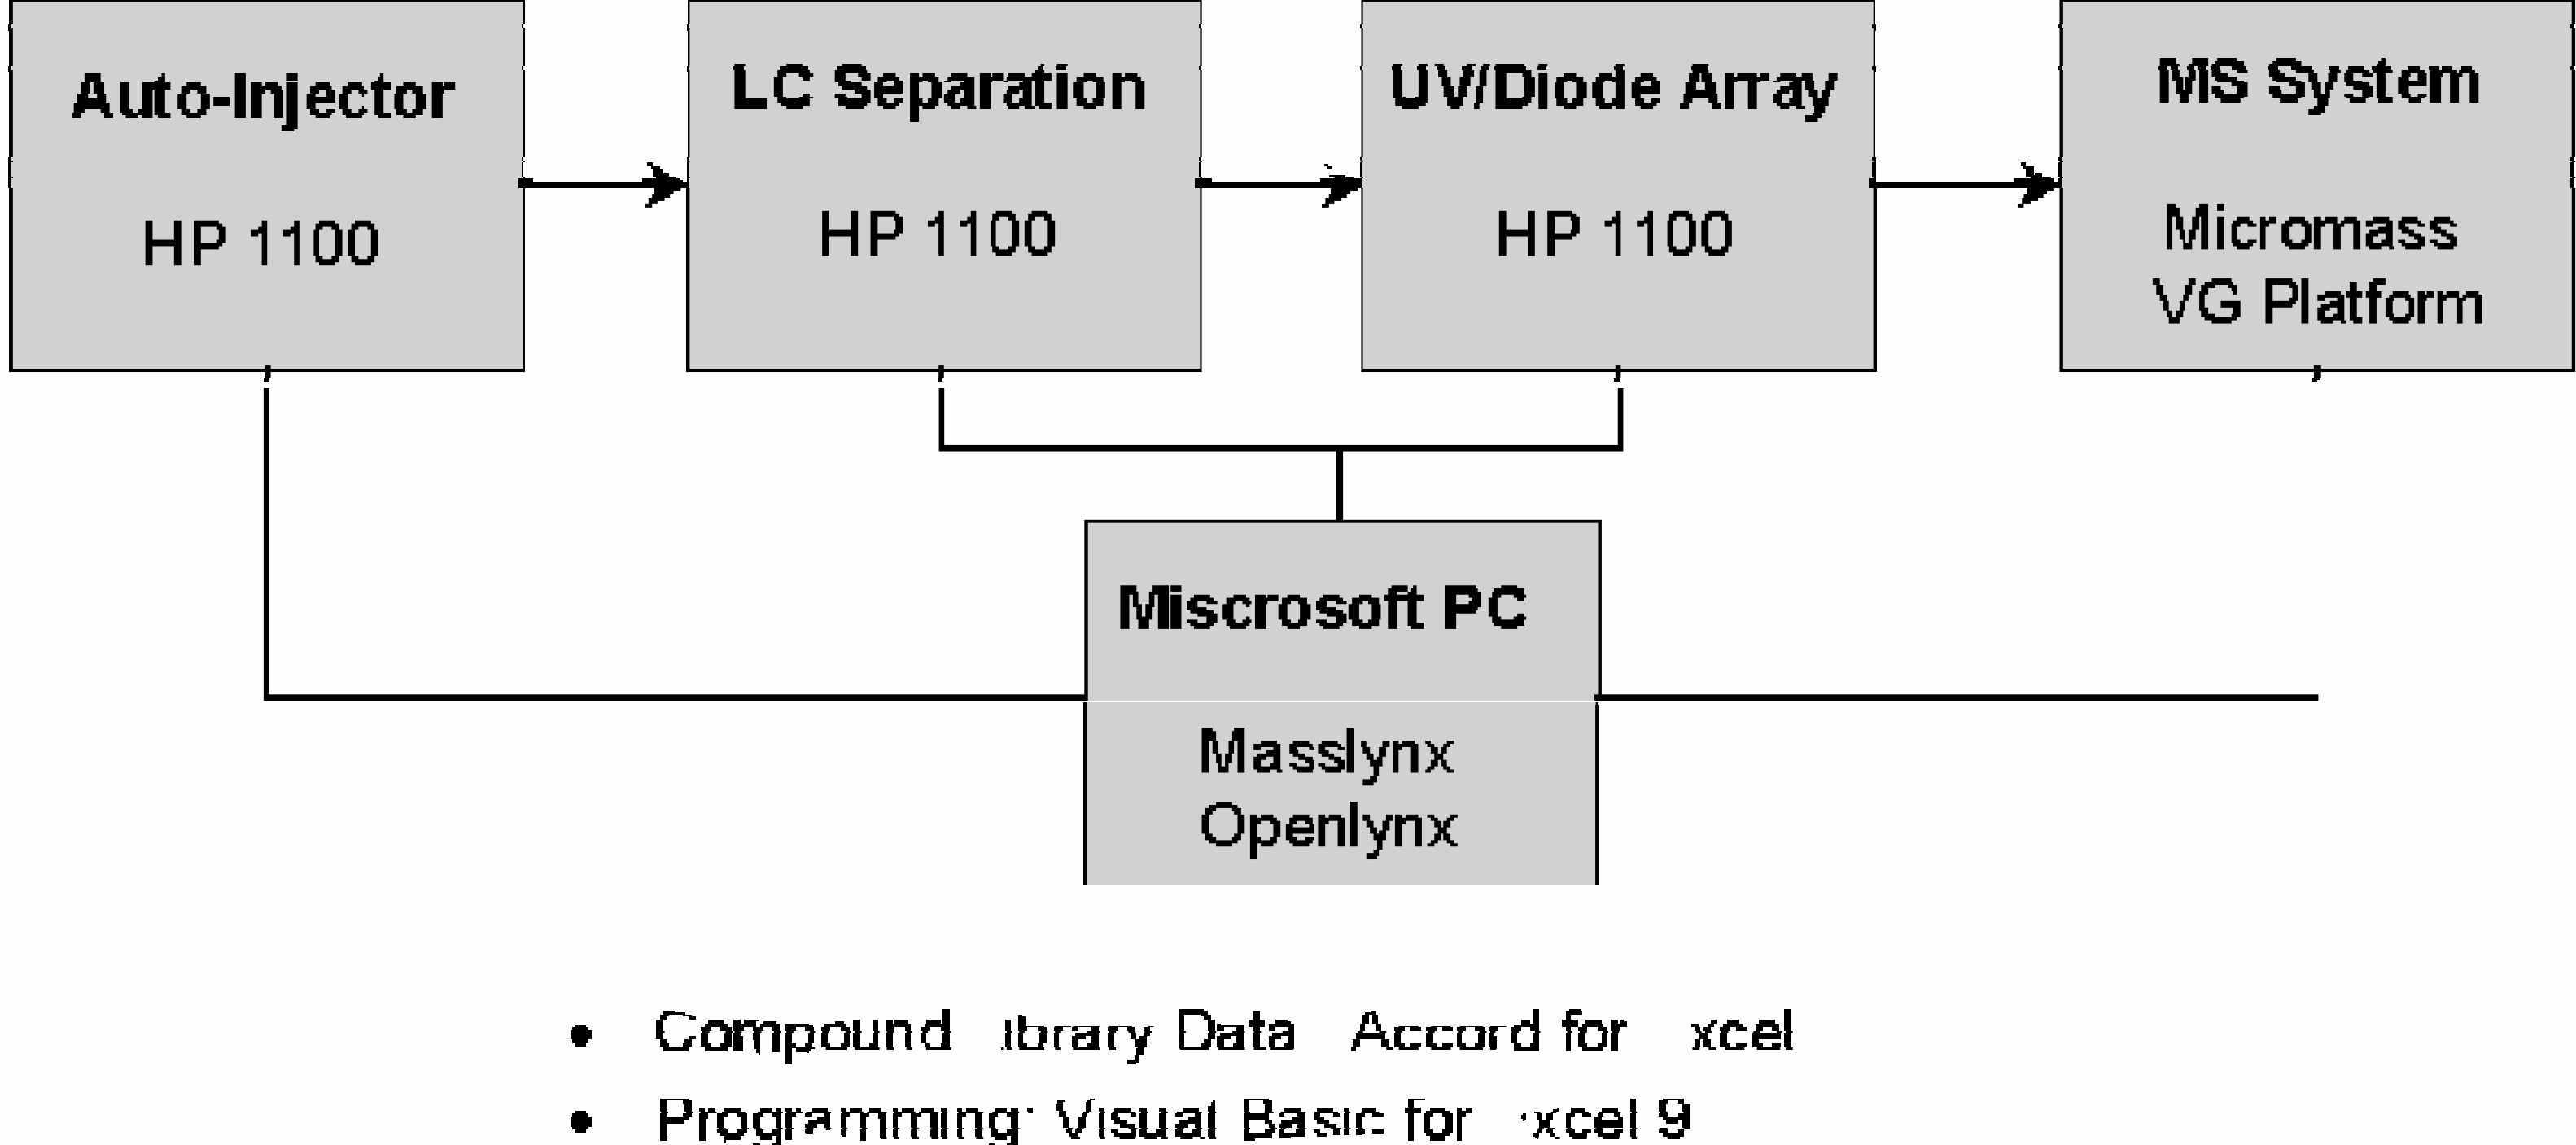
Schematic of the LC-MS analysis.
RESULTS AND DISCUSSION
There are several procedures involved in the high-throughput LC-MS analysis process, as shown in Figure 2: (A-B) runsheet generation, (C) data acquisition and interpretation, (D-E) processing of interpreted data, (F-G) report generation and data archiving. All steps, except for (C), are not automated and require direct user interaction. Custom automation of entire LC-MS analysis process was accomplished by developing a macro program to perform each of the non-automated steps. Instrument actions (e.g., file open, start sample acquisition, and processing) were directed to the Masslynx™ software by macro send-key command functions (i.e., keyboard emulation).
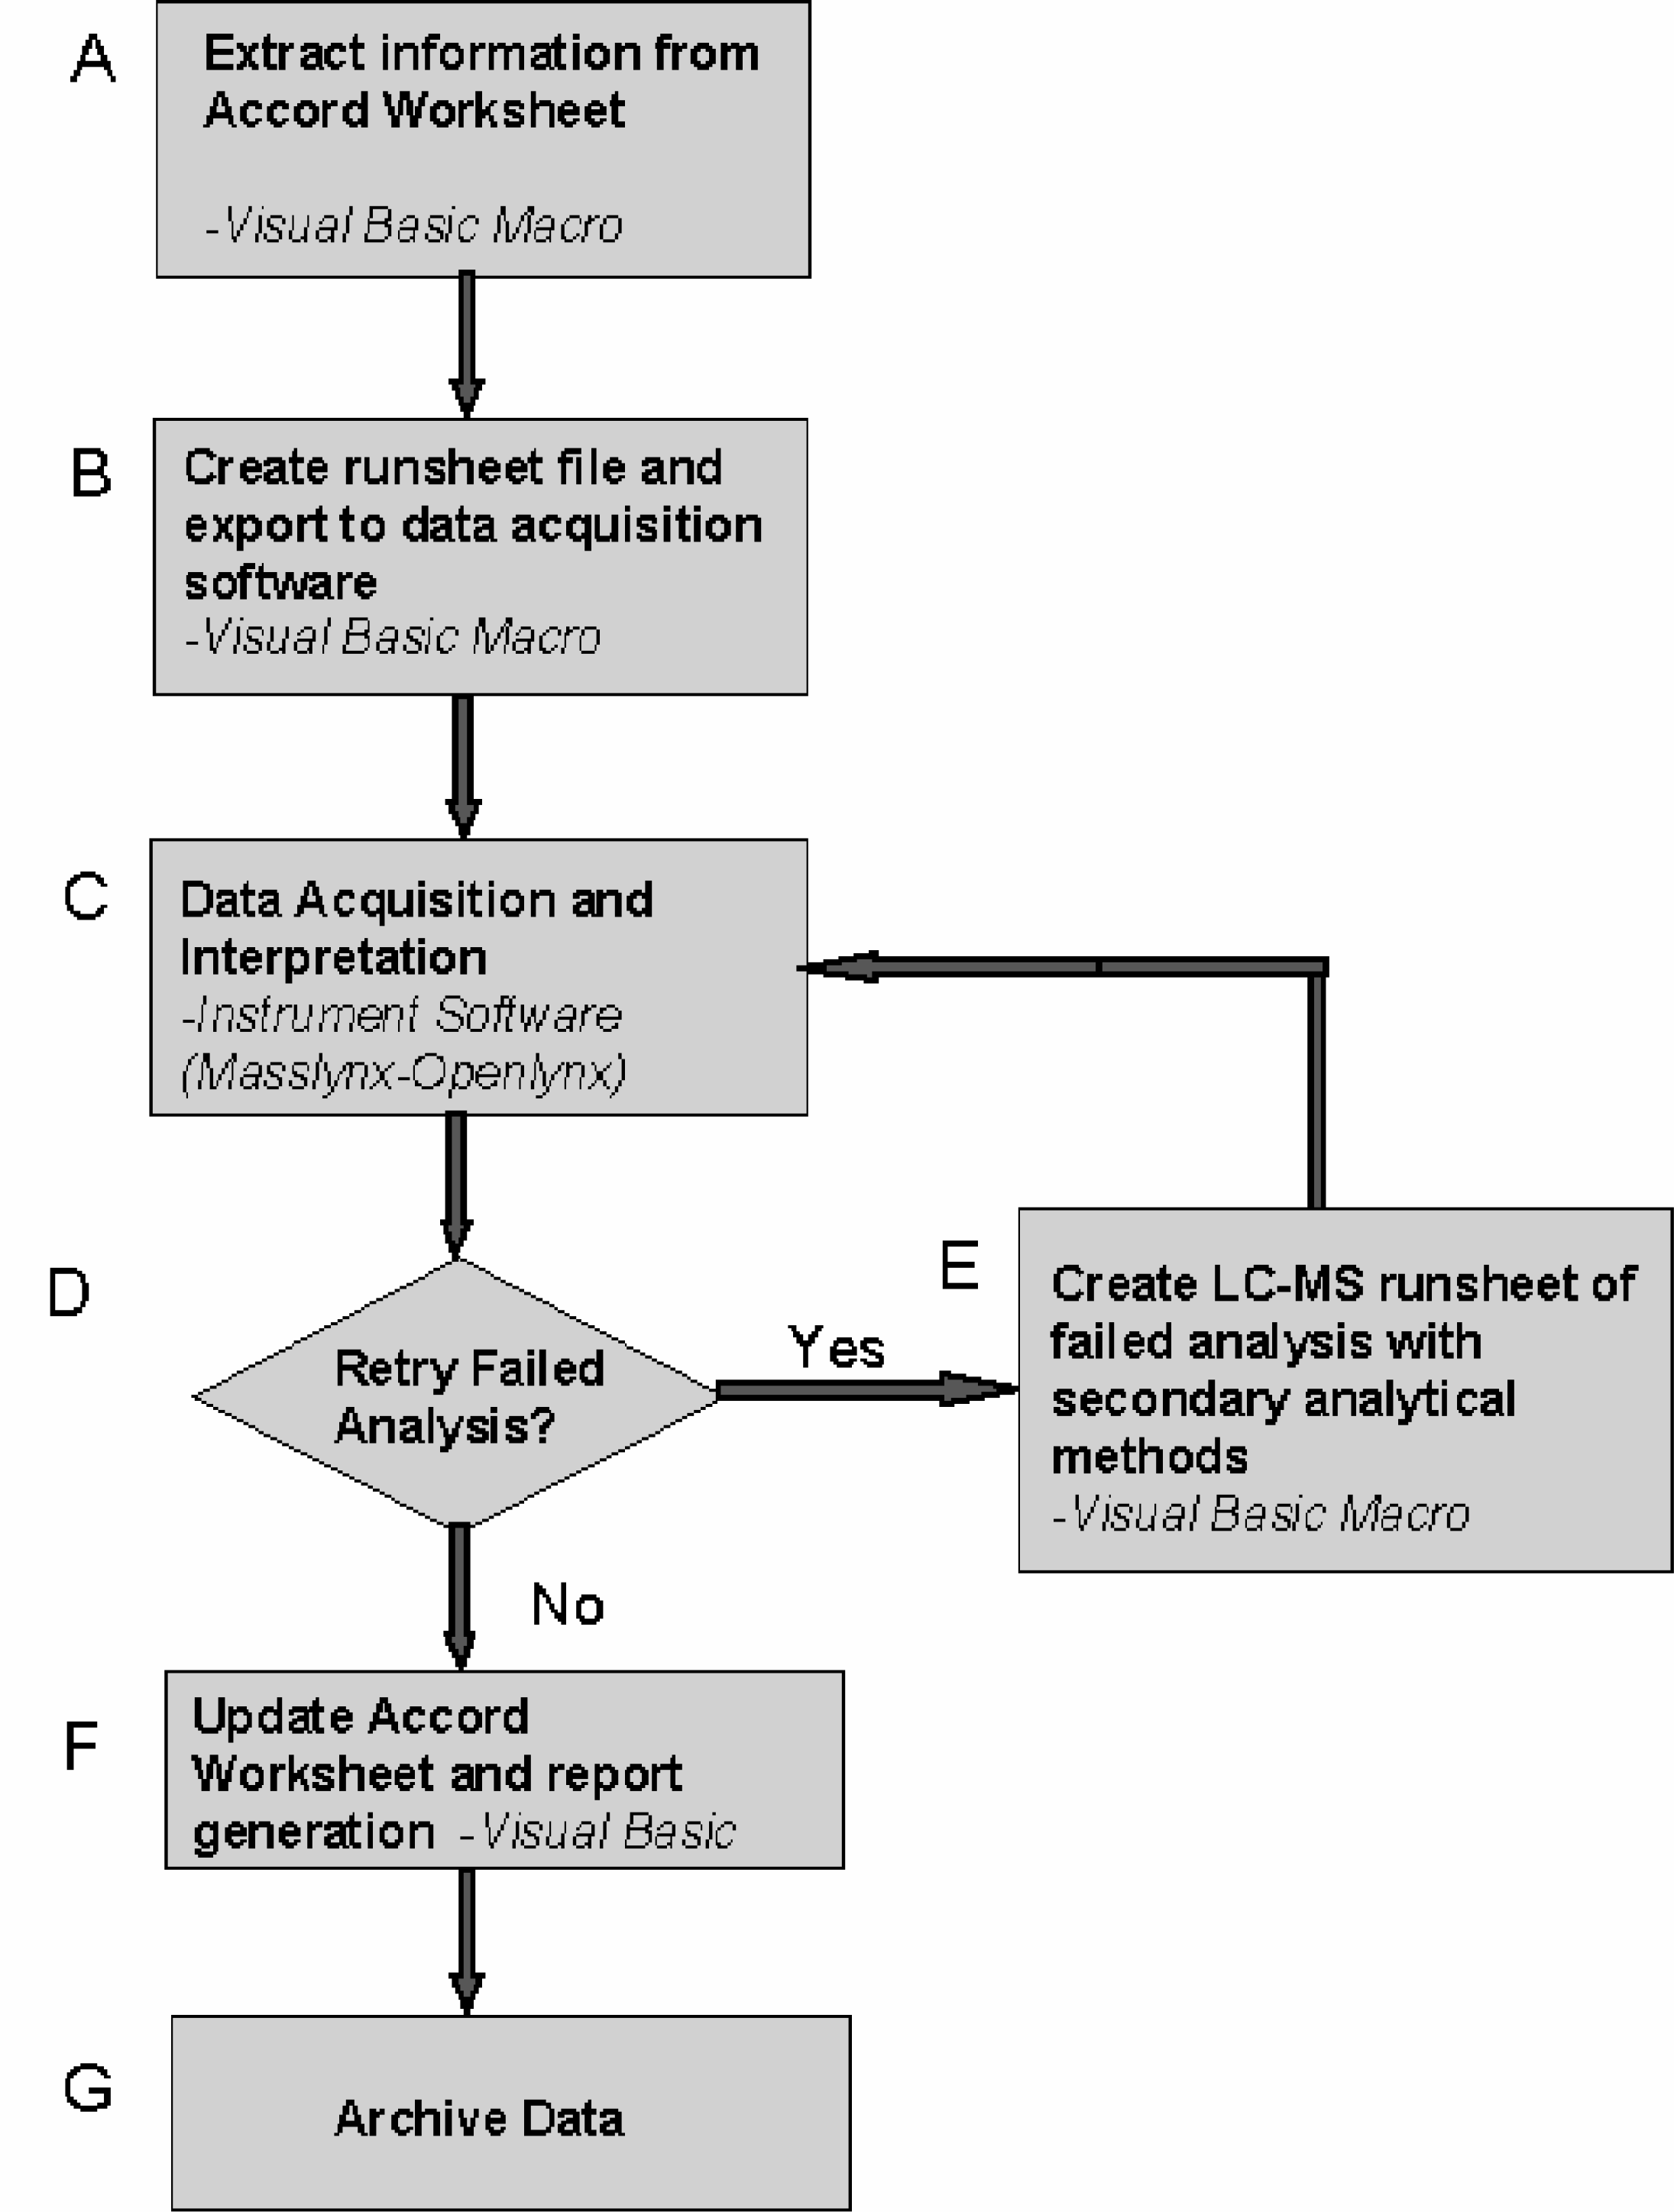
Summary of macro functions applied in the analytical method.
An Accord worksheet, used to develop each library of compounds, contains sample information required to generate a runsheet or sequence file for LC-MS data acquisition (i.e., sample location, identification/reference number, target mass). However, the worksheet does not contain sufficient information to create a complete runsheet nor can it be directly imported into the Masslynx™ data acquisition program due to format conflicts. A Visual Basic macro was used to extract all pertinent information from the Accord worksheet and generate a text file that can be opened by the Masslynx™ software as a complete runsheet (Figure 2, A-B).
The Accord worksheet is scanned by the macro for selected keywords to determine which columns contain the necessary data for the runsheet generation process. Each sample is assigned a unique filename based on its identification number and date of data acquisition. Structural information available on the Accord worksheet is used to determine the exact mass of the target compound. Analytical methods for separation, detection, and quantification can be either set to a standard default setting or selected by the instrument operator at time of runsheet generation. Immediately after the worksheet is saved, the macro activates the instrument automation software using send-key commands to load the appropriate worksheet into Masslynx™, and begins data acquisition. Screen captures of the runsheet generation process are shown in Figure 3.
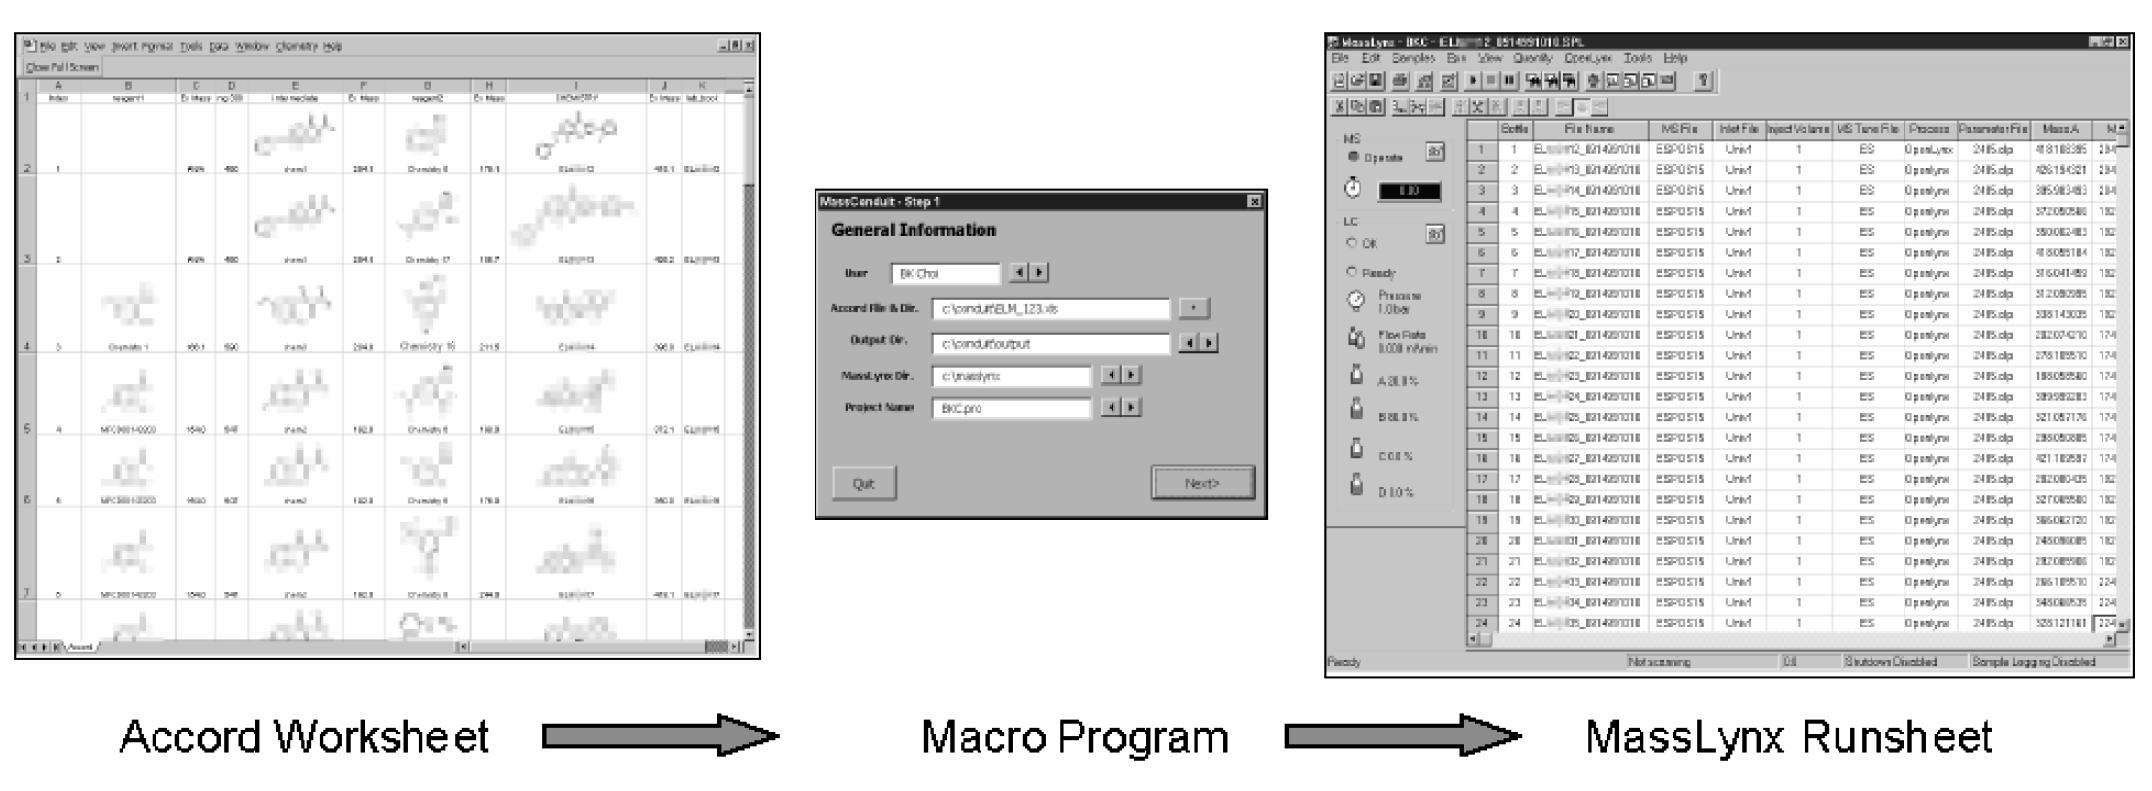
Screen captures of the runsheet generation process.
Following data acquisition and interpretation of the acquired UV and MS data by the Openlynx™ instrument automation software (Figure 2, C), a text file can be generated with a summary of the analysis results. Typically, this summary identifies whether the target compound is found and its relative UV purity. However, a failed analysis is not necessarily indicative that the target compound is not present in the sample. Successful detection of the compound may be attributed to the analytical method used to characterize the sample (e.g., polarity of ionization, LC separation method).
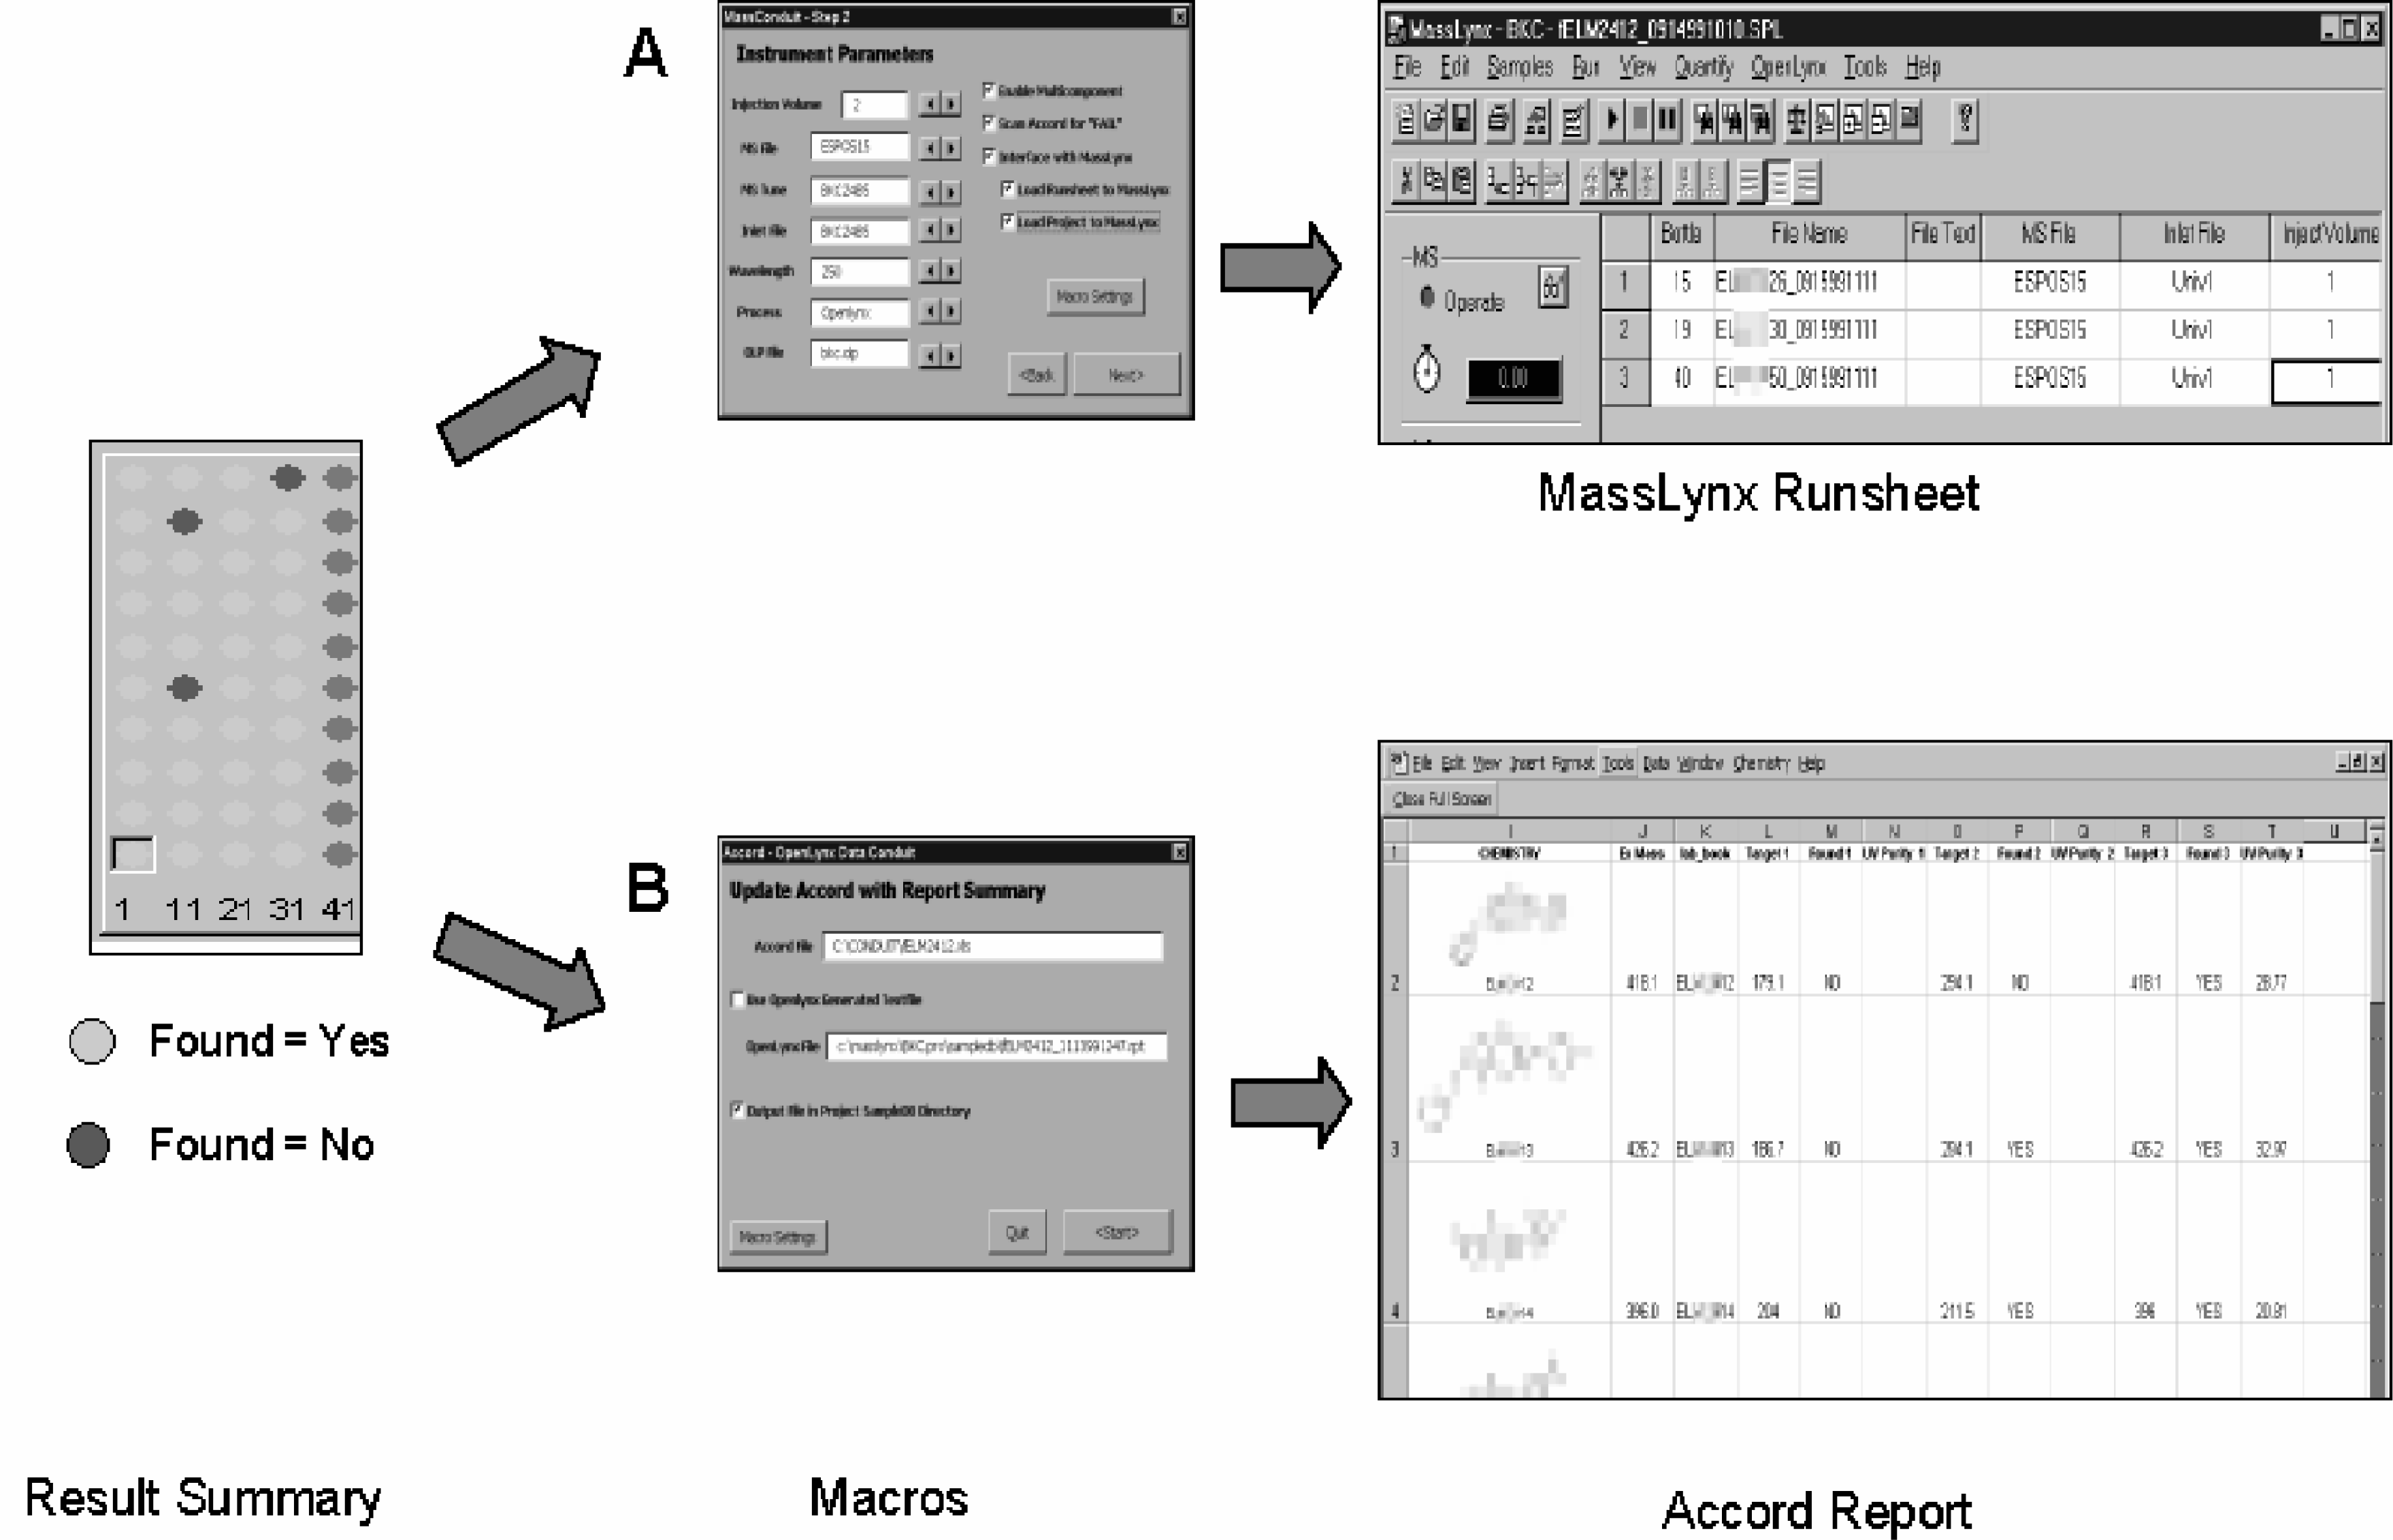
A second Visual Basic macro was applied to extract data from the result summary text file for additional processing and analysis (Figure 2, D-E). The data for each sample analysis are scanned for criteria that the user would define as a failed analysis (e.g., mass not found, purity below defined limit). Logic functions are programmed into the macro to select analyses identified as failures and compile a new runsheet for a second analysis. This new runsheet would utilize an alternative analytical method. Screen captures of the macro are shown in Figure 4A. The alternative analytical method can utilize different LC columns, mobile phase compositions, ESI-MS ionization polarity or spray voltage parameters.
After completion of the analysis, the summary result data must be converted into an appropriate report format that would be acceptable to established database resources (Figure 2, F-G). A third Visual Basic macro is used to extract information of interest from the raw text summary data and incorporate pertinent result data (e.g., found, not found, pure, not pure, % purity) back the original Accord worksheet. Screen captures of this process are shown in Figure 4. The updated worksheet would then be exported to the database management software for archive purposes.
This approach to automating LC-MS analyses offers a number of advantages. The Microsoft Visual Basic macros can be readily written in house with limited programming training. The target structural information present in the Accord for Excel worksheet can be used to develop more sophisticated macros where the analytical methods are automatically selected based on the target analyte's calculated chemical properties (e.g., LogP, pKa). A macro can also be developed for special characterization applications. Using the Openlynx™ report file, the processed sample data may be scanned for a specific isotopic distribution, fragments, or unanticipated adducts of the molecular ion (e.g., dimers, reagent adducts) using structural information from the worksheet as a reference. Summary result data can be used by macros to automatically perform special interpretation functions for other applications (e.g., stability screening). Based on results or criteria defined by the user, macro programs can be developed to make basic and fundamental decisions on the next course of action for each sample (e.g., keep for further analysis or submit for reporting).
Another important advantage of this approach to customizing instrument automation is that many of the procedures and functions can be adapted for other instrument platforms relatively easily due to the flexibility of the Visual Basic programming language and the send-key command functions. The majority of the programming code can be adapted for other instrumentation with minimum revisions to the overall code. The macros were initially applied to a Micromass LC-MS system and subsequently to a Thermoquest Finnigan AQA™ LC-MS system controlled by the Xcalibur™ and Discovery™ automation software. Each of the separate macros for runsheet generation, data interpretation and reporting can be readily applied to virtually any instrument which is operating on the Microsoft Windows PC platform.
CONCLUSIONS
An approach using Visual Basic macros to customize automated LC-MS analysis of compound libraries is described. The efficiency of automated analytical methods was enhanced by the improved data flow between the library synthesis and analysis stages, and by incorporating logical functions to direct actions based on defined result criteria. This approach to applying macros to LC-MS analysis can be used to supplement the automation process of analytical systems operating on the Microsoft Windows PC platform.
ACKNOWLEDGEMENTS
The authors would like to thank the Rohm and Haas Company Bionet Committee for research support.