
Abstract
A manual, multi-point dissolution test for powder filled capsules was transferred to an automated dissolution method utilizing a Zymark® Multidose® Automated Dissolution Workstation, a MultiFill® station, and a Distek 2100B dissolution bath system. Both methods require a final HPLC analysis of the sample solutions.
Several MultiDose system parameters were evaluated to ensure product result integrity and equivalency. These included carryover studies, line flush studies, vessel wash studies, filter studies, and sample evaporation studies. The most critical evaluation was the statistical analyses (equivalence) of the product results from both methods.
This presentation was given at the 2000 International Symposium for Laboratory Automation and Robotics (ISLAR) held in Boston, MA, October 15-18, 2000. The full manuscript is available on CD-Rom and can be acquired by contacting Christine O'Neil, 508-497-2224; email
INTRODUCTION
Dissolution is an area where there is little a laboratory can do to truly improve turn-around time. The specified dissolution time is the time of the actual dissolution run and we are tied to that time. Manually performed dissolution testing is generally very dependent on analyst assistance and involvement. Even on short runs, the analyst must fill the vessels, measure the temperature of the media, drop the tablets or capsules, pull aliquots of sample solution for test at specified times, and at the end of the test, discard the used media and clean the vessels for the next run.
Most laboratories have increased efficiencies by using automated media heaters, degassers, and/or dispensers. They have also utilized different types of automated samplers or automated samplers equipped with a detection device (flow-through spectrophotometers) to increase efficiency and decrease analyst involvement. Several companies have developed automated dissolution systems. The advantage of these systems can be realized in several ways. First, the automated cleaning of the bath vessels can eliminate costly analyst time and vessel breakage (safety). It also provides a more consistent cleaning technique. Second, except for initial run setup, the overall automation testing can be performed without an analyst being present. This allows the analyst to perform other tasks in the lab while the system is running. Or, the system can be run on ‘off shifts’ (night) or when minimum lab crews are available. Also, automated systems have capabilities to drop the tablets or capsules, record the media temperature prior to and after the test, degas and dispense the media, sample the vessels at preprogrammed times, filter the sample solutions, and perform some limited analysis to those sample solutions. Some of the systems available today can also perform several different dissolution tests in a single series of runs. For example, different products or formulations requiring different media or different sampling times can be tested within the same run series.
The main objective for utilizing automated dissolution for our laboratory was to incorporate these time saving advantages. The transfer of a relatively short run-time, currently validated dissolution method from either a semi-automated or manual technique to a Zymark MultiDose Dissolution System was deemed the most efficient course to take.
The selected product for transfer was a 60-mg powder-filled capsule (hard gelatin). The dissolution method utilizes a USP type 2 apparatus with a rotation of 50 rpm, the media is 900-mL of deionized water at 37 ± 0.5 °C. The sample times are specified at 15 and 45 minutes.
EXPERIMENTAL
Filter Study
Filter comparison studies were necessary due to a proposed change to the current approved methodology. The current auto-sampler method utilized 45-μm polyethylene sample-probe-tip filters. The automated system incorporates carousel heads, which are mounted on top of each vessel. The heads include sampling lines, themistors, media transfer lines, and tablet/capsule holding cells. This greatly restricts access to the sample probes for filter changes. The changing of probe filters would also require analyst involvement between individual runs. To maintain the filtering step, the automated system we selected for use utilizes a filter station, which dispenses 25-mm syringe type filters.
The initial filter study was investigated for possible holdup of the active ingredient by the filter media. Studies were conducted using a reference standard solution and manually filtering it through different media filters. A ten-mL syringe, fitted with a filter, was filled with the reference standard solution. Six HPLC sample vials were sequentially filled with approximately 1.5 mL of solution. The same procedure was conducted for each respective filter type. Each set of filtered solutions was analyzed against the unfiltered reference standard. The results for the filter investigation are presented in
Filter Comparison Study Results for Holdup of Fexofenadine HCl
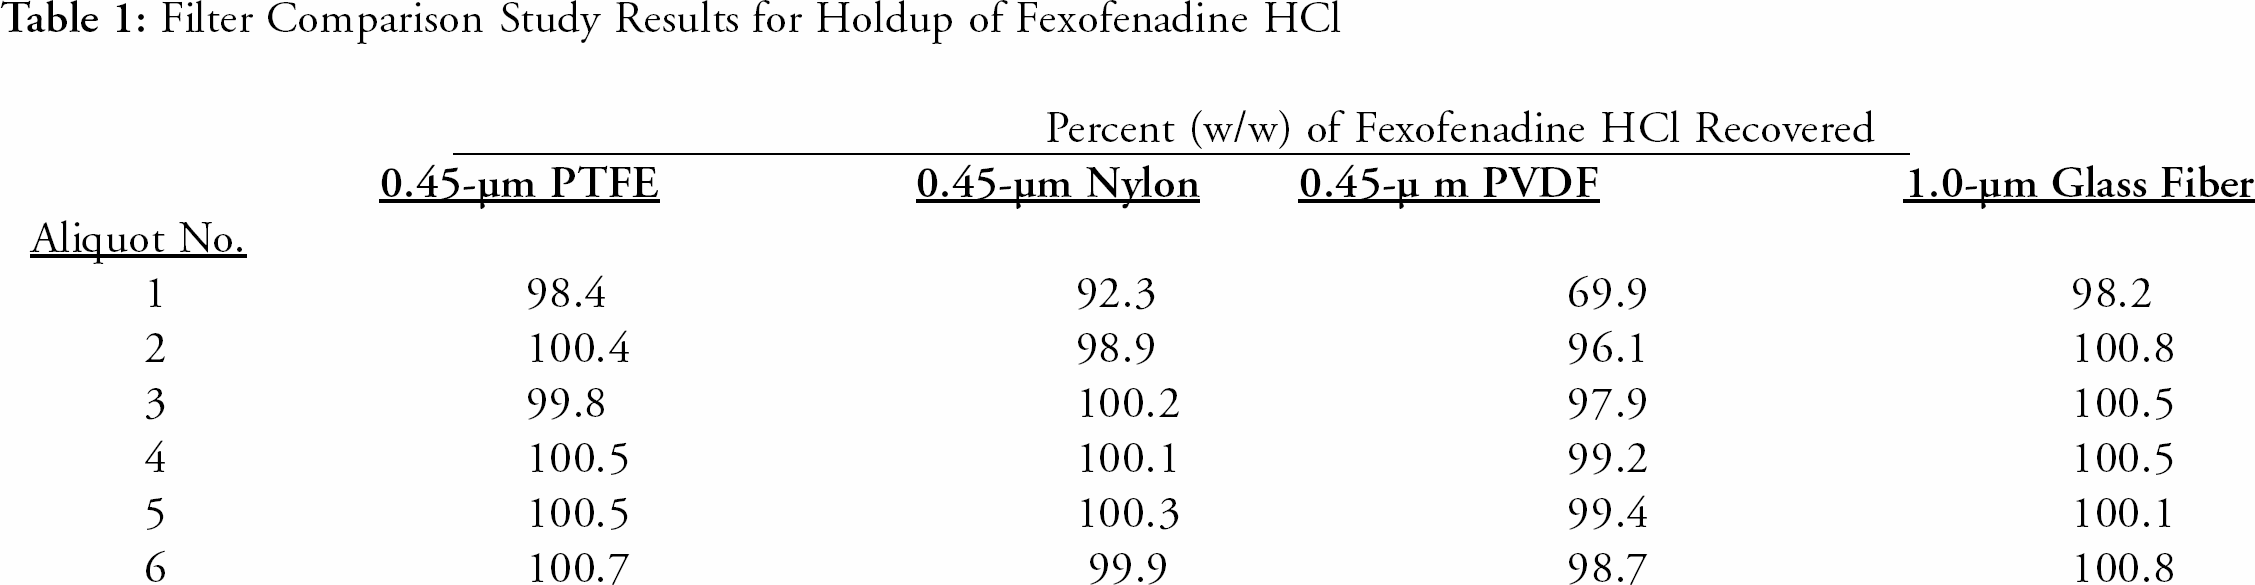
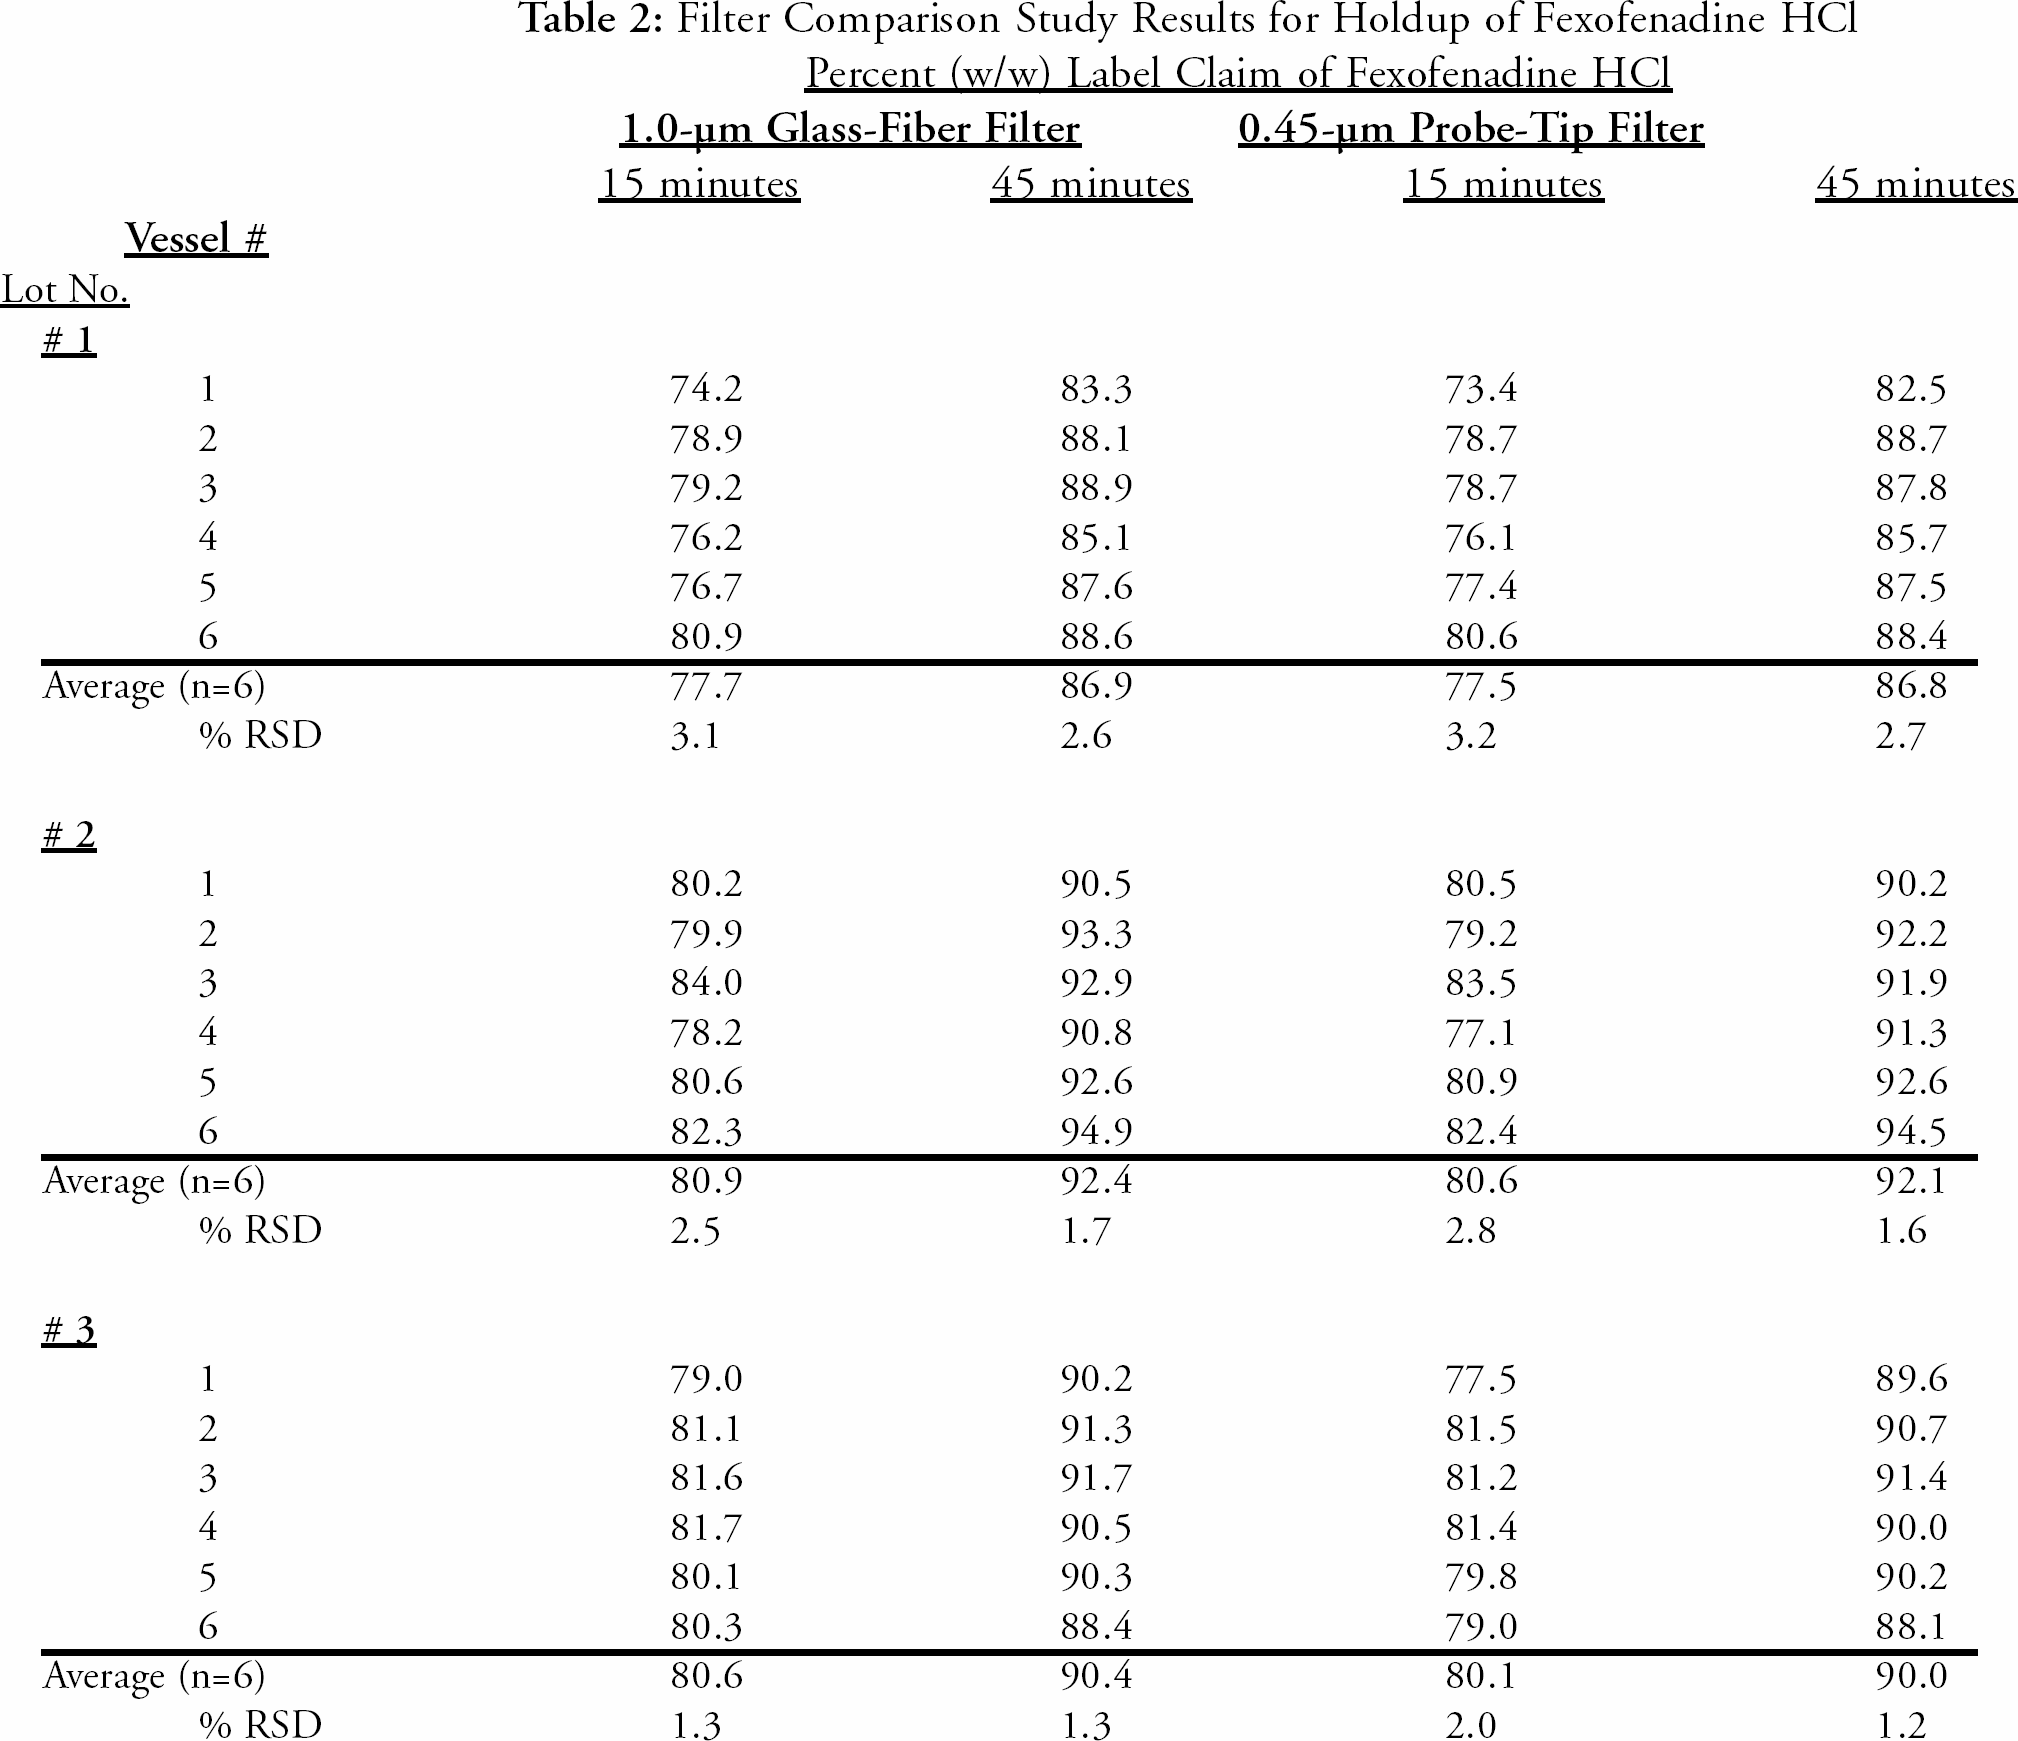
1.0-μm glass fiber filters were selected for further investigation due to the lower backpressure observed and acceptable results obtained for Fexofenadine HCl. Stock sample solutions from three different lots of product were filtered through the current polyethylene filters for HPLC analysis. The same stock sample solutions were filtered through the proposed glass fiber filters for further analysis. The samples were analyzed on the same HPLC system for a direct comparison of the Fexofenadine HCl results. The results of the study indicate that there was no significant difference for Fexofenadine HCl using either type of filter. The results are presented in
Filter Comparison Study Results for Holdup of Fexofenadine HCl
Flush Volume Study
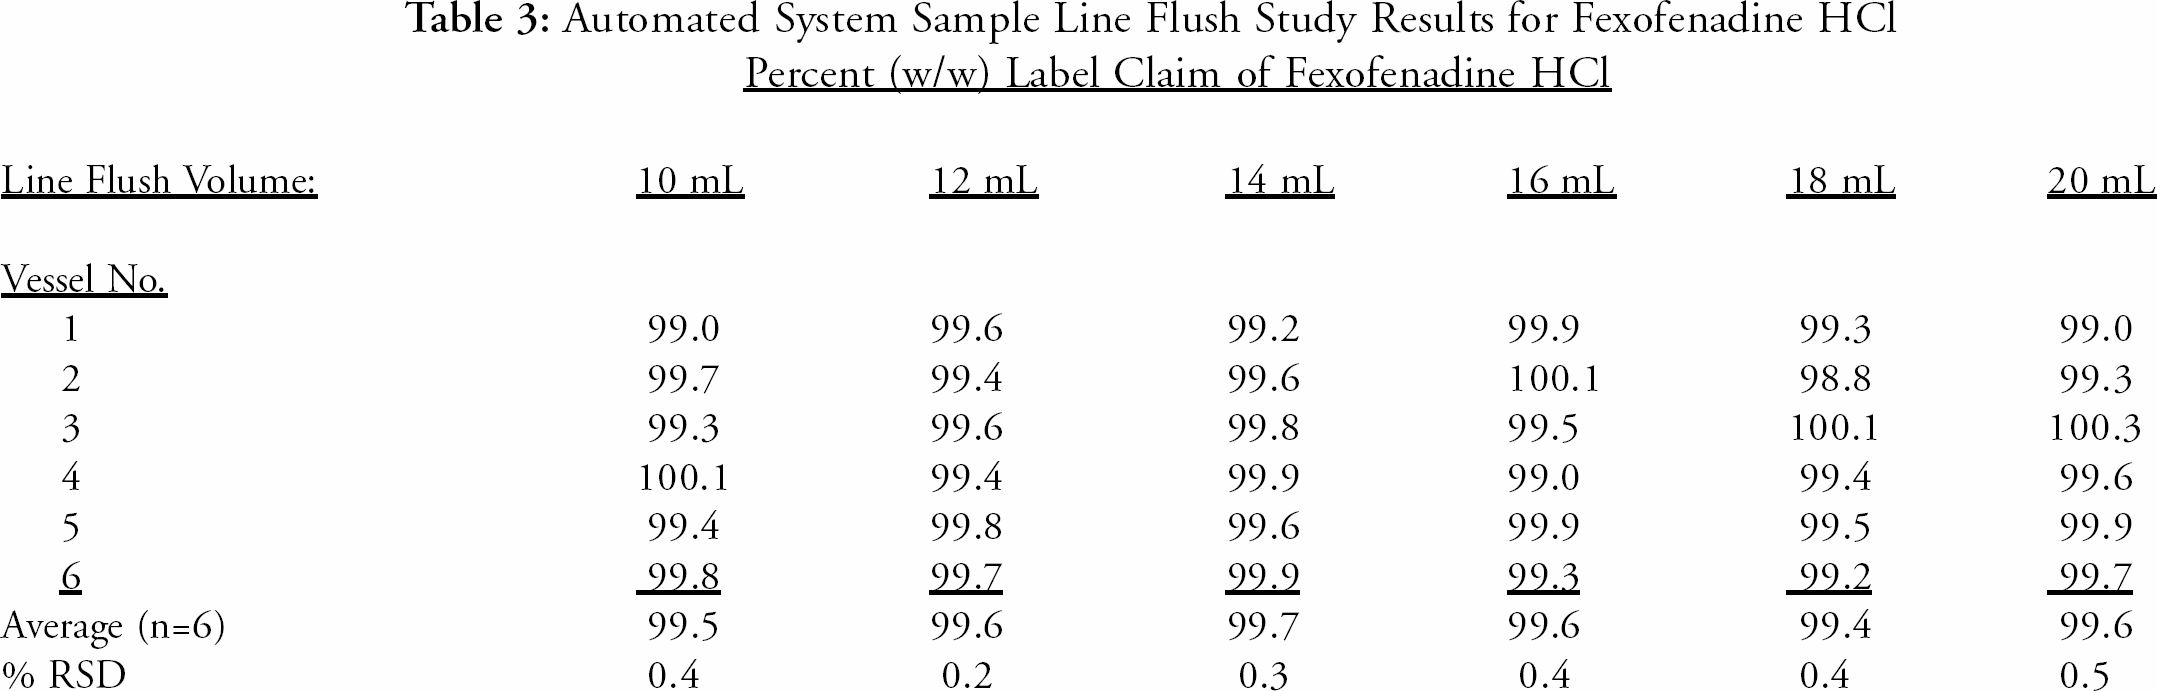
A flush volume study was performed to determine the minimum volume required to thoroughly flush the Multidose system sample lines between each set of sample test solutions (different time points) for the same dissolution run. There are several volume options to choose from in the automated system software. The study evaluated each volume option to minimize the chance of cross-contamination with the previous time-point sample. The 12-mL volume option was selected to ensure adequate flushing of the sample lines. This option extends beyond the acceptable results achieved with a 10-mL flush and beyond the lowest flush setting, also 10-mL. The flush volume study results are presented in
Automated System Sample Line Flush Study Results for Fexofenadine HCl
Sample Carryover (Run to Run)
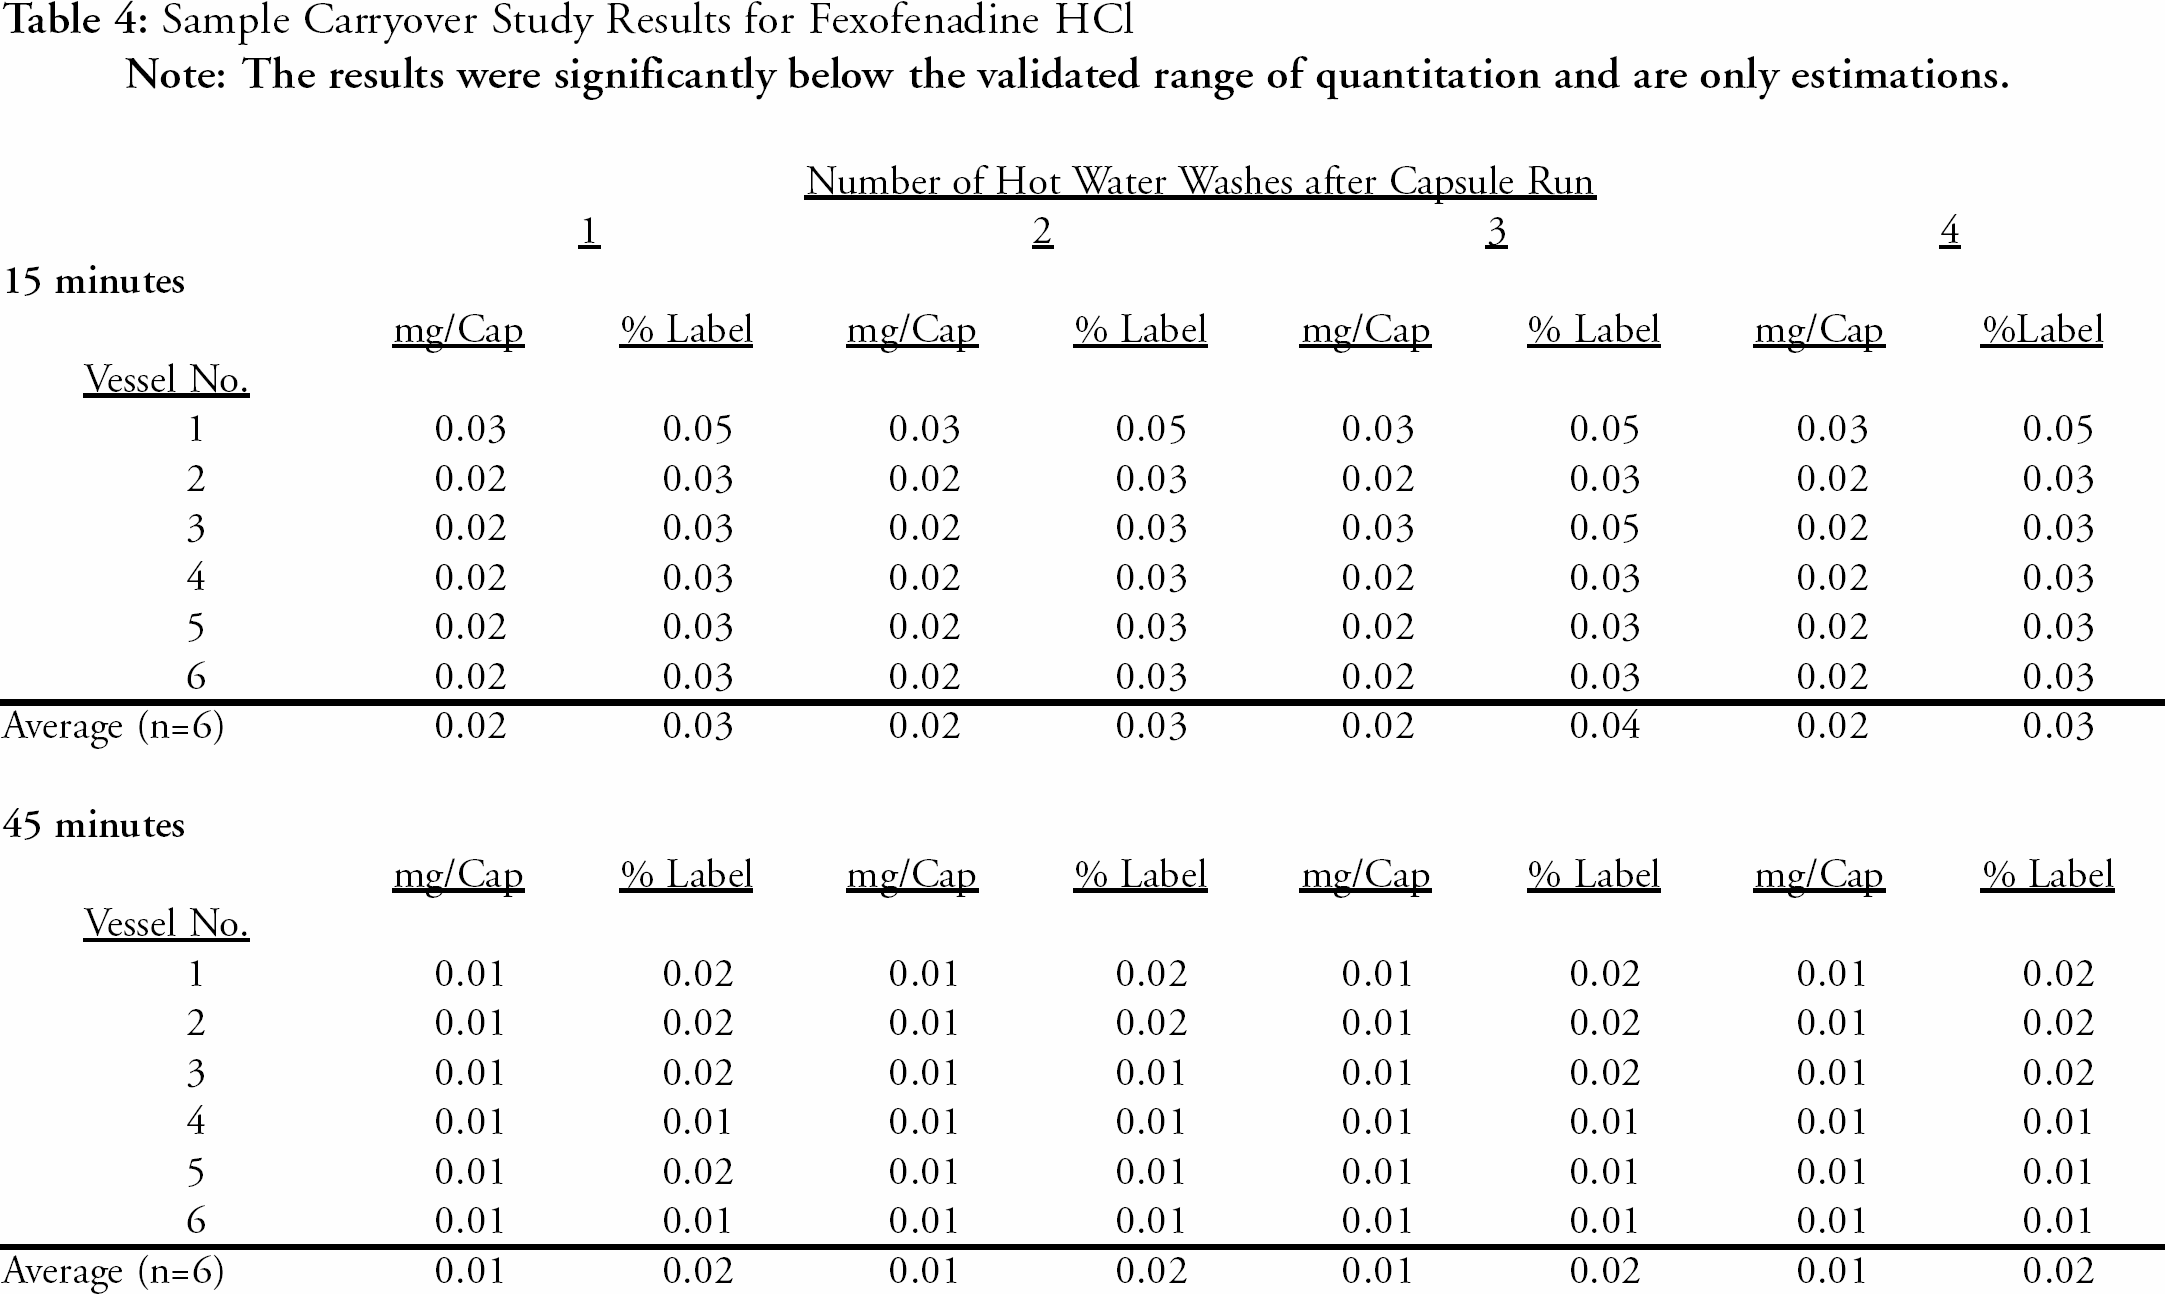
A study was conducted to evaluate sample carryover from previous runs. This study helped determine the number of wash cycles at the end of a run to assure proper washing and rinsing of the vessels and sample lines prior to the next dissolution run. The automated system was set up for eight separate runs. Four of the eight runs were performed using product samples (capsules) while each run following a capsule run was performed using only media (water). For example, the first run was performed using a set of six capsules. For the next run, the capsule/tablet dispenser did not dispense any samples into the vessels so the run was performed as a media blank to monitor Fexofenadine HCl carryover from the previous run. The number of hot water wash cycles was sequentially increased from one to four for each set (capsule run/media blank run) of dissolution runs to determine the number of washes required to adequately clean the vessels and lines to eliminate sample carryover to the next run.
The water blank samples following each capsule run were analyzed for residual Fexofenadine HCl by HPLC. The detected levels of Fexofenadine HCl from this study were significantly less than the validated range of quantitation and below the validated linear range, therefore the carryover results are only estimations. The results for the water blank samples for the 15-minute time point indicate less than an estimated 0.05% of label claim (60 mg Capsules) of residual of Fexofenadine HCl remaining after each of the four levels of hot water wash cycles. The results for the 45-minute time point were not more than an estimated 0.02 % of label claim residual Fexofenadine HCl for each of the hot water wash cycles. The results indicate adequate washing and rinsing at one wash but the proposed automated method specifies two wash cycles prior to the start of the next run. This ensures adequate washing and rinsing of the vessels and lines and also extends beyond the minimum limit (1) of washes for the system. The results for the carryover study are presented in
Sample Carryover Study Results for Fexofenadine HCl
Sample Solution Evaporation Study (septa integrity after puncture by MultiFill™)
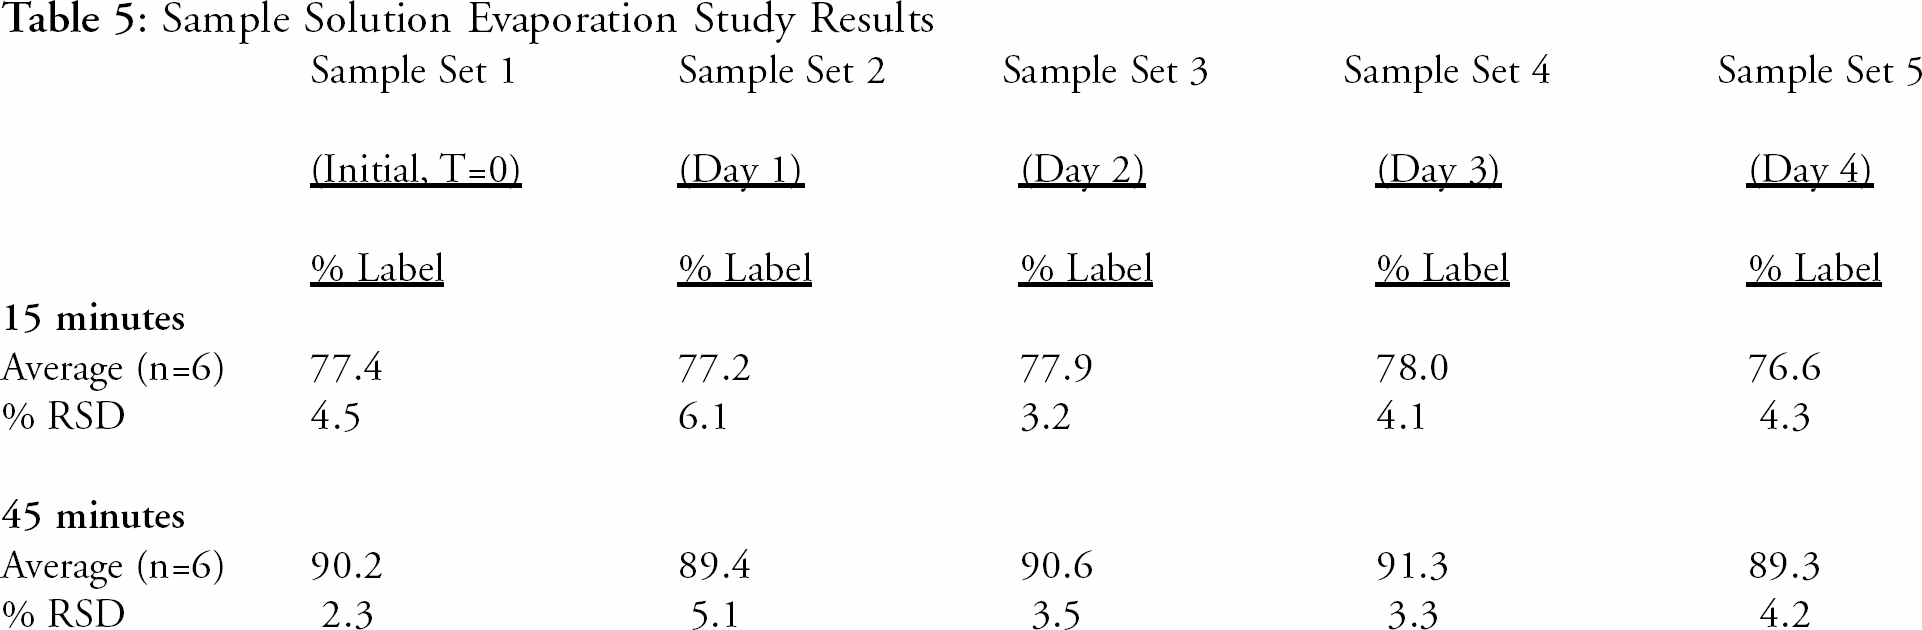
A study was conducted to evaluate the evaporation stability of the sample solutions in split-septa capped HPLC vials from one to four days on the sample dispensing station. This would allow HPLC analysis of samples on Monday from dissolution runs performed on Friday. In order to mimic actual dissolution tests, five sets of six, 60-mg Fexofenadine HCl capsules from one sample lot were tested using the automated system with the specified parameters in the proposed automated method. A single sample set of 6 capsules was tested for each stability evaluation time point. For example, all five sets of samples were tested consecutively on the same day, with sample solutions drawn at the specified 15 and 45-minute intervals. The samples were stored, undisturbed, in split-septa capped HPLC vials on the sample dispensing station at ambient laboratory conditions. Sample set number one was removed from the dispensing station and analyzed by HPLC the same day the samples were drawn (Day 0 or Initial). Sample set number two was removed and analyzed by HPLC the next day (Day 1), sample set three was removed and analyzed by HPLC the following day (Day 2), and so on for samples for Day 3 and 4. The results presented in Table 5 indicate that the sample solutions are stable from evaporation in the split-septa capped vials for up to four days.
Sample Solution Evaporation Study Results
Equivalency Study
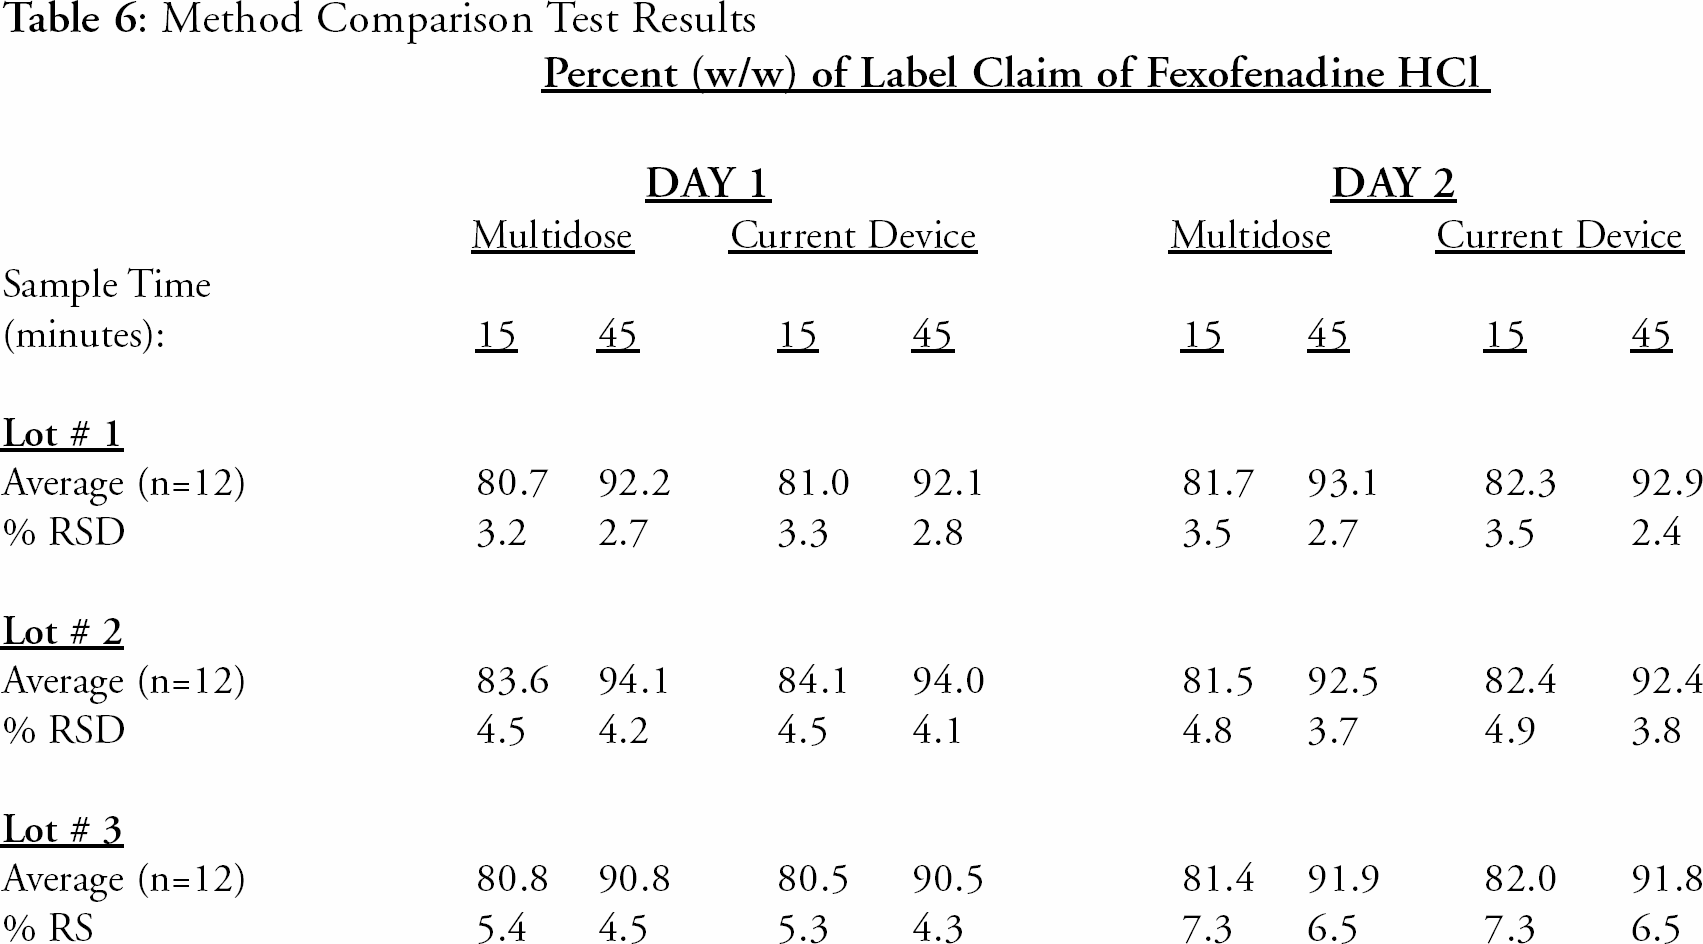
Three separate lots of product were tested at n=12 over two separate days (n=24 for each lot). The sampling from the vessels was performed simultaneously using two different sampling devices. One sampling device was the current approved auto-sampler, while the other device was the proposed automated dissolution system. The sample solutions were drawn from the vessels at 15 and 45-minutes using each method's technique (filters, flush times). Both sets of samples from each lot were analyzed on the same HPLC run for direct comparison of the Fexofenadine HCl results. The results are presented in
Method Comparison Test Results
RESULTS
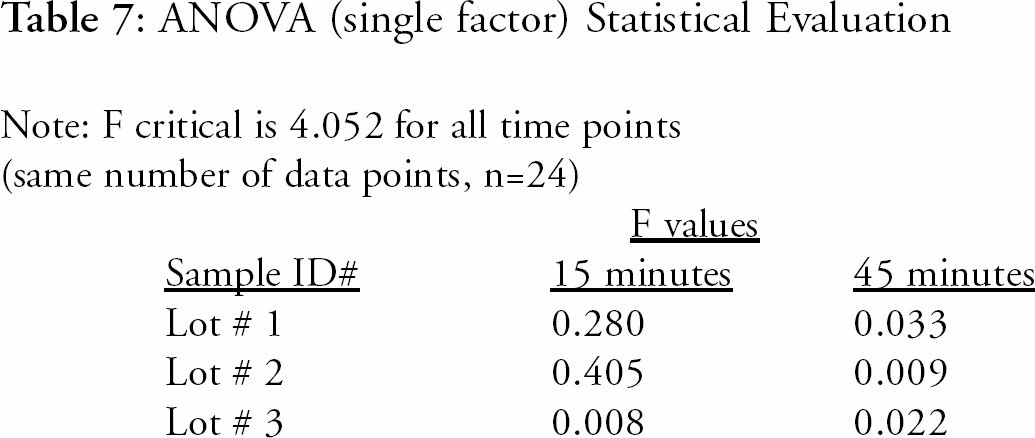
The comparison study results were evaluated using several statistical techniques. The data was evaluated using single factor Analysis of Variance (ANOVA, single factor) and the results indicate that the methods are equivalent. The ANOVA results were significantly lower than the allowed critical value for equivalence. The ANOVA results are presented in
ANOVA (single factor) Statistical Evaluation
The data was further analyzed using the paired two-sample t-test statistical evaluation. The results of the comparison of the two sets of data indicate that there could be issues with the 15-minute time points for two of the three tested lots. The results are higher than the t-test (95% confidence) critical limit and indicate that they may not be equivalent. The results are presented in
t-Test (paired two sample) Results: t critical (two-tailed) = 2.0687 for all time points (same number of data points, n=24)
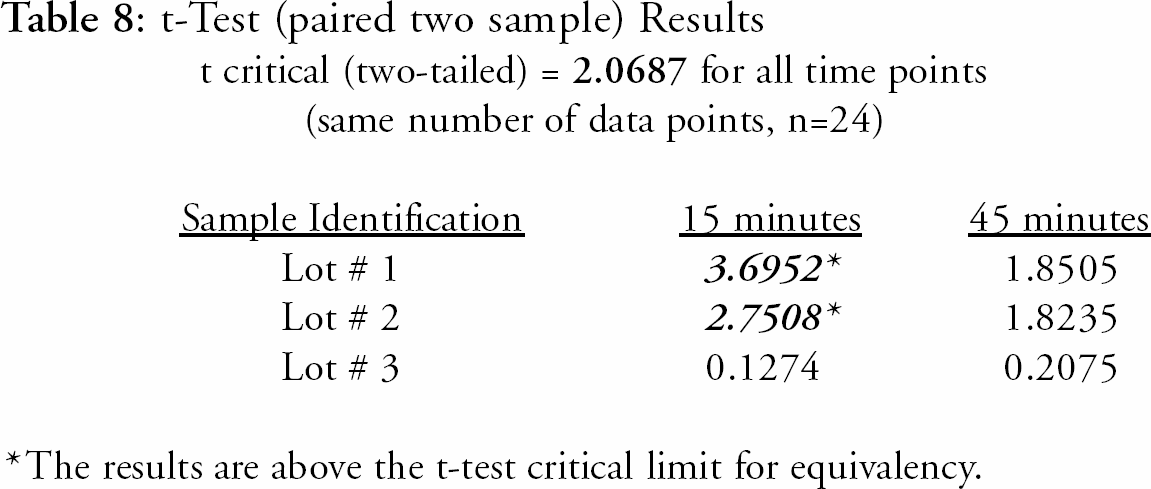
The results are above the t-test critical limit for equivalency.
The data was again evaluated using the statistical formulas presented by the Food and Drug Administration for Dissolution Testing of Immediate Release Solid Oral Dosage Forms 1. This statistical evaluation of the data compares the results from a currently approved technique or method to those obtained using a proposed, new technique or method. The average data from each time point for each technique are compared and the overall difference (Difference Factor, f1) and similarity (Similarity Factor, f2) of the two curves is calculated. For the curves to be similar, the f1 factor should be close to 0 (zero) (0–15) and the f2 factor should be close to 100 (50–100). The formulas for the f1 and f2 factors are displayed in
Formulas for the Difference Factor (f1) and the Similarity Factor (f2) for Dissolution Comparison Analysis.

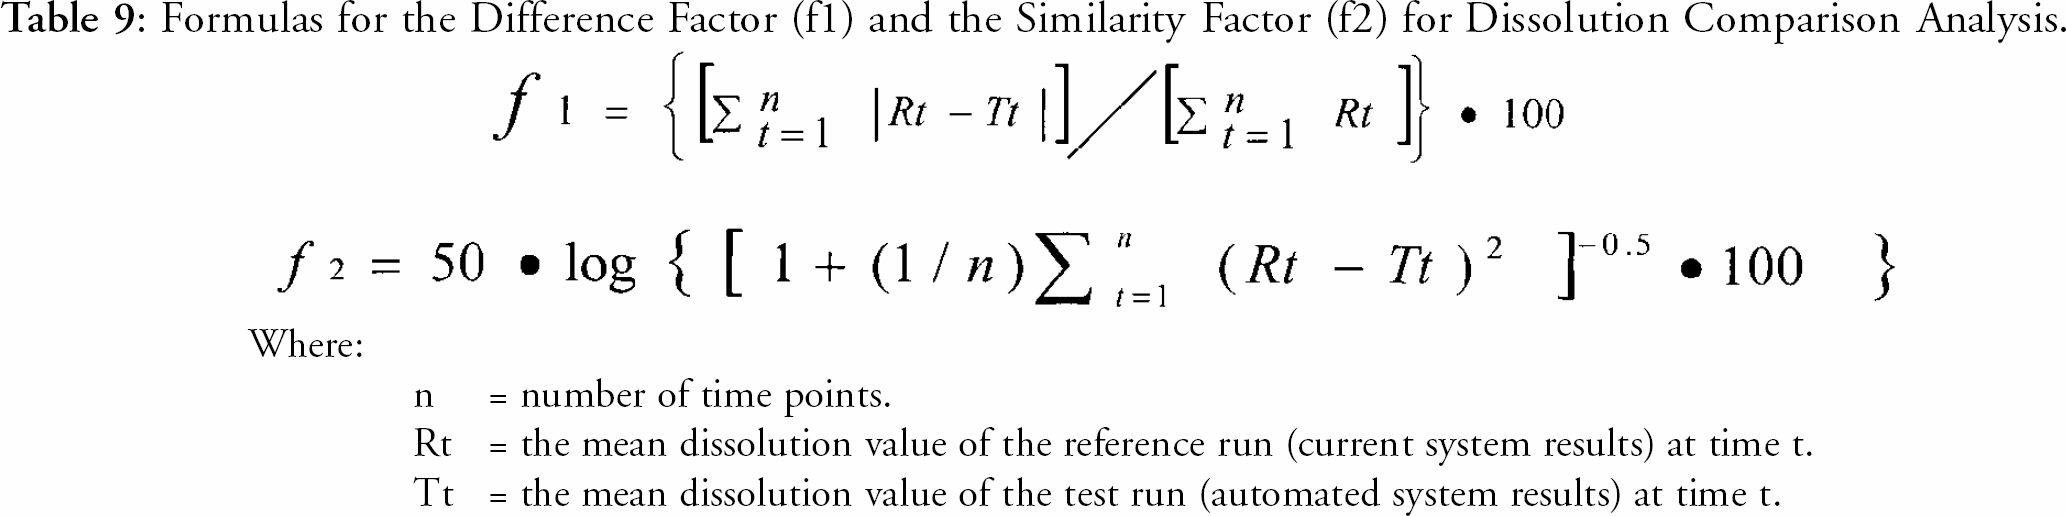
The results obtained using the Difference and Similarity Factors indicate that the two dissolution techniques (curves) are similar, thus the proposed automated method produces results that are similar to those obtained using the current method. The statistical results for the f1 and f2 factors are presented in
Statistical Test Results for the Difference Factor (f1) and the Similarity Factor (f2) 1
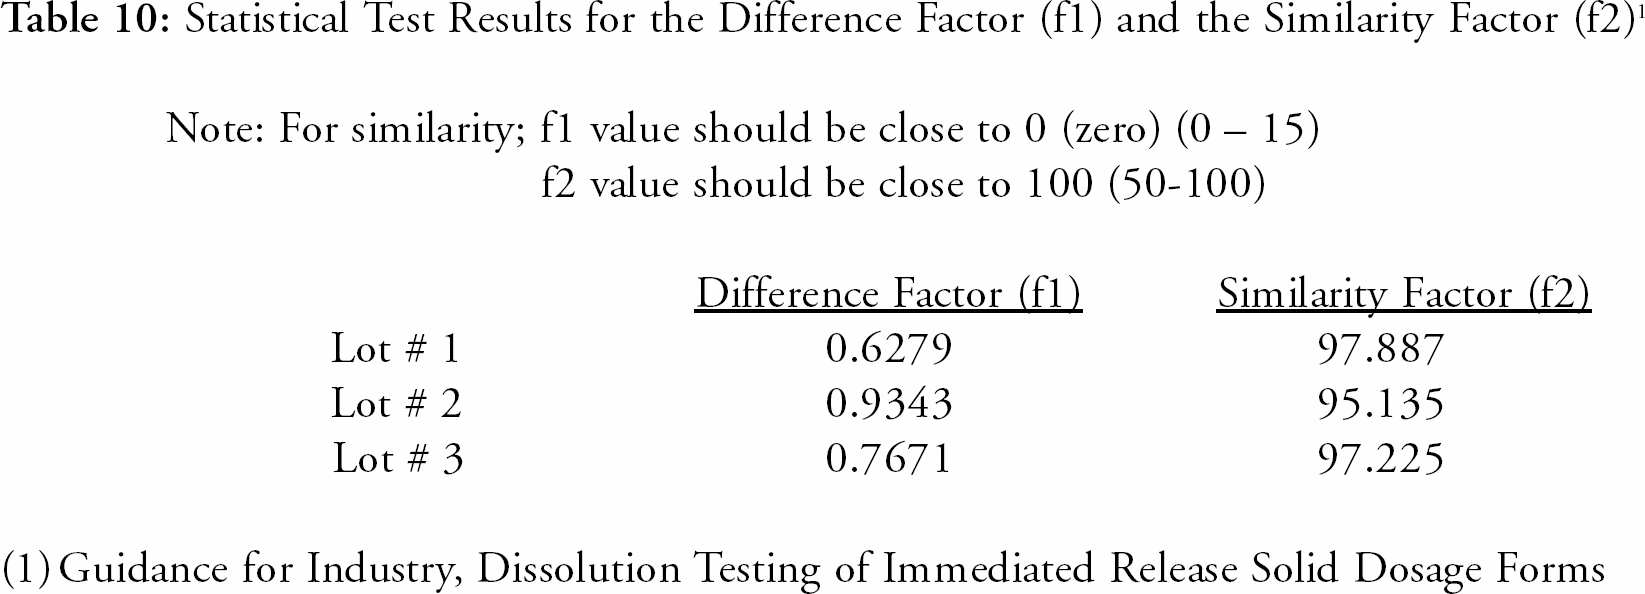
(1)Guidance for Industry, Dissolution Testing of Immediated Release Solid Dosage Forms
DISCUSSION
Transferring a current, validated manual dissolution method to an automated method can be fairly easy if a plan and protocol for qualification is developed. This can be accomplished through extensive knowledge of the product and with the current method of testing. Reviewing the active pharmaceutical ingredient and excipients, as well as the critical parameters of the current method, for possible issues or problems with the automated system, will minimize future frustrations. Constant evaluation and comparison of the system and test results are necessary, as numerous trial runs should be expected.
The manufacturer of our system suggested several good evaluation studies to transfer manual methodology to an automated one. Some we chose to employ others we did not. We did perform additional studies that would ensure product result integrity and equivalency. Several studies were also performed to demonstrate robustness of the proposed automated method. It must be stressed that invariably there will be several other issues that must be investigated due to the specific nature of your own products. The robustness of the automated method must be vigorously challenged using your specific formulated product.
SUMMARY
In summary, the qualification of a dissolution method for automated techniques is much easier when the method has been fully validated through manual techniques. The ability to show equivalence and to prove robustness of a system to a current method of testing, as opposed to the overall validation of a drug product using automation, is a much easier project to perform and complete.
CONCLUSION
The transfer of a current, validated manual dissolution method to an automated technique was successful for our particular product and formulation. The automated method was successfully developed to utilize the advantages of improved efficiency and minimal analyst involvement. The verification and qualification of the automated system for routine use for testing product was dependent on the product, the validation package of the current dissolution method, the analyst's knowledge (familiarity of the critical test parameters) of the current method, and the statistical evaluations of the equivalency results.
The statistical analysis of the data proved to be a critical factor in evaluating the equivalence of the two methods. The Difference (f1) and Similarity (f2) Factor comparisons of the results of the automated dissolution system method show no significant difference from the results of the current approved method.
ACKNOWLEDGEMENTS
1. Dr. Tarik Veysoglu, Manager of Analytical Development, Aventis Pharmaceuticals Inc., Kansas City site.
2. Dr. Ernest Parente, Director of Quality Control, Aventis Pharmaceuticals, Inc., Kansas City site.
3. Dr. Jeff Huth, Director of Quality Operations, Aventis Pharmaceuticals, Inc., Kansas City site.
4. Thomas Marchioni, Senior Chemist, Analytical Development, Aventis Pharmaceuticals, Inc., Kansas City site.
TRADEMARK
Zymark and MultiDose are registered trademarks of Zymark Corporation
MultiFill is a trademark of Zymark Corporation
Distek is a registered trademark of Distek Incorporated