
Abstract
There has been relatively little progress in the area of high throughput screening for antiparasitic animal health targets, which involve whole organisms such as Haemonchus contortus and Caenorhabditis elegans. Most assays involve identifying compounds that can paralyze and/or kill the organism. A major impediment has been the lack of instrumentation suitable for automating the read-out of these assays. We have developed an automated reader that makes analysis of antiparasitic animal health assays possible. This reader uses computer vision techniques to determine whether or not there is larval motion in each well. The system has been validated by measuring the dose-response relationships for several nematocidal agents and by examining 1040 wells of H. contortus, with a 94.6%/94% concordance rate with a human reader with less than a 0.3% false negative rate.
INTRODUCTION
High throughput screening (HTS), has gained widespread acceptance as an automation tool for biological assays in the pharmaceutical industry. A requirement for employing this methodology is a digitally readable endpoint. There has been substantial progress in fields such as ion-channels, receptor-ligand, and enzymatic assays where instrumentation can readily read colorimetric, fluorimetric or radioligand results. However, there has been less progress in fields such as parasitology, where the endpoint is often the lack of bioactivity, such as loss of motion, which is not currently determined by instrumentation.
Anthelmintic assays generally screen for compounds that interfere with larval development or that paralyze and/or kill the study organism. The two types of assays used are developmental assays, where eggs or staged larvae are seeded and larval development is scored some days later, or shorter term ‘kill’ assays where compounds are tested on larvae or adults, and kill is assessed shortly thereafter. Both types of assays, however, rely on the manual observation of lack of movement or development of the organism. In this paper, we describe the Wiggleometer, an automated methodology for a reproducible measurement of these endpoints, has been implementedreproducibly measuring these endpoints in a 96 well format, suitable for HTS, is described.
ORGANISM MOTION DETECTION
In these assays, motion represents survival, and lack of motion represents compound induced paralysis or death. Currently, these states are determined manually, by visually inspecting each well for movement. To automate reading, we replaced the human with a CCD camera, an X-Y table and a computer. We use computer vision techniques to determine whether there is motion in each well. The X-Y movement table is used to move the plate relative to the camera to inspect all wells. An image sequence is taken of each well. Successive image pairs are processed to measure motion.
There are many alternative methods for determining motion by using an image sequence. Two common methods are tracking and optical flow measurements. The first, tracking, 1 requires the identification of every object (larvae and debris) in each image. Objects are matched from image to image, and motion is computed. The difficult step in this method is the matching, since the shape of the larvae will change from image to image. In addition, there may be a large number of objects to track. The second method is optical flow. 3 This method 2 uses intensity correlation over the entire image to compute motion. Since our raw images have very high contrast, intensity based methods would not work robustly.
We use another technique, image subtraction,3,4 to measure motion, then compute the differences between successive images. This provides a measure of the total movement between successive images, rather than computing the individual motion of each object. Since we are only interested in measuring the total larval movement within each well, this method is acceptable for our purposes.
Even when subtracting two images that contain no animal-induced motion, however, there are differences in image to image reading the images due to machine noise. Intrinsic sources of noise include the shot noise distribution of the light, CCD read noise, digitization noise, and dark current noise 5 . Light source fluctuations and vibration between the object and camera are two system level noise sources that we try to address in our system design. We determined the system noise floor by subtracting successive image pairs without externally added scene (animal-derived) containing no motion. Using an 8-bit camera, the noise floor was determined to be 8 levels of gray-scale intensity. Therefore, after performing image subtraction, any difference greater than 8 levels of gray-scale intensity areas classified as movement.
Larvae motion has been detected using non-image based techniques. Micromotility meters 6 determine whether larvae are moving by optically measuring disturbances in the surface of the liquid containing the larvae.
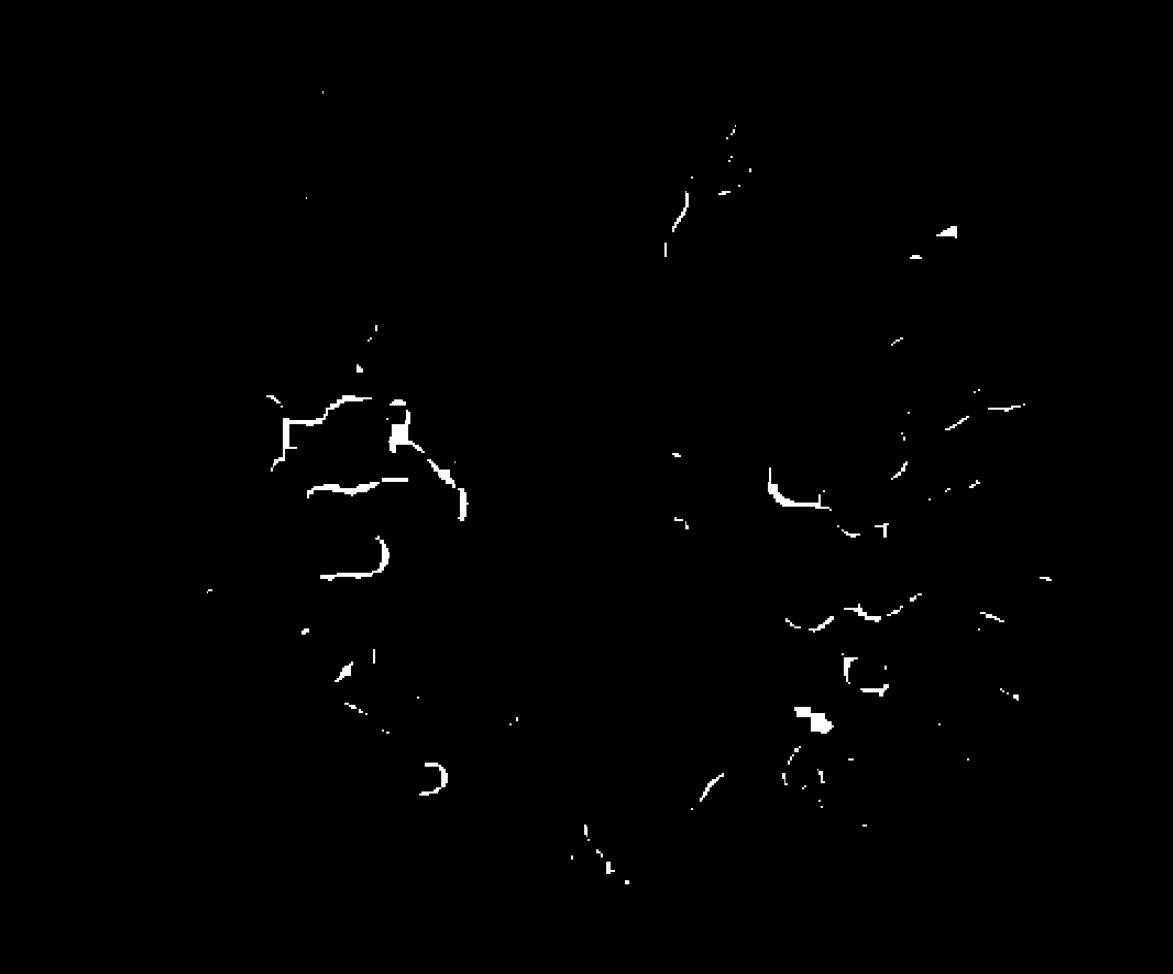
Figure 1 and Figure 2 shows successive images of one well of a 96 well plate, which contains H. contortus. Figure 3 shows Image 2 minus Image 1. The resultant image difference has been converted into a binary image, using a threshold of 8.
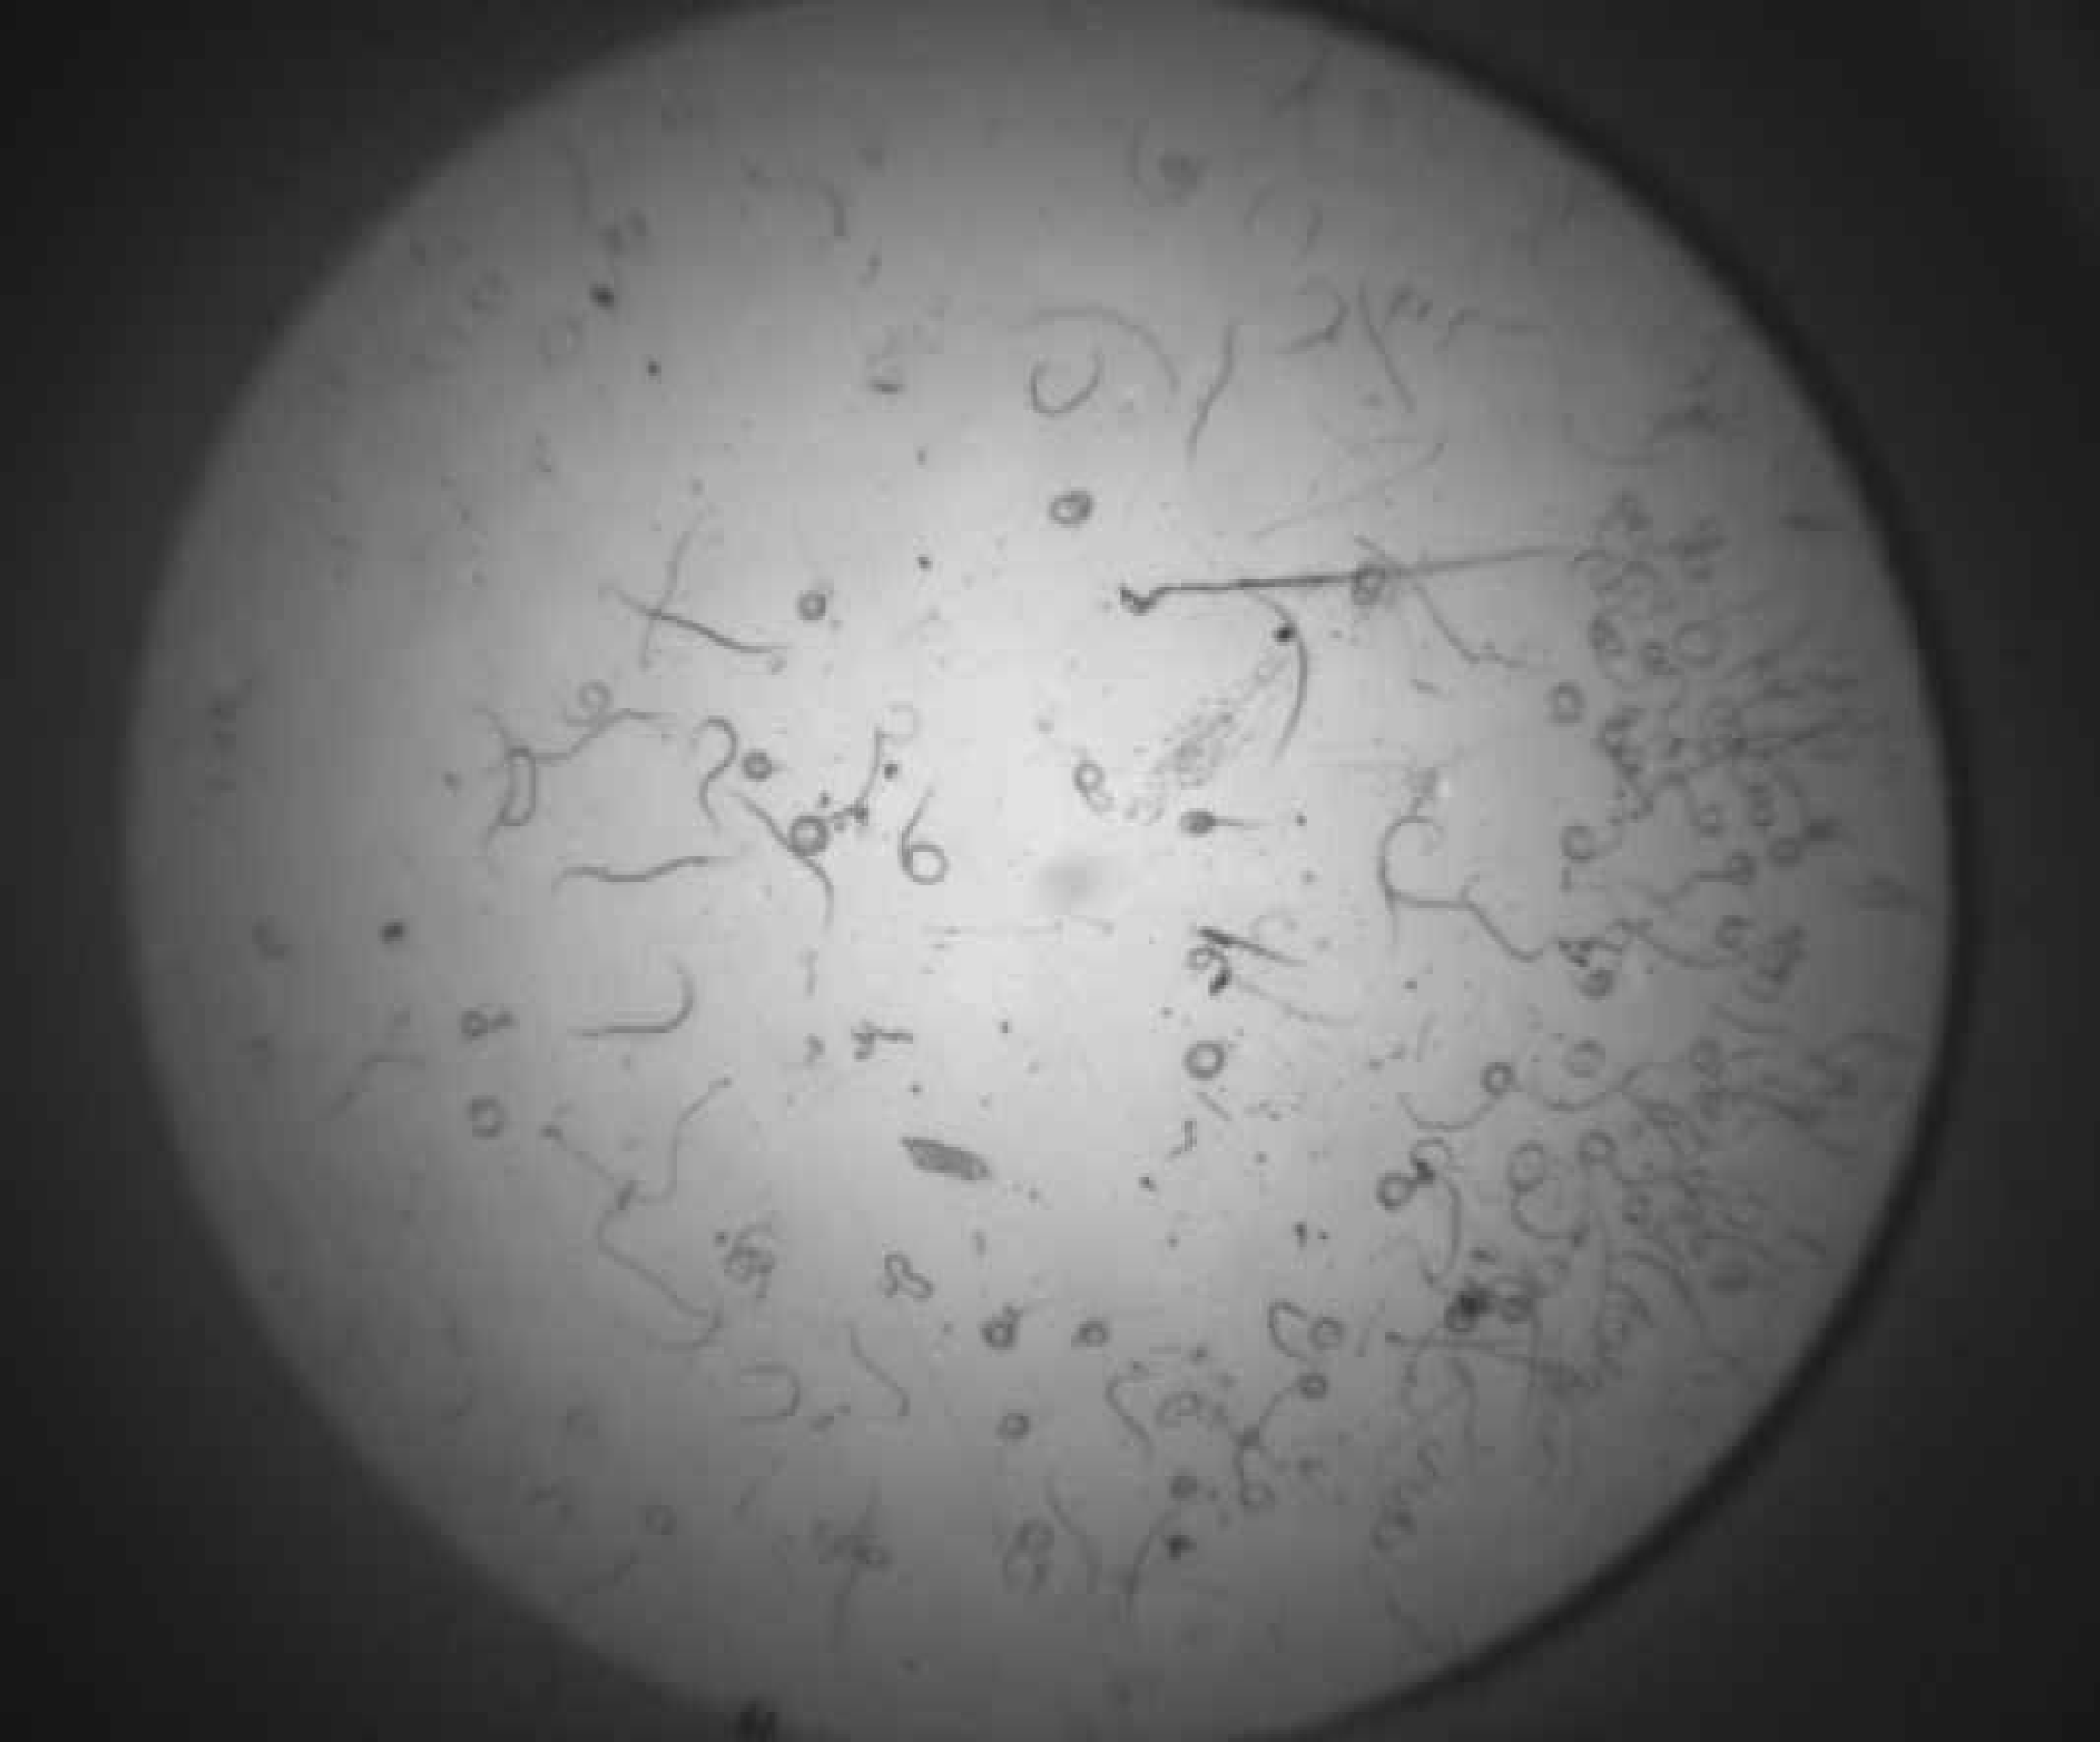
H. contortus, Image 1.
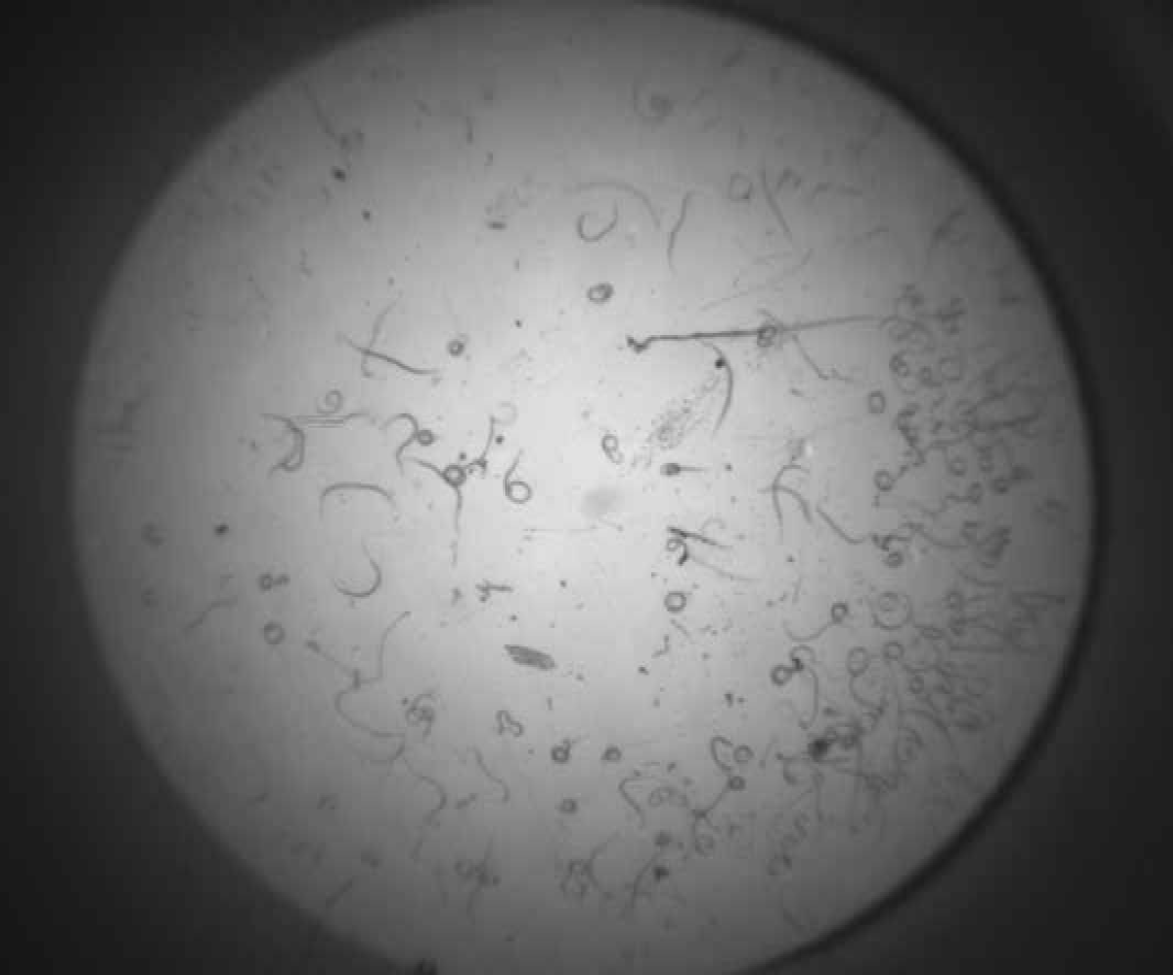
H. contortus, Image 2.
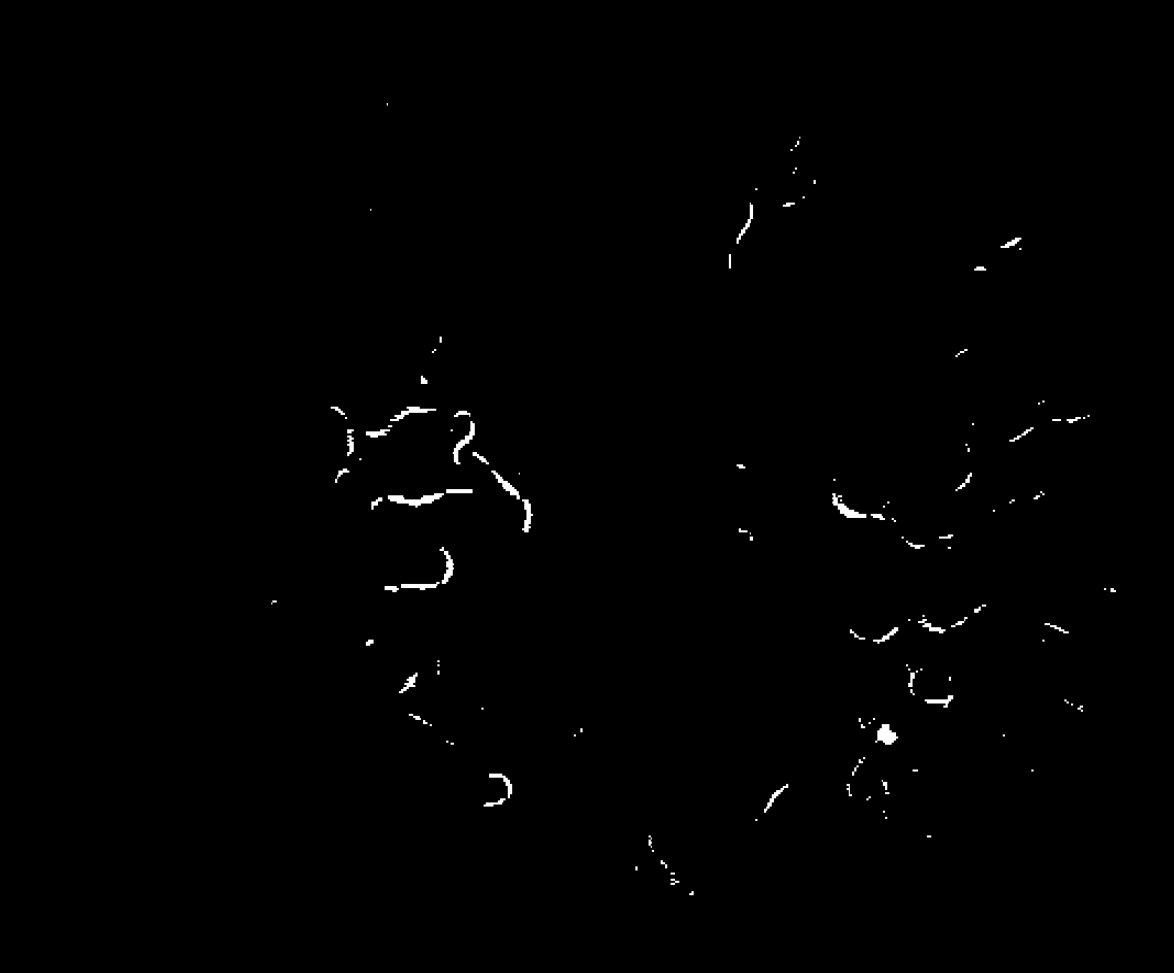
H. contortus, Image 3 = Image 2 — Image 1.
The total number of pixels in Image 3 that are in a “one state” (above the 8-bit threshold), gives a measure of the amount of motion (wiggle), that has occurred in the interval between Image 1 and Image 2. We call this metric “Total Counts.” The “Total Counts” metric is dependent on the amount of movement between frames, which is dependent on the state of the larvae as well as dependant upon the number of larvae that are present in a well. For certain species of larvae, it may be difficult to dispense the same number of larvae into each well. To correct for this, the “Total Counts” metric can be normalized by the number of larvae that move. Consequently, we determined therefore, we need to determine the number of larvae that moved.
Due to the way that larvae move, the center part of the larvae body may be static while the ends oscillate. This motion causes some of the resultant larvae in Image 3 to appear to be disjointed, which would lead to an erroneous larval count. As a result we attempted to “rejoin” these larvae by performing two morphological operations in tandem on the binary images.
The first operation, dilation, will turn a bit to a “one state,” if an adjacent bit is in a one state. The effect is to expand objects by the number of dilations. This operation may join disjointed larvae, but can have the side effect of connecting larvae that are in close proximity. The number of dilations performed determines the width of the gap that is closed. Based on empirical testing, we perform 3 dilations (Figure 4). This number may have to be modified for different organisms and assay systems.
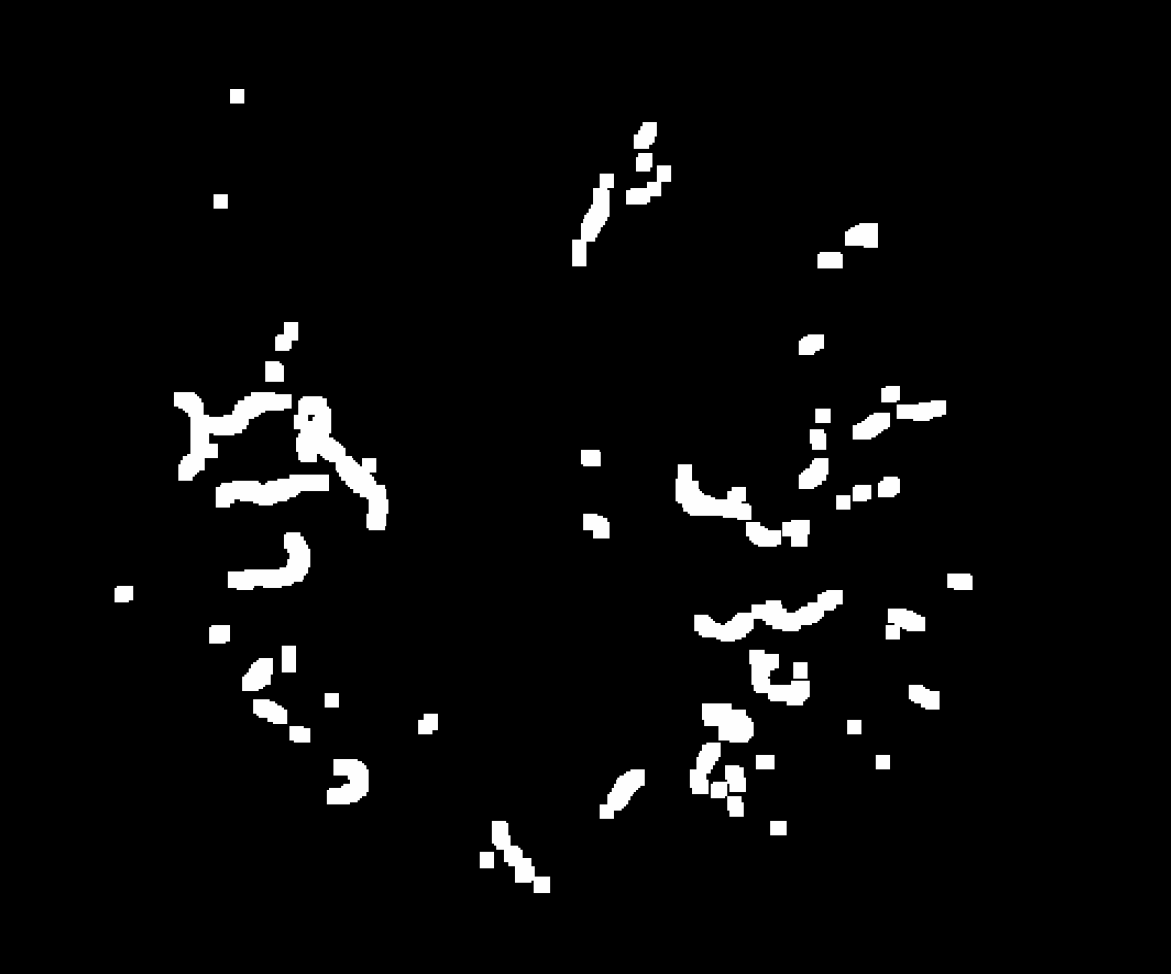
H. contortus, Image 2 — Image 1, dilated 3 times.
Dilation expands the moving larvae. If not corrected, it would produce an inflated movement metric. So, we subsequently perform a second morphological operation called erosion. Erosion will turn a bit to a “zero state,” if any adjacent bit is in a zero state. The effect is to shrink objects by the number of erosions. We perform 3 erosions. The sequence of 3 dilations followed by 3 erosions joins many broken disjointed larvae, and minimizes the number of larvae that are inappropriately joined due to proximity
H. contortus, Image 3, dilated 3 times. & eroded 3 times.
The total number of pixels in Image 5 that are in a “one state” gives a measure of the amount of motion that has occurred in the interval between Image 1 and Image 2. We divide this metric by the total number of larvae in the image, assessed through measuringby counting the number of regions on the field in the image that are in the one state. We call this metric “Total Counts/Total Larvae.”
IMPLEMENTATION
There are 6 basic components to the Wiggleometer:
Organisms in 96-well plates
An X/Y stage
The illumination system
The camera/lens system
The computer/frame grabber
The control software
C. elegans larvae were raised under standard laboratory conditions 7 and were plated into 96 well plates with adequate E. coli and growth medium to support robust growth during the drug treatment period. Likewise, H. contortus were harvested and plated into 96 well plates similar to. 8
In order to minimize development time, our approach was to use “off the shelf” components where possible. For example, the the X/Y stage is a Daedal 310062AT, 6” × 6”, transmitted light stage. It has a positioning accuracy of 30 μm over its full travel. Two Compumotor OEM750 Microstepping Drive/Indexers controlpositioning the stage position relative to the fixed-position camera. These drives are small, RS-232 controlled, stepper motor controls. The stage is mounted on a Newport 2′ × 3′, Scientific Grade, optical breadboard. The breadboard provides a flat, stiff, vibration resistant platform for mounting the X/Y stage. The breadboard sits on top of four, 2” diameter, 70 durometer, Sorbothane hemispheres. The hemispheres provide damping between the breadboard and the environment.
The illumination system is composed of a fiber optic light source, a fiber optic bundle, and a set of diffusing plates. The fiber optic light source is an Illumination Technologies 3900 Smart-Lite. This light source is DC regulated and has a closed loop light feedback system. The light output is stable to 0.1%. So, the light source noise is negligible compared with the other sources of noise. In addition, the light source has an RS-232 computer control interface. Due to the differences in biological activities of the treated or untreated larvae, the turbidity of the growth media can vary dramatically. Consequently, the optical density of each well will reflect this variation. We use the computer control interface to adjust the light source intensity for maximum contrast at each well. The light source connects to a Dolan-Jenner 0.125” diameter, 3′ long, fiber optic bundle. The bundle has a curved distal end that fits underneath the Daedal X/Y stage. The fiber optic bundle illuminates two, 3.375” × 5.0” × 0.063”, 26 μm, ground glass diffusers. The diffusers are 2.125” above the end of the fiber optic bundle. The diffusers are stacked on top of each other, creating a double diffuser. The plate sits on a 0.125” thick clear glass plate, which is 0.4” above the second diffuser.
The double diffuser produces a nearly uniform intensity across the area of the well (± 10%). However, once the plate is placed upon the diffuser and media is added to the well, the uniformity of the illumination degrades. This is caused by two factors. The walls of the well block light near the edges of the well, and the meniscus of the media acts as a concave lens. Due to these two effects, the light intensity near the edge of the well can fall off to about 25% of the light intensity at the center of the well (e.g.,
We use a Sony XC-77, 2/3”, monochrome CCD camera. The camera uses an Optem Zoom 70, 7:1 optical zoom lens system. The zoom has an internal focus, with a working distance of 79 −89 mm. In addition, the zoom lens has an iris diaphragm for adjusting depth of field. The camera is held above the Compumotor X/Y stage by Bosch 60 mm × 60 mm vertical aluminum extrusion bars, and a 60 mm × 90 mm horizontal aluminum extrusion bar.
The frame grabber, a Matrox Meteor II, resides in a PCI slot of a Compaq Deskpro EN minitower computer. The control software is written in Microsoft Visual Basic 5.0. We use the Matrox Imaging Library (MIL 6.0), OCX to perform image acquisition, image processing, image arithmetic, and analysis functions.
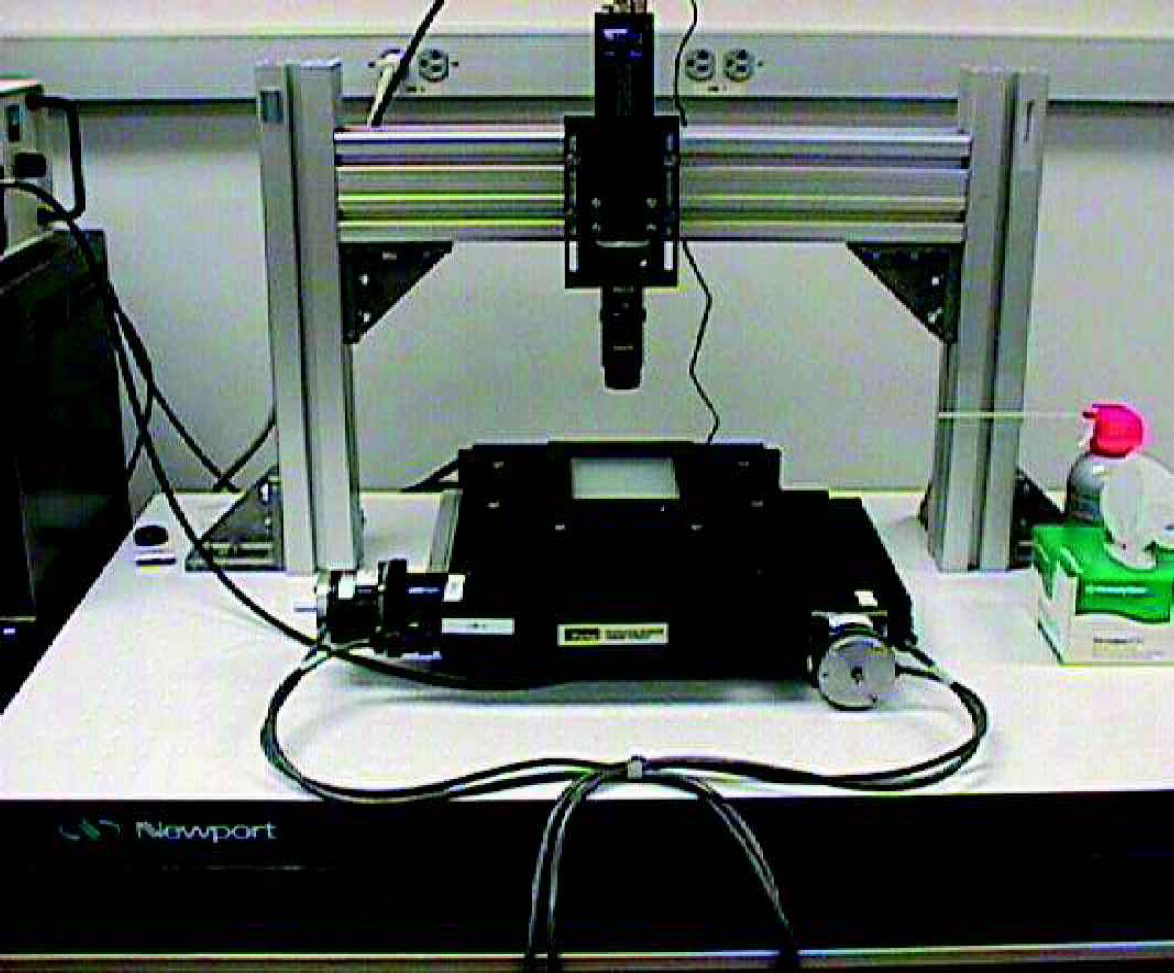
Wiggleometer Optical Platform.
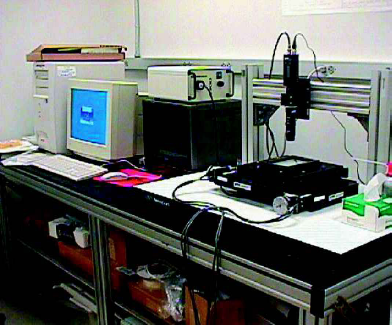
Wiggleometer System.
RESULTS
The wiggleometer takes 15 images, at approximately 1.5 Hz, of each well. The Wiggleometer takes and processes 15 images of each well in approximately 3 seconds, forming 14 image difference measurements. It can scan a 96 well plate in approximately 5 minutes. In order to validate the instrument, two paradigms were used: First, concentration effect curves were measured for a number of compounds on paralyzing that paralyze C. elegans and H. contortus. Secondly, 13 plates of H. contortus were scored by the Wiggleometer and by a biologist, and the results were compared.
In the first paradigm, H. contortus eggs or C. elegans, at various stages, were exposed to varying concentrations of agents known to be nematocidal, and movement was quantitated 20 hours later.
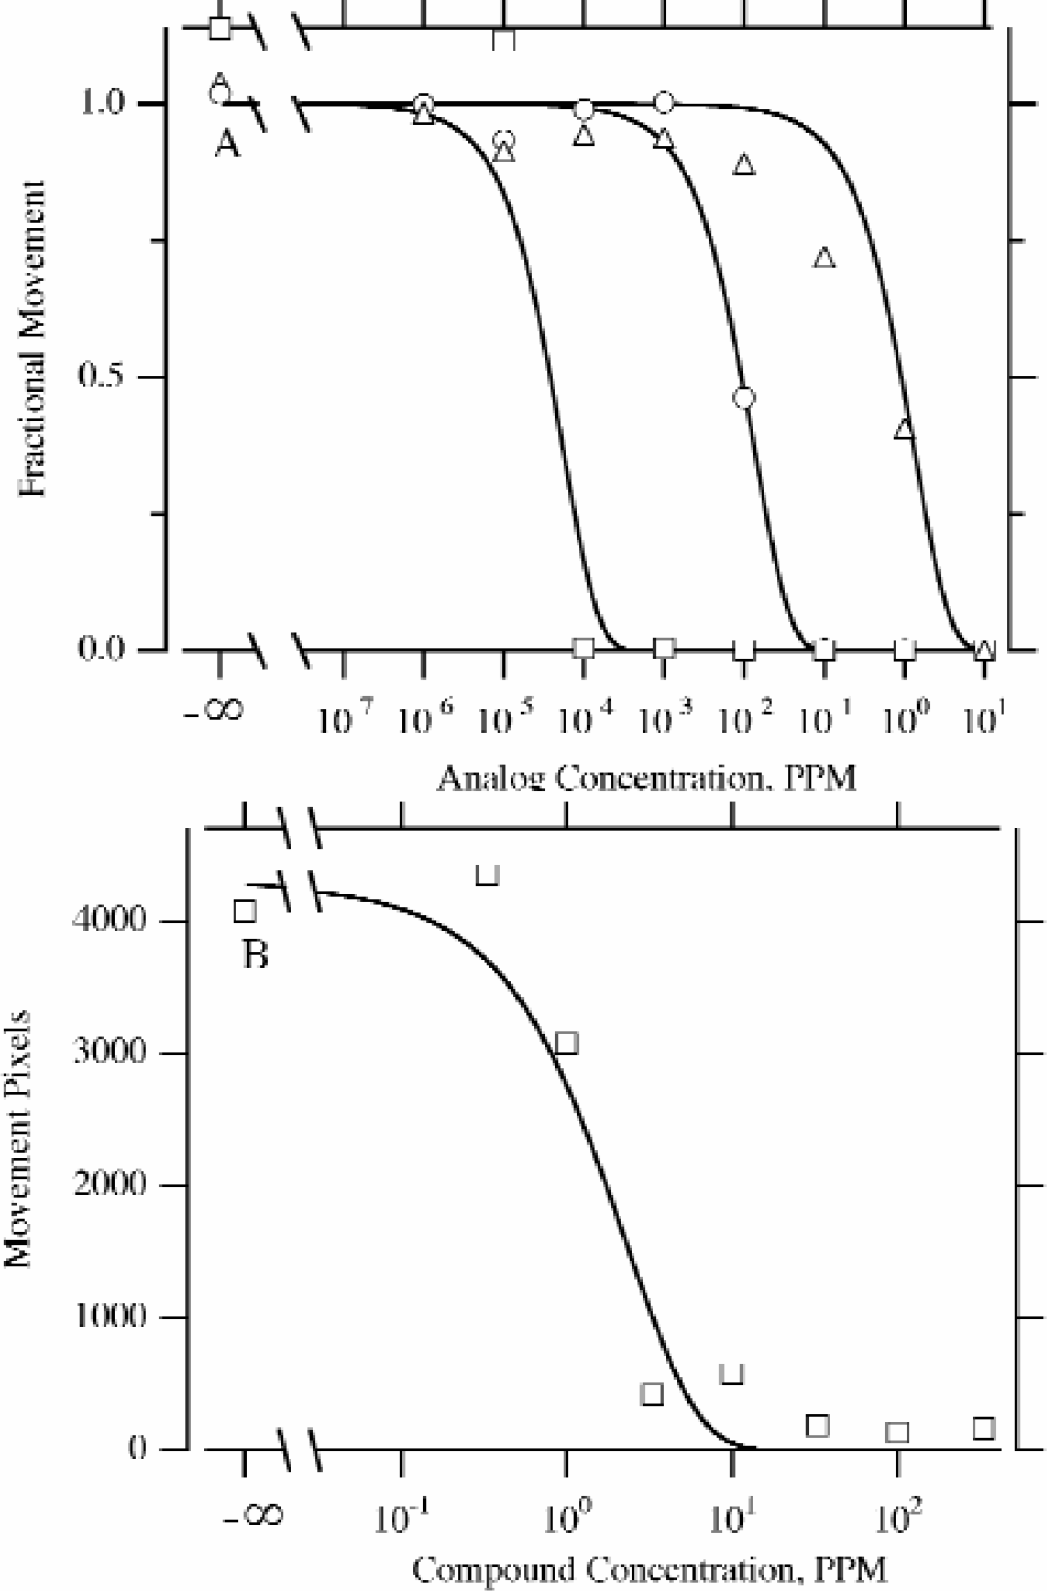
Various analogs of avermectin were tested against H. contortus (Figure 8A), and another nematocide was tested against C. elegans (Figure 8B); the wells were read by the wiggleometer and a human.8B). The Wiggleometer and a human read the wells. The human reader scored the wells for movement on a 3 step scale: inactive drug (fully active worms), to partial partially active drug, and then to fully active drug (no movement). When the biologist scored these wells for movement, he arrived at the same potencies of the different analogs as the Wiggleometer data (Figure 8).
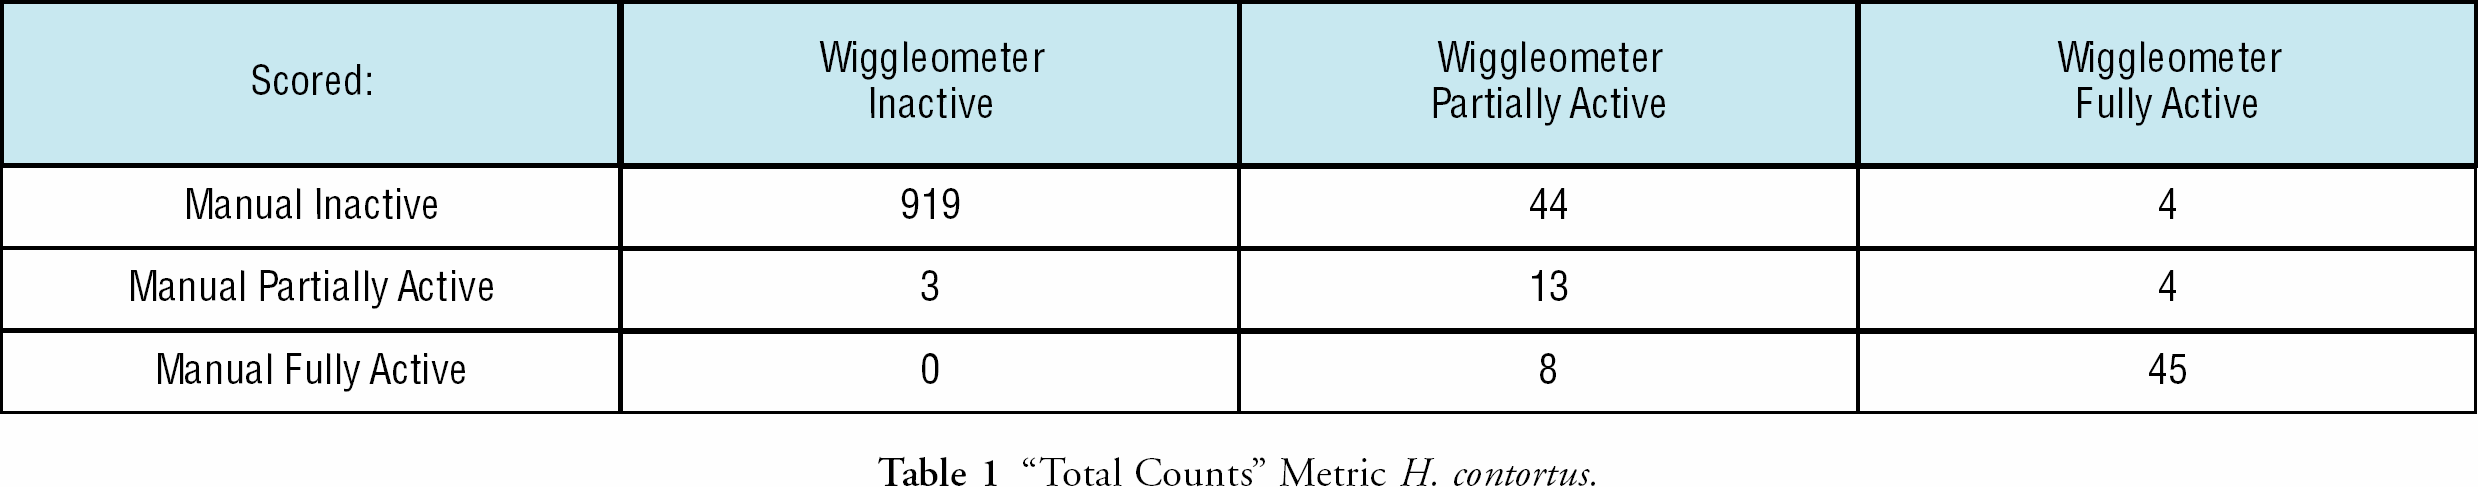
Using the second paradigm for validating the Wiggleometer, wells of 13 plates were seeded with H. contortus; 16 wells of each plate were used for controls. A total of 1040 wells were experimental, with random wells (ca. 4%), containing known nematocides. Again, the biologist scored the wells as “fully active compound,” “partially active compound,” or “inactive compound.” When the Wiggleometer read the plates, wells were scored either as “fully active compound” if no movement (<1% of control wells) was seen in the observation period, “partially active compound” if movement was less that 20% of the average active well readings on that plate (but >1%), or “inactive compound.”
For the “Total Counts” metric, Table 1, with the Wiggleometer relative to the human reader, we had a 94.6%/93.9% concordance rate (both human and machine categorized identically), a 0.3% “false negative” rate (where machine) the Wiggleometer categorized the well inactive, and the human categorized the drug as partially active or fully active), and a as less drug-affected than did the human), and a 3.9%/4.6% false positive rate (the Wiggleometer categorized the well partially active or fully active, and the human categorized the drug as inactive). For the “Total Counts/Total Larvae” metric, Table 2, with the Wiggleometer relative to the human reader, we had a 96.9%/96.8% concordance rate, a 1.9%/2.1% false negative rate and a 0.7%/0.5% false positive rate.
“Total Counts” Metric H. contortus.
“Total Counts/Total Larvae” Metric H. contortus.
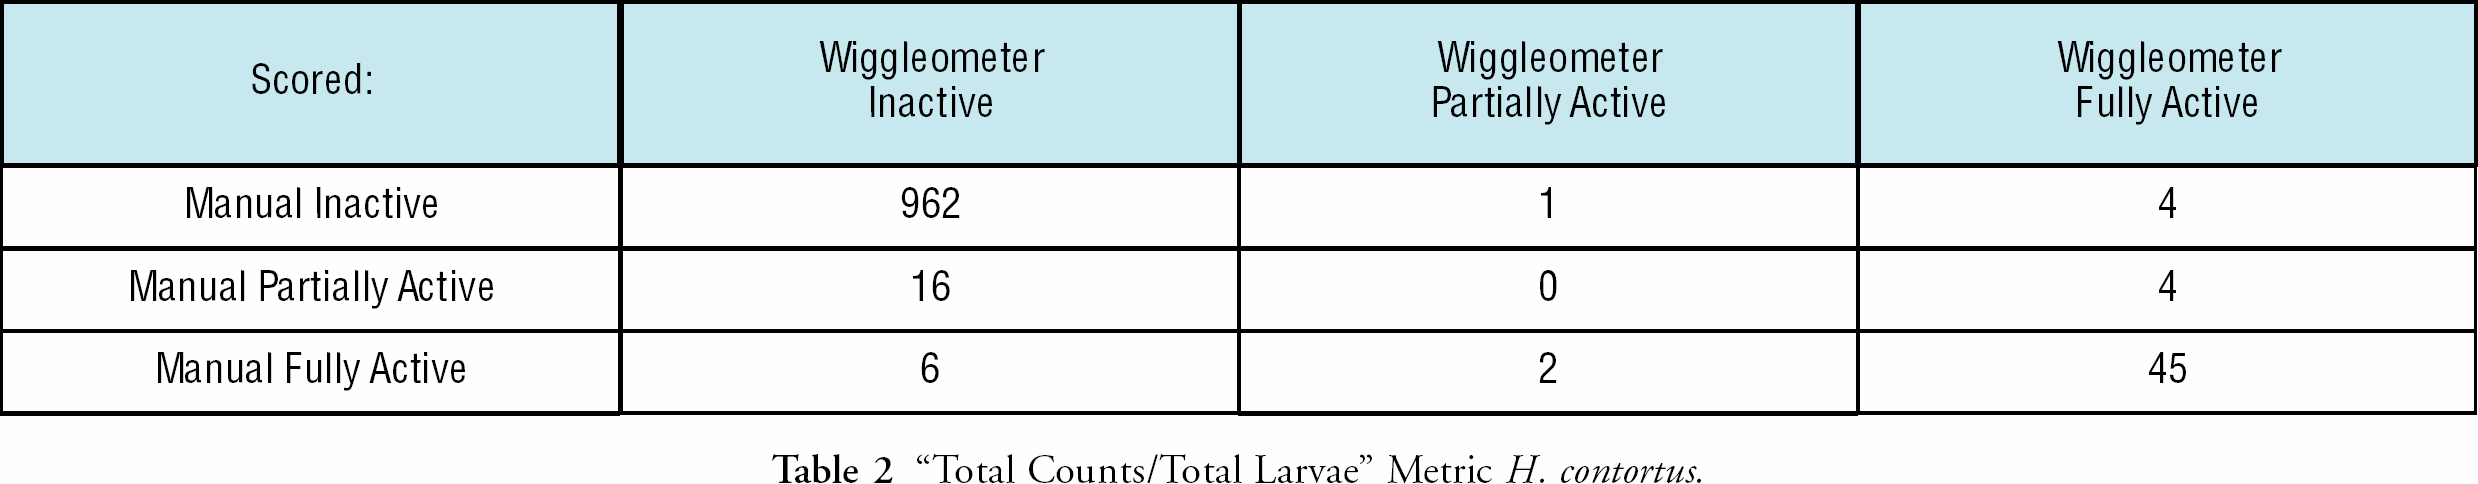
Using the false negative metric only, the “Total Counts” metric is more robust H. contortus. This is caused by two factors. Due to the size and number of H. contortus larvae in the well, our larvae counting can be erroneous. In addition, normalization decreases the signal level of the resulting metric. This makes it harder to discriminate between inactive and partially active wells. Considering both the false positive and the false negative rates, however, one might choose to use the “Total Counts/Total Larvae” metric. Normalization by the number of larvae will produce a more robust metric if measurements are made on larger organisms, with fewer organisms per well.
CONCLUSIONS
We have developed an instrument, the Wiggleometer, for automatically measuring organism movement in 96 well plates. The system uses computer vision techniques to detect motion between successive frames in an image sequence. The instrument has been validated by measuring 1040 wells of H. contortus, with a 94.6%/93.9% concordance rate with the human reader, and less than a 0.3% false negative rate. In the future, the instrument will be integrated with an HTS system. The imaging system uses an X-Y table and a low-level camera/frame grabber with a resolution across the well of 480 (maximum) pixels. With a more sophisticated camera/frame grabber combination one could achieve trivially < than a 1000 × 1500 field of view, and thus the entire plate could be imaged simultaneously with approximately 100 pixels/well diameter. For some organisms, mosquito larvae for one, this would be ample signal to noise for assaying drug action.
The techniques presented in this paper can be extended to measure various aspects of organisms and cells over time by changing the image processing algorithm. This computer vision algorithm consists of three modules: one controls plate movement, the second data acquisition and processing, and the third data storage. The current motion detection algorithm, which measures drug effects by detecting changes in frame-to-frame light changes in intensity, is a relatively unsophisticated measure of movement. It detects gross changes in position. The technique could easily be extended to other organisms such as mosquito larvae or Drosophila melanogaster larvae with the substitution of more refined measures of end-point determination. For example, with Drosophila melanogaster larvae, one should be able to identify wells containing compounds that inhibit larval molting by identifying wells containing larvae that have not increased in size, relative to control larvae. Using C. elegans, in which movement is fairly stereotypic, the programming algorithm could be modified to identify wells where subtle drug-induced movement alterations are seen.
The instrument could be modified to measure more than one well at a time. This would be appropriate if we were examining large organisms, having high contrast, such as mosquito larvae, or if we used a high resolution digital camera. For large fields of view, occlusion by the well edges would have to be taken into account.
Although the programming for the current system is for small, macroscopic animals, the methodology, with animals. With alterations into the hardware and software, the system could be extended to microscopic sizes, such as cells in tissue culture. This would entail changes to the current combination of hardware and software to insure that the same field was being studied day-to-day to eliminate frame-shifting effects. Thus, this specific application is easily extensible to multiple other uses within HTS systems.
ACKNOWLEDGMENTS
Drs Kenneth Bartizal, Dennis Schmatz, Wesley Shoop, James Springer, and Mr. Gary Kath provided management support for the project. Mr. Kevin Blake machined many of the mechanical components and helped assemble the Wiggleometer.