
Abstract
INTRODUCTION
HIGH THROUGHPUT PURIFICATION
Following synthesis, all compounds are subjected to LC/MS analysis using a Platform II (Micromass, Manchester, UK) — a process refered to as “crude QC.” The data returned is used to perform a triage; compounds passing our QC criteria are submitted directly to screening, impure compounds containing sufficient quantities of the desired material are fed into our high throughput purification process, whilst compounds with no potential for salvage are discarded. Not only does the crude QC data enable this triage, it plays an important role in the purification process described below.
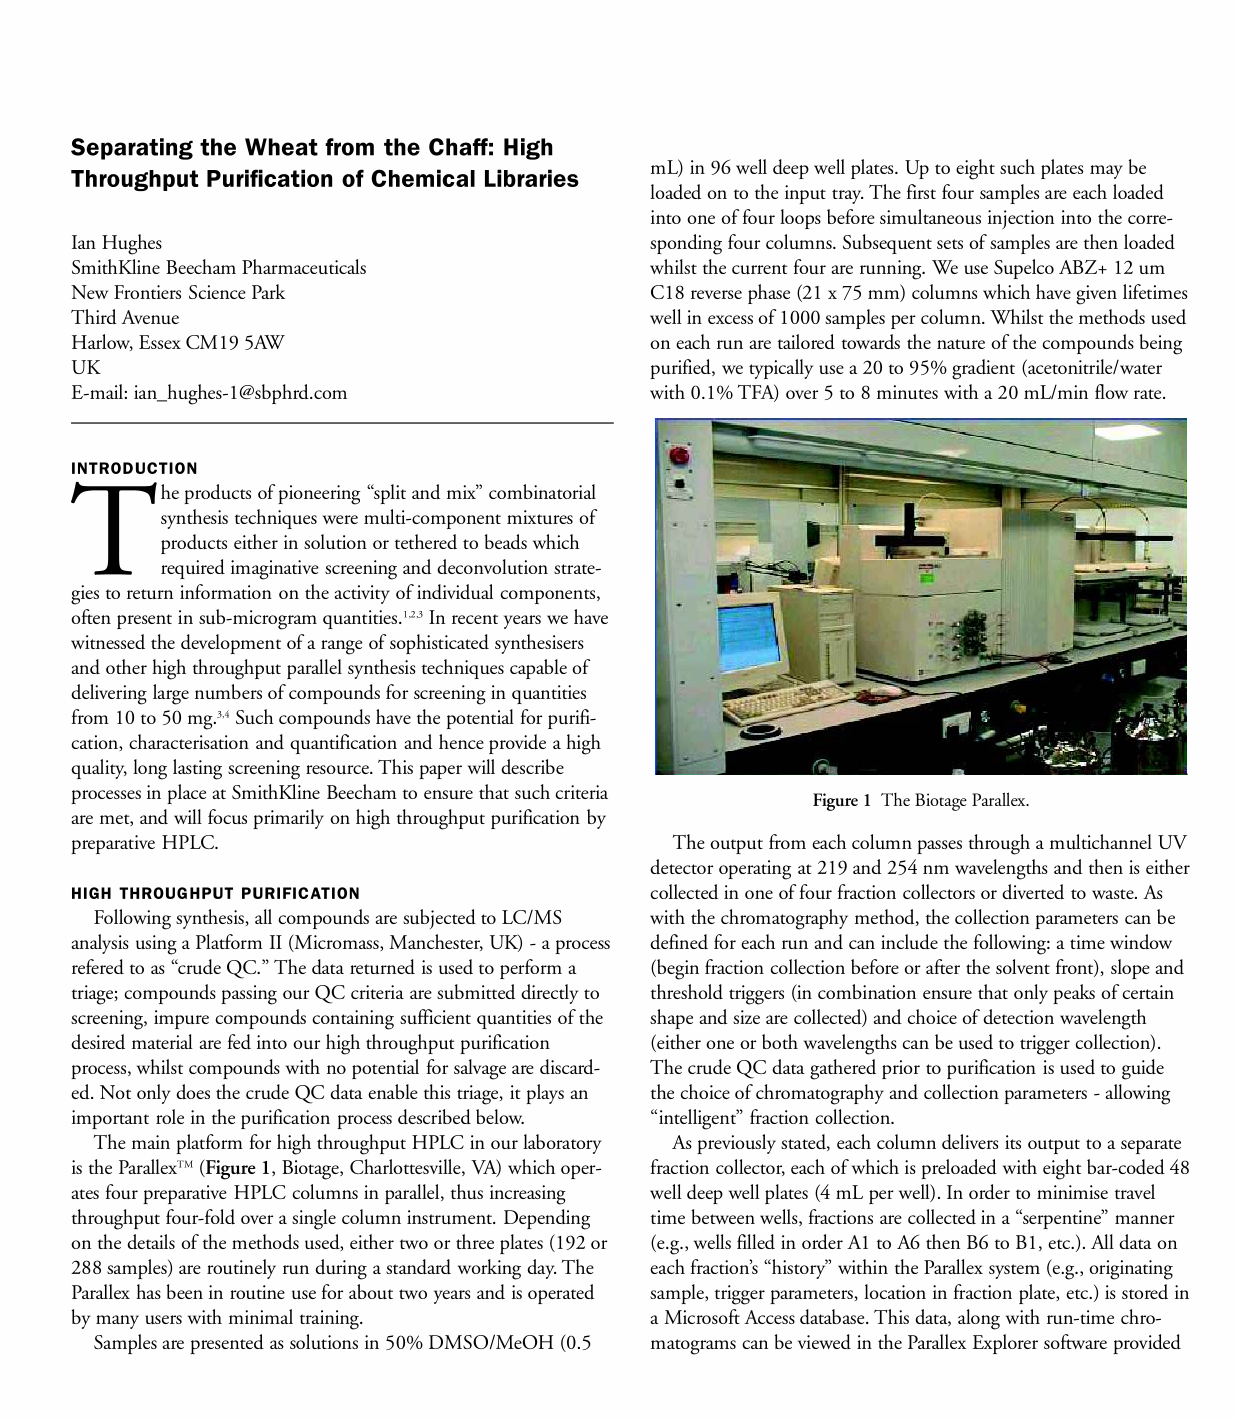
The main platform for high throughput HPLC in our laboratory is the Parallex™ (Figure 1, Biotage, Charlottesville, VA) which operates four preparative HPLC columns in parallel, thus increasing throughput four-fold over a single column instrument. Depending on the details of the methods used, either two or three plates (192 or 288 samples) are routinely run during a standard working day. The Parallex has been in routine use for about two years and is operated by many users with minimal training.
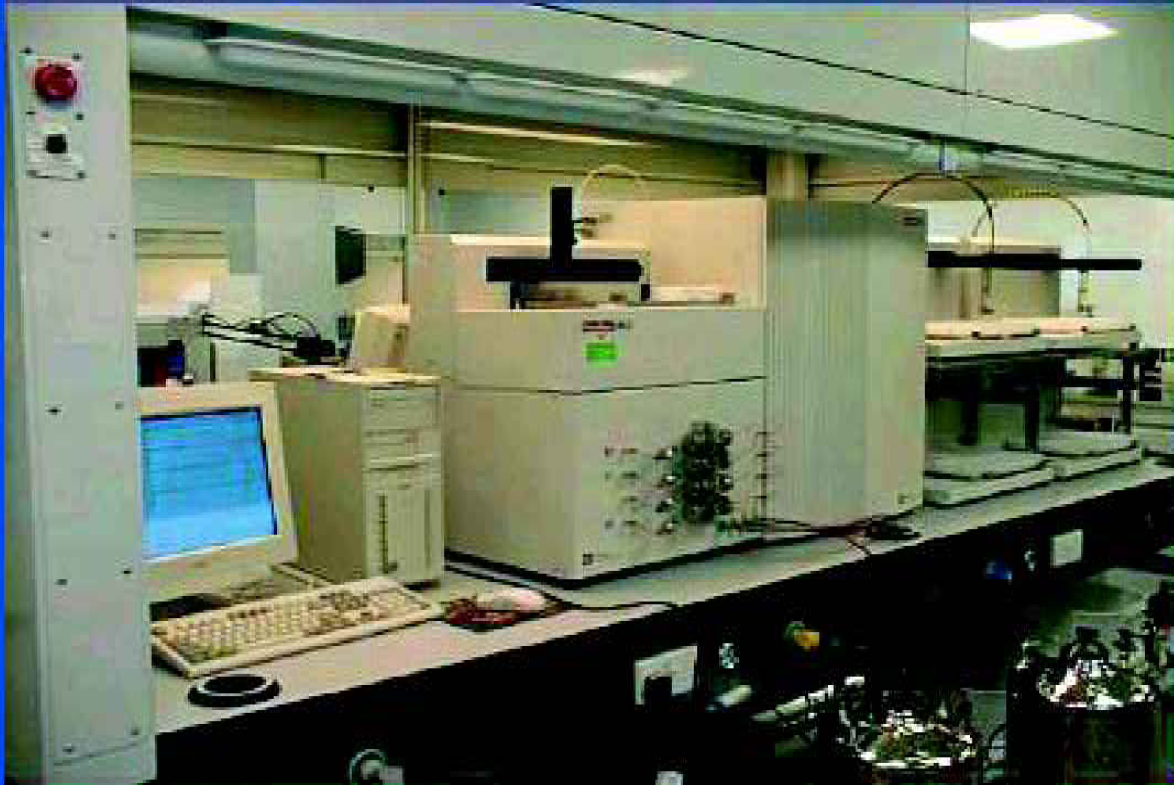
The Biotage Parallex.
Samples are presented as solutions in 50% DMSO/MeOH (0.5 mL) in 96 well deep well plates. Up to eight such plates may be loaded on to the input tray. The first four samples are each loaded into one of four loops before simultaneous injection into the corresponding four columns. Subsequent sets of samples are then loaded whilst the current four are running. We use Supelco ABZ+ 12 um C18 reverse phase (21 × 75 mm) columns which have given lifetimes well in excess of 1000 samples per column. Whilst the methods used on each run are tailored towards the nature of the compounds being purified, we typically use a 20 to 95% gradient (acetonitrile/water with 0.1% TFA) over 5 to 8 minutes with a 20 mL/min flow rate.
The output from each column passes through a multichannel UV detector operating at 219 and 254 nm wavelengths and then is either collected in one of four fraction collectors or diverted to waste. As with the chromatography method, the collection parameters can be defined for each run and can include the following: a time window (begin fraction collection before or after the solvent front), slope and threshold triggers (in combination ensure that only peaks of certain shape and size are collected) and choice of detection wavelength (either one or both wavelengths can be used to trigger collection). The crude QC data gathered prior to purification is used to guide the choice of chromatography and collection parameters — allowing “intelligent” fraction collection.
As previously stated, each column delivers its output to a separate fraction collector, each of which is preloaded with eight bar-coded 48 well deep well plates (4 mL per well). In order to minimise travel time between wells, fractions are collected in a “serpentine” manner (e.g., wells filled in order A1 to A6 then B6 to B1, etc.). All data on each fraction's “history” within the Parallex system (e.g., originating sample, trigger parameters, location in fraction plate, etc.) is stored in a Microsoft Access database. This data, along with run-time chromatograms can be viewed in the Parallex Explorer software provided with the instrument, which also provides the user-friendly interface for registering samples and plates into the system. A limitation at the time of delivery (subsequently addressed with Biotage's Pilot software) was the absence of a tool for onward processing of the fractions through characterisation and recombination steps. We therefore developed software to ease the visualisation and interrogation of the fraction data, and to provide appropriate data files to the instruments used in the physical processing of the fractions.
MANAGING THE FRACTIONS
Our software package is named “Winnow” by analogy to the agricultural process of winnowing — separating the wheat from the chaff. Winnow is a Microsoft Excel based application written in VBA with additional VB functionality to perform the file handling. The use of Winnow in fraction management will be illustrated with data from the purification of a 4320 component array synthesised in eleven steps using the AccuTag™ (Irori, San Diego, CA) technology. Although a total of 45 plates of 96 samples each were purified, this discussion will focus on just one plate, and initially on a single sample from that plate as it passes through the stages of our process
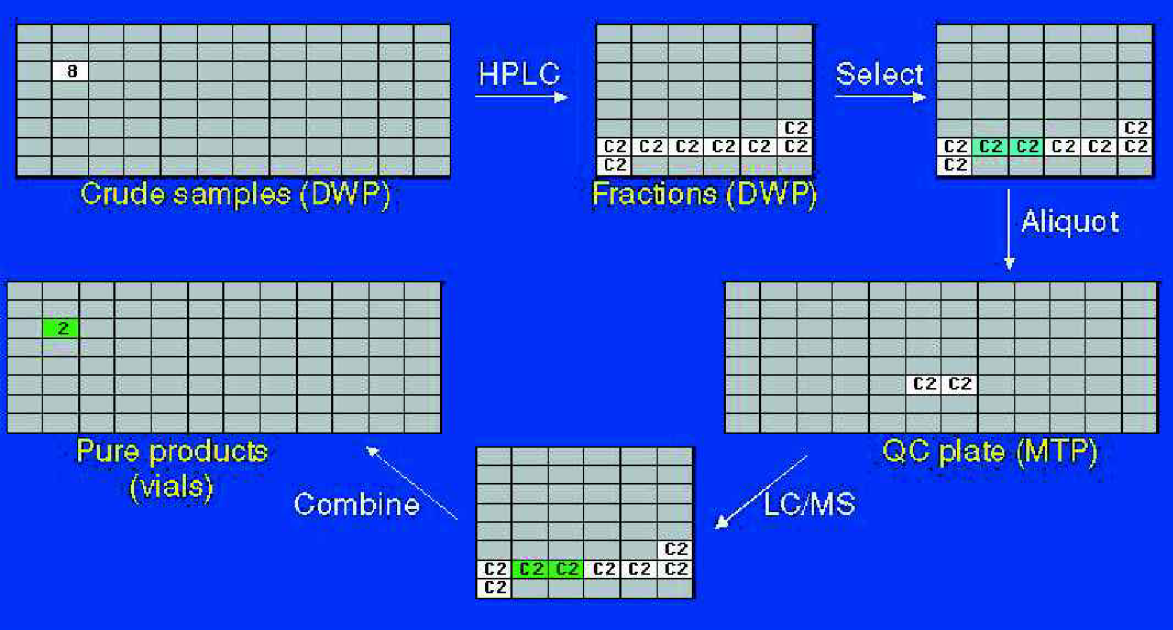
Path of sample C2 through the purification process. From eight fractions collected, two were correctly identified as containing the desired material.
In this example, HPLC of sample C2 gave rise to eight fractions. By the “Winnowing” process to be described shortly, two fractions were selected as most likely to contain the desired product. Small aliquots were transferred from these two fractions onto a QC plate, which was then presented for LC/MS analysis. The results returned to Winnow indicated that these two fractions did indeed contain the expected product and both passed our purity criteria. The fractions were therefore recombined into a tared 4 mL vial and evaporated to give a high quality sample for screening.
The other 95 samples in this plate were treated similarly — a total of 515 fractions were collected, the data for which were exported from Parallex Explorer in a 515 row by 76 column spreadsheet. From this data Winnow generates several different graphical views of the data, the most important being the “Picker” sheet
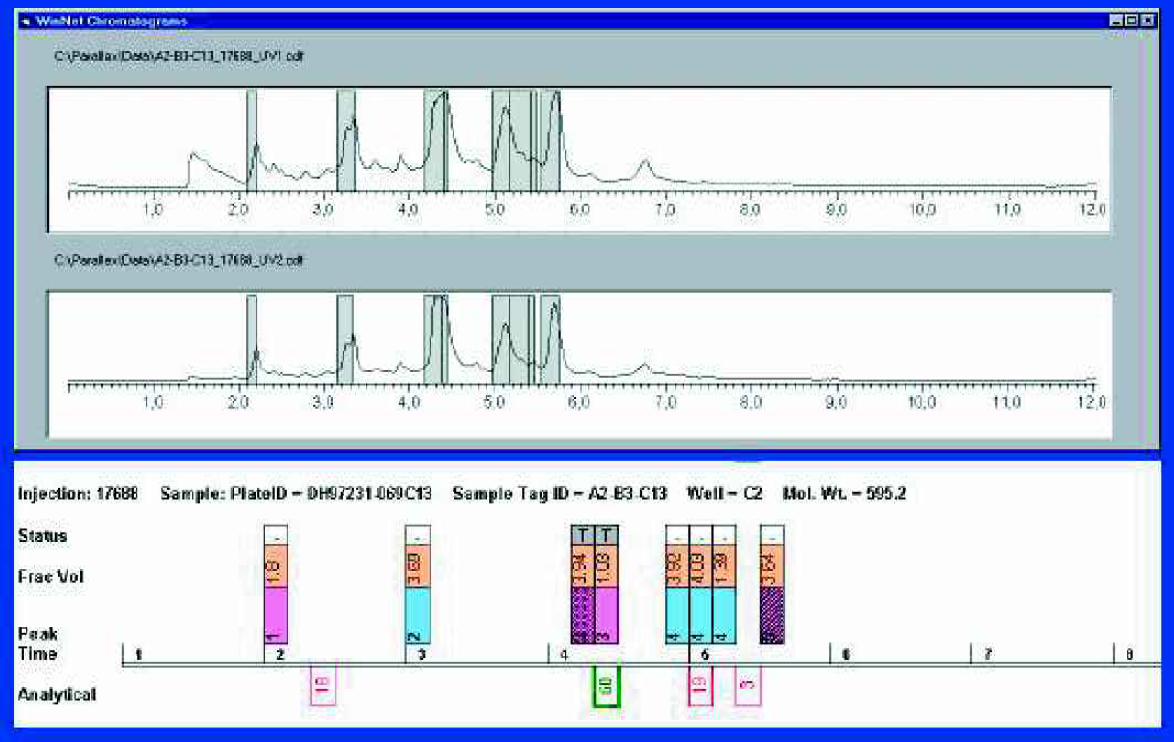
The Winnow “Picker” sheet showing fractions selected for transfer to QC.
INTELLIGENT FRACTION SELECTION
As its name suggests, the interactive “Picker” sheet is where fractions are selected to pass through various stages of the “Winnowing” process, and presents the user with an interactive view of the fraction data. At the top of the screen is a window containing the run-time chromatograms for sample C2 at two wavelengths — these are standard ANDI format files produced by Parallex Explorer. The bottom part of the screen shows the same data in a block diagram form. Each fraction collected is depicted along a time axis as a vertical rectangle with three distinct zones. The bottom zone contains the peak number (so Peak 3 is contained in two fractions). The middle zone can display any of a number of relevant data items, for example the volume of the fraction, the peak height, the fraction well number, or, after QC the purity of the fraction. The top zone contains the status of the fraction. Below the time axis are a number of red or green boxes containing the area percentage taken from the crude QC data. A green box indicates that this analytical peak contained the mass of the desired product. Because the analytical LC/MS used a 2 min gradient and the preparative run gradient was over 8 min, a scaling factor has been applied to bring the two time axes into alignment. This analytical data strongly suggests that Peak 3 contains the desired product.
A tool, called “Filter by UV,” applies user-defined selection criteria based on the maximum UV intensities of each fraction during the preparative run (at either or both wavelengths). It essentially aims to select the fractions containing the most material — in most cases we expect that the desired product will be the major product. Applying UV filters highlights the lower zones of the selected fractions and automatically sets the status of the fraction to “T”, i.e., Transfer to QC plate. All other fractions from this peak can be simultaneously marked for transfer (as in Peak 3). In Figure 3, Peak 5 has also been highlighted since it was a major peak. However, because its retention time differed significantly from the prediction based on crude QC data, it has been deselected and will not be transferred to the QC plate. The selection processes described are automatically applied to all samples, and in many cases no further action is required. However, the Picker sheet gives the user the ability to review the selections made along with the data presented and manually select or deselect any of the fractions.
THE END GAME
On completion of this intelligent fraction selection process, Winnow creates two files. The first is sent to the liquid handler (MicroLab-s, Hamilton, Carnforth, UK fitted with Plate Silos, Hudson Control Group, Springfield, NJ) that will prepare QC plates from the selected fractions. The second file containing the theoretical masses expected from each well of the QC plate is sent to the analytical LC/MS system (Finnigan aQa, ThermoQuest, Manchester, UK) for QC. The reason for creating a QC plate rather than sampling directly from the fraction plates is driven by the limited capacity of ten plates on the QC liquid handler bed. This could either hold ten 48 well fraction plates, each with perhaps 12 fractions selected for QC (a total of 120 analytical samples), or ten 96 well microtitre plates containing a total of 960 analytical samples. Clearly, for long term unattended running (overnight, weekends) the latter scenario is preferable. Additionally, QC plates are much more readily transferred to alternative LC/MS machines during periods of downtime.
Results from QC are returned to Winnow and are displayed in the status zone of the Picker sheet (as a simple P (pass — correct mass, high purity) or F (fail)). Figure 4 shows that in the case of sample C2 the Winnowing process correctly identified the desired product. In most cases this whole process works well with minimal user intervention, however, tools are available that allow the user to browse the QC chromatograms and update the P/F status accordingly (perhaps adduct formation returns “false” failures). Even in rare instances where the initial selections for transfer to QC turn out to be incorrect, no fractions have been discarded, so the cycle can be repeated.
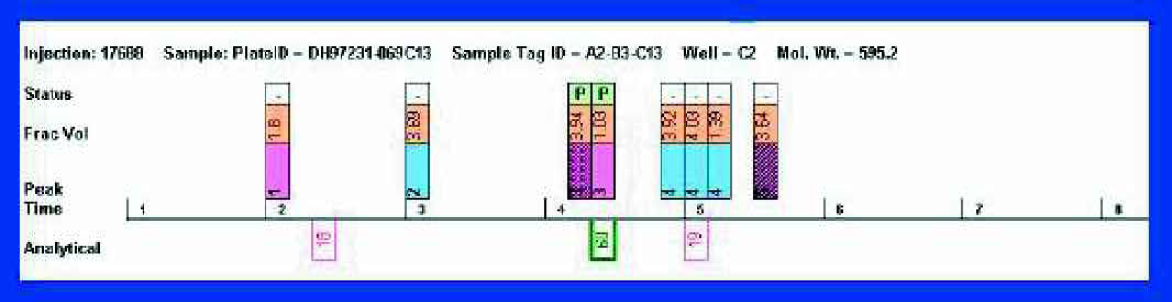
The “Picker” sheet with QC results displayed.
When the user is satisfied with the QC decisions, files are again sent to the liquid handler, this time to direct the transfer of fractions to tared vials which are subsequently evaporated (GeneVac, Ipswich, UK). The Winnowing process is now complete and the purified samples are transferred to the final weighing, labelling and registration stages prior to submission for screening.
CONCLUSION
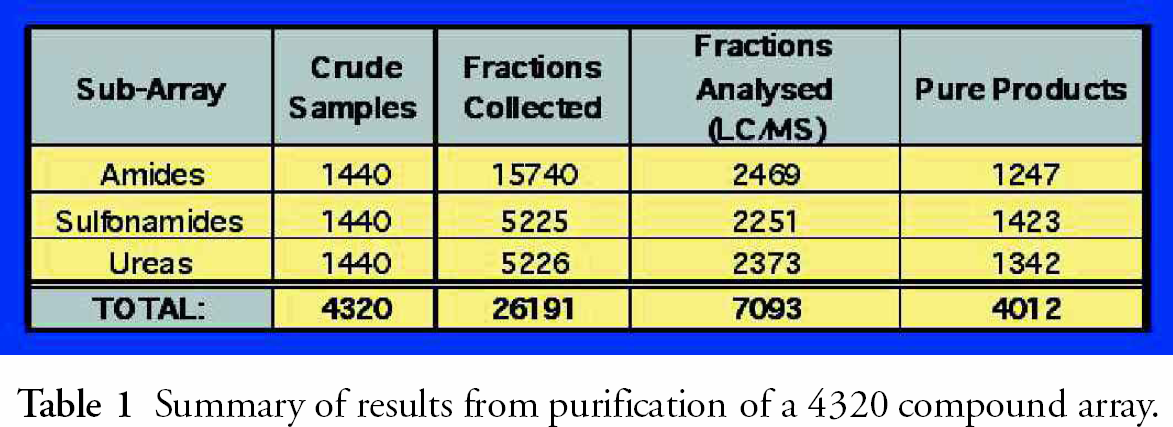
Summary of results from purification of a 4320 compound array.
Whilst we continue to seek improvements to the purification process described, its success can be judged by the fact that users now purify plates of 96 samples as routinely as they recently handled single compounds. Key to this success has been the seamless integration of a user-friendly software interface with a number of automated platforms (preparative HPLC, liquid handling, analytical LC/MS) as well as effective teamwork between experts from a range of disciplines.
ACKNOWLEDGMENTS
The efforts of David Hunter and Bill MacLachlan, as well as Christine Edwards and Kelvin Hammond from Biotage, in setting up the Parallex system and David Pardoe's key contribution to integrating and networking the various instruments, are all very gratefully appreciated. I also thank Andy Organ and Dan Brooke for analytical support, and Jayshree Mistry and Doug Prain for performing the chemistry and purifications described.
Footnotes
Acknowledgements
If you are interested in seeing more articles like this in JALA, please email