
Abstract
Unless economic recovery occurs, there is a high possibility that a currency war will be instigated. The euro is considered to be a fundamental contributor to the export success of sixteen Member States. Change in currency value is only one of the two factors affecting the price of exports; the other factor, and arguably the one that affects export prices in a more overarching manner, is the cost of production. However, to maintain a competitive advantage against the growing competition of Asian countries, Europe must find a way to facilitate innovation and thus produce high-tech products for the export market.
Introduction
The European Union (EU) is the biggest trading partner in the world. Trade is the driver of international competition and improved allocation of resources and of macroeconomic development. Moving from a theoretical perspective to real life means that there is a greater choice for European consumers and a lower price for most traded products.
Trade, especially exports, is a sign of the competitiveness of European enterprises. EU exports and imports account for 17.1 and 17.6%, respectively, of the world total. However, exports are declining due to the increasing role of new players, especially in Asia, that have affected the market share of several developed economies, including some of the largest Euro area (EA) countries. But the losses of the EU as a whole are smaller than the decline in export market shares experienced by some of its major competitors, namely the United States and Japan (see Fig. 1). The EU's trade performance for manufactured products is still solid, thanks to chemicals, pharmaceuticals, motor vehicles and non-electrical machinery in particular.
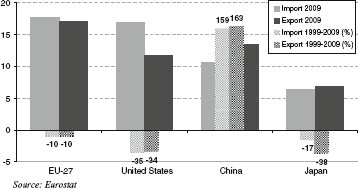
National imports and exports as a percentage of world total and percentage change, 1999–2009. Data for China exclude Hong Kong; 2009 data for Japan refer to 2008.
The 16 EU members that have adopted a single currency share a destiny linked to the value of the euro. A comparison with the US dollar (USD), the currency of the global economy, shows that the euro floated in the international currency market. Starting at 1.1789 USD on its very first day (4 January 1999), the euro reached its minimum value to date (0.8252 USD) in October 2000 and its maximum (1.599 USD) in July 2008.
In the third trimester of 2010, the euro gained almost 15% against the USD and caused concerns over the EA exports and its competitiveness. But when the single currency lost more than 20 percent of its value from December 2009 to June 2010, it was perceived as a great chance for the sixteen economies.
Not long ago, every EA country could apply a competitive devaluation, that is, a reduction of the value of a currency which, by making one's country's exports more competitive, increases production and reduces unemployment 1 . Such a policy reveals a very short-term perspective if the benefits obtained by export growth do not turn into structural, thus long-lasting, improvements (reforms and investments) in the domestic economy's competitiveness.
If one country gains competitiveness through devaluation, another country loses competitiveness through an (involuntary) appreciation. The devaluing country is shipping its unemployment abroad. Since other countries do not like this, they devalue their currency in turn. This leads to cycles of competitive devaluation, and partially justifies the creation of the Economic and Monetary Union.
Even though economic policies should be enacted according to a vision, the short term is especially important in hard times such as now. Germany seems to have found its own way out: austerity at home, selling abroad. But if the majority shareholder of the Economic and Monetary Union has already decided to adopt the Chinese way (with a Soziale Marktwirtschaft flavour, of course), it is difficult to believe that the other 15 Member States of the EA are ready to follow. Face value is just one side of the coin, and behind that shared coin, the 16 partners show some relevant dissimilarities which require country-based policies.
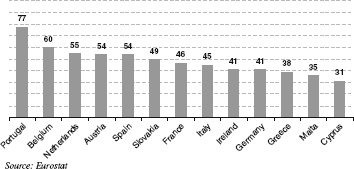
Share of exported goods and services to EA Member States as a percentage of total exports, 2005–2009 average (no data available for Finland, Luxembourg and Slovenia).
The value of the euro affects only half of EA-16 exports
The miraculous effect of a devalued euro is weakened by the fact that half of the exports of EA countries are to the other members. Among the 16 countries, Portugal exports as much as 77.1% to the other 15 Members States, while Cyprus exports a mere 31% (see Fig. 2).
What about the buyers of the remaining exports? Bright signals are coming from the United States and Asia, where recovery seems to be faster than in the EU. But the growth is still a jobless one (thus the increase in GDP is not immediately increasing the purchasing power of the median consumer), and Americans are now discovering the beauty of being savers while the Chinese people are asking for strengthened—in other words, more expensive—welfare.
Moreover, if exports rise when the euro is cheaper, imports become more expensive; very expensive indeed when demand elasticity is low, when there are not many alternatives to satisfy a need. This is the case with raw materials and energy. The risk of imported inflation is currently counterbalanced by domestic prices, 2 which are projected to rise in 2010 only by 1.4% in the EA. But in the medium-long term the amount of public funds used to shore up collapsing economies will increase the nominal value of marketed products.
The ECB uses the Harmonised Index of Consumer Prices (HICP) as an indicator of inflation and price stability. It is a weighted average of price indices of EA countries compiled according to a methodology that has been harmonised across countries.
The price tag of EA exports
The price of what the EA countries sell abroad has two main components: the first is linked to the exchange rate, the second to the cost of production. As shown above, if half of EA exports take place within the area, the exchange rate affects only the remaining half sold abroad. This inverse relationship is highlighted in Fig. 3 by the trend lines 3 of the following two indicators: the Euro/US Dollar exchange rate and the difference of month-on-month variations between EA export to non-EA countries, and EA export to EA countries. The second indicator has made it possible to make a simple estimate of the currency effect on EA export.
Trend lines are sixth-degree polynomial regressions.
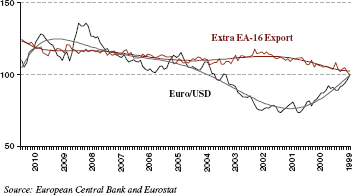
Euro/US Dollar exchange rate and difference between EA export to non-EA countries, and EA export to EA countries (Monthly averages January 1999 = 100 and trend lines).
The cost of production has an impact on exports as a whole and, due to the weak help given by the exchange rate, is one of the key competitive advantages (given a certain quality of products and tradable services). This is especially so if we consider that in world markets, Member States belonging to the EA turn from partners into competitors.
A nationally based competitive advantage
When a currency is devalued, the sectors that gain the most are those with higher labour intensity. With a weaker currency, raw materials and capital are more expensive. For the majority of EA countries, raw materials and energy are imported, while the capital—the commodity par excellence—is priced in international financial markets. Labour, however, is a productive factor with a strong national identity and low mobility (we are still waiting for a fully functioning level playing field in the EU) and is paid in euros, a currency that now has a lower value.
Notwithstanding the single currency, among the 16 EA members are countries specialised in sectors with different degrees of labour and capital intensity, and with different degrees of productivity and costs of factors. In order to give a simple picture of this heterogeneity we compare the change in real labour costs since the introduction of the euro (from 1999 to 2009) with how capital- or labour-intensive a country's economy is, at an aggregate level.
Thus we consider the following indicators: ‘real unit labour cost’ which is the relationship between how much each worker is paid and the value of what he/she produces 4 ; and ‘investment per person employed’ which is the gross investment in tangible goods divided by the number of persons employed.
The indicator compares remuneration (compensation per employee) and productivity (GDP per employee) to show how the remuneration of employees is related to the productivity of their labour.
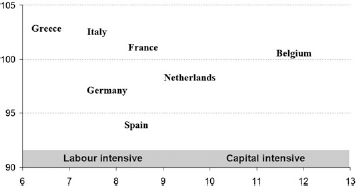
Investment per person employed (thousand euros, 2006–2007 average, X axis) and 2009 real labour unit cost (1999 = 100, Y axis).
In a sample of seven EA countries (see Fig. 4), if we consider Greece, Italy, Germany and Spain as having relatively more labour-intensive economies (they report a lower value of ‘investment per person employed’), only Germany and Spain have adopted labour market policies consistent with their model. Both governments succeeded in controlling real labour costs by keeping them in line with, or even below, the 1999 value. That has been undoubtedly a driver for their degree of national competitiveness.
Concluding remarks
Some final remarks about the EU's exports, focusing on what, where and who. Despite its leading role in world markets, the EU's performance in exporting high-tech products is slightly lower than its overall market share. Given its level of development, the EU should do much better with high-tech products than with the rest of its exports. This raises concerns about the EU's capacity in the future to keep its products at the cutting edge of quality and innovation.
Worrying signs come from the fact that the EU has lost significant market share in some of the fast-growing emerging markets, particularly in Asia. In the long run, this underperformance in some of the most promising markets could undermine the EU's overall position in international trade. Some current individual country developments within the EA may be foreshadowing the potential risks associated with weaknesses within the same group. The exchange rate of the euro, in fact, tells only half of the story as far as domestic competitiveness is concerned.
In recent years, German exports have excelled relative to the other EA members. This surge in exports took place during a period of particularly weak domestic demand and is partly the result of a spillover of foreign direct investments (FDIs), particularly in the countries which joined EU in the 2004 and 2007 enlargements, as well as a result of successful ongoing industrial restructuring. Meanwhile, some EA countries are experiencing losses in their market share as a result of the product and market specialisation of their exports, as well as through poor prices and non-price competitiveness. Italian exports, for example, have suffered from fierce and direct competition from both the new EU Member States and Asia, combined with weak technological competitiveness.
Footnotes