
Abstract
Performance on achievement tests is characterized by an interplay of different individual attributes such as personality traits, motivation or cognitive styles. However, the prediction of individuals’ performance from classical self–report personality measures obtained during large and comprehensive aptitude assessments is biased by, for example, subjective response tendencies. This study goes beyond by using behavioural data based on two different types of tasks, requiring different conscientious–related response behaviours. Moreover, a typological approach is proposed, which includes different behavioural indicators to obtain information on complex personality characteristics. © 2020 The Authors. European Journal of Personality published by John Wiley & Sons Ltd on behalf of European Association of Personality Psychology
Introduction
During the last three decades, several studies on academic performance have addressed the relevance of person characteristics that extend beyond an aptitude for academic success. These consist of, for example, the impact of so–called noncognitive skills such as attention, executive function, inhibitory control, self–control, self–regulation, effortful control, emotion regulation, delay of gratification and temperament (Smithers et al., 2018). Moreover, research has indicated that (certain) Big Five personality traits (Furnham, Monsen, & Ahmetoglu, 2009; Trapmann, Hell, Hirn, & Schuler, 2007), motivational aspects, and cognitive styles influence the academic performance of individuals (Baumert & Demmrich, 2001). Performance on achievement tests (e.g. entrance examinations) is therefore characterized by an interplay of different individual attributes. However, the prediction of individuals’ academic performance from classical self–report personality measures obtained during large and comprehensive aptitude assessments is impeded by prospective students’ strong incentives to present themselves as highly motivated, highly qualified and conscientious. This bias is well known (e.g. Krammer & Pflanzl, 2015, with regard to teacher entrance examinations) and has been discussed as one potential reason for the low predictive validity of personality measurements in entrance examinations (e.g. MacKenzie, Dowell, Ayansina, & Cleland, 2017, with regard to admission to medical schools). As the value of the computerized assessment of personality characteristics in university entrance tests is well–established (Oswald, Schmitt, Kim, Ramsay, & Gillespie, 2004), we propose an assessment approach that may also serve as a starting point from which to change and broaden the methods of psychological measurement by including different behavioural indicators to obtain scores on complex personality characteristics—instead of, for example, relying on self–report data.
The Role of Behaviour–Based Objective Personality Tests in Achievement Situations
Self–report questionnaires still represent the central method for assessing personality–related attributes in research and practice. Especially with reference to entrance examinations and high–stakes tests, they have been criticized, for example, for their sensitivity to impression management tactics and self–deception (Donovan, Dwight, & Hurtz, 2003; Edwards, 1957; Viswesvaran & Ones, 1999). Critics have noted that some constructs of interest may generally not be validly accessible to self–evaluation (Ortner & van de Vijver, 2015), resulting in the postulate that the assessment of particular aspects of personality constructs requires certain, sometimes different methodological approaches (Schmitt, Hofmann, Gschwendner, Gerstenberg, & Zinkernagel, 2015).
As an alternative or complement in the assessment process, the use of behavioural indicators has a long history (Cattell, 1890). The idea behind using these measures, later described as objective personality tests (OPTs), was already proposed by James McKeen Cattell who created a set of mental tests in 1890. Such procedures later garnered a great deal of attention as a result of Raymond Bernard Cattell's broad theoretical and empirical work, which was based on the postulate that a comprehensive investigation of personality requires heterogeneous data sources, including self–report data (Q–data), life indicators of personality often obtained from observer reports (L–data) and objective performance or test data (T–data; Cattell, 1890; Cattell, 1946; Cattell & Kline, 1977). The current definitions of OPTs postulate several features: (i) they collect data about an individual's characteristics by assessing the person's behaviour in a highly standardized miniature situation. (ii) OPT scores are not based on self–estimation or self–ratings regarding the construct of interest. (iii) The aims of OPTs are masked or are not easy to identify (Ortner & Proyer, 2018). Newer OPT approaches have benefitted from the development of computer technologies as these can provide highly flexible and varied methods of item presentation and the precise recording of a person's actions (Ortner et al., 2007). Nevertheless, not all constructs can be comparably validly addressed by all methods; for example, interpersonal behaviour and social variables (e.g. extraversion) were reported as difficult to assess with standardized OPTs (Pawlik, 2006). Furthermore, the diversity in the design and scoring of OPTs means that researchers cannot generalize their findings on the psychometric properties of one OPT to other OPTs (Ortner & Schmitt, 2014).
Achievement tests challenge test takers to demonstrate their maximum performance at a certain point in time and in a mostly unfamiliar situational context. This is especially true for high–stakes tests, such as entrance tests for a programme of study or job position. In fact, research has revealed that performance on such a high–stakes test is a result of (i) an individual's knowledge, skills or ability that a test is supposed to assess; (ii) situational conditions (Nguyen & Ryan, 2008) and (iii) an individual's personality–related characteristics, for example, test anxiety (Hembree, 1988; Seipp, 1991), motivation (Baumert & Demmrich, 2001; Richardson, Abraham, & Bond, 2012) or conscientiousness (Poropat, 2009; Trapmann et al., 2007). Whereas studies have revealed only small relations between conscientiousness and ability test results (Ackerman & Heggestad, 1997), conscientiousness was found to be a highly relevant aspect of personality for predicting academic performance (Poropat, 2009).
Behaviour–Based Objective Personality Tests and Big Data
At present, the increasing importance and availability of behavioural data due to technical advances has raised interest in OPTs. Especially in highly standardized and computerized achievement situations, candidates’ actual behavioural data may serve as an additional source of information regarding certain aspects of a person's personality. Computerized testing technology allows data to be automatically generated during a test session (e.g. during the processing of a test), with some of these data falling ‘outside’ the direct conscious or controlled behaviour of the test taker (e.g. reaction times). In the context of large and comprehensive computerized achievement situations, some of these behavioural data may be subsumed under the label of ‘Big Data’:
Volume, velocity and variety, the three Vs, were reported as main characteristic elements of Big Data (Laney, 2001). Using the clicks and reaction times in computerized assessments of hundreds of participants during a multi–hour testing battery including hundreds of items represents at least two, volume and velocity (Chen & Wojcik, 2016). The behaviour–based information (clicks and response times) is automatically logged at high speed (velocity) parallel to the test completion. However, the total amount of data integrated into this study (volume) may appear small compared with other, more classical Big Data settings. Nevertheless, with reference to Chen and Wojcik (2016), it would be wrong to dismiss this label prematurely. First, at present, there is no agreement on a clear–cut limit separating Big Data from small data, and second, it is also a more useful approach within psychological science to generate small data based on Big Data to learn something about what conclusions can be drawn from the indicators based on Big Data. Nevertheless, the authors even argue that psychological research can possibly benefit most from using Big Data analytical approaches on psychologically relevant and usable small data sets, and we propose that the analyses we propose may serve as a starting point for including large data sets into personality research.
Research on the usability of such behavioural data in personality research is still rare. As an example, Moore and Shute (2017) recently described a promising approach by using so–called ‘stealth assessments’ in a game–based learning context (e.g. a computerized Physics Playground), through which a large amount of behaviour–based data is recorded in a short time. Automatically, logged actions of the test takers were used as a basis for the development of behaviour–based indicators for conscientiousness, more specifically on the specific facets ‘persistence’ (e.g. calculated through time spent on unsolved problems, number of restarts), ‘carefulness’ (e.g. average time between actions, average time before making an action) and ‘perfectionism’ (number of revisits).
However, personality traits are supposed to be hypothetical constructs—and are not directly observable but considered as basic dispositions (McCrae & Costa, 1995). Neither conscientiousness, nor specific facets of conscientiousness are directly observable. Whereas questionnaires can possibly tap every remembered or estimated possible behaviour or thought in memory or imagination, behavioural data require a careful identification of possible factual indicators that appear significant for drawing conclusions about the personality traits under investigation. In order to detect such indicators, we went back to the literature. For example, industriousness has been measured by the time spent solving very difficult tasks in literature (Moore & Shute, 2017).
The Role of Conscientiousness in Achievement Situations
The most prominent personality taxonomies have included conscientiousness, for example, the Big Five model (e.g. Chang, Connelly, & Geeza, 2012; Costa & McCrae, 1992) and the HEXACO model of personality (e.g. honesty–humility, emotionality, extraversion, agreeableness, conscientiousness and openness to experience; Anglim, Knowles, Dunlop, & Marty, 2017; Ashton, Lee, & De Vries, 2014). Authors have proposed different facets of conscientiousness (e.g. industriousness, perfectionism, tidiness, procrastination refrainment, control, cautiousness, task planning and perseverance; MacCann, Duckworth, & Roberts, 2009; Brent W. Roberts, Lejuez, Krueger, Richards, & Hill, 2014). According to the definition by John and Srivastava (1999), conscientiousness represents ‘socially prescribed impulse control that facilitates task– and goal–directed behaviour, such as thinking before acting, delaying gratification, following norms and rules, and planning, organizing and prioritizing tasks’ (p. 121). Furthermore, daily life behaviours related to conscientiousness have been identified empirically (e.g. double–checking one's work, proofreading one's writing and keeping track of people's birthdays; Jackson et al., 2010). Additionally, newer research has formulated hypotheses and attempted to explain behaviour on achievement tests: Costantini and Perugini (2016) have recently proposed a framework for the interpretation of the relation between conscientiousness and specific behaviours such as test performance. With reference to a network perspective on conscientiousness, they focused on the cognitive, behavioural, motivational and emotional features shared by different facets. The researchers analysed how different facets and aspects of conscientiousness, assessed through a large number of questionnaires, can be clumped into a lower number of major dimensions. In two samples, they revealed that self–control was responsible for the variance that was shared between the so–called proactive pole of conscientiousness, also described as ‘industriousness’, and the inhibitive pole, also labelled ‘impulse control’. Whereas the authors defined industriousness as initiating and persisting in goal–directed behaviours and requiring perfection from oneself, they characterized impulse control as the exertion of control over impulses and temptations. Furthermore, industriousness and impulse control were not found to be positively connected to each other, indicating that they were substantially independent. Although these findings suggest that conclusions about individuals’ behaviour can be drawn, Costantini and Perugini (2016) based their analyses—and therefore their conclusions—on only self–report questionnaire data even though they did have an impressive number of data points. Consequently, behavioural data confirming their findings are missing.
With regard to considerations of regulation theory, the characteristic of being flexible across changing conditions is an important aspect for handling high–stakes performance situations. Impulsive and reflective test performance behaviours are typically differentiated as general response styles (Nietfeld & Bosma, 2003). In line with this, research has suggested that certain aspects of conscientiousness may play a crucial role in executive functioning related to task performance; a recent study found that conscientiousness was related to cognitive ability and was characterized by flexibility and the ability to adapt to changing environmental contingencies and task demands (Fleming, Heintzelman, & Bartholow, 2016; Stock & Beste, 2015). Thus, test candidates were described as either ‘impulsive’ with relatively fast and error–prone response behaviours or as ‘reflective’ with relatively slow and more accurate (response) behaviours. Interestingly, across different types of tasks, the most effective test takers were not consistently extremely impulsive nor were they consistently extremely reflective. Rather, the successful individuals were characterized by a flexible, task–oriented and requirement–oriented response behaviour. In the following, we therefore aimed to suggest a new approach for assessing this flexibility.
The Present Study
With this study, we aimed to add basic research on the conceptualization and assessment of conscientiousness through behavioural tests in terms of a flexible task–oriented and requirement–oriented response behaviour. We aimed to investigate whether behavioural information from two different tests, representing either the proactive (industriousness) or inhibitive (impulse control) poles of conscientiousness may serve as meaningful ways to conceptualize conscientiousness.
As a methodological framework, we employed a typological perspective in order to map the complex interplay of different supposedly independent behavioural scores. The typological approach has a long history in psychology and is aimed at providing information about differences between individuals by summarizing their expression on several independent characteristics. The advantages and disadvantages of the typological approach have been the subject of critical discussion in recent decades (Bergman & Trost, 2006; Meehl, 1992; Robins, John, & Caspi, 1998), and this approach has been rejected in order to make important decisions about individuals in practice (Freudenstein, Strauch, Mussel, & Ziegler, 2019). Nevertheless, typological approaches have been employed in contemporary personality research (e.g. Ferguson & Hull, 2018; Rosenström & Jokela, 2017; Specht, Luhmann, & Geiser, 2014; Zhang, Bray, Zhang, & Lanza, 2015). As a higher order conception of personality, this approach enables researchers to go beyond a single, isolated investigation of personality dimensions and instead to investigate personality as a dynamic system of several overlapping or interacting aspects that define the individual (Ferguson & Hull, 2018). More precisely, the typological approach focuses on groups of people who possess similar patterns of characteristics, resulting in group membership (Robins et al., 1998). Accordingly, in this study, we aimed to identify the smallest possible number of types of responses that allowed a broad categorization of individuals across the two task situations. We included individuals’ behavioural information in terms of (i) the number of items answered, (ii) the number of items solved correctly and (iii) the amount of time needed to work on the items. We grouped individuals with similar scores on these behavioural indicators together in the same type. Therefore, individuals with the same type of personality will have similar profiles with reference to their scores.
Figure 1 illustrates the identification of individuals’ personality types based on behavioural data assessed in a high–stakes test situation. Prospective students’ performance on such large and comprehensive tests is affected by a strong willingness to show their maximum performance in order to achieve the best possible result across the tasks. The candidates process different types of tasks that have different characteristics. For example, tasks may vary in terms of complexity (e.g. the complexity of the material), persistence in processing (e.g. tasks that appear more or less monotonous) and time pressure (e.g. tasks with and without time restrictions). Thus, for each type of task, a specific kind of response behaviour is needed to solve the respective tasks successfully. This behaviour ranges between two poles, a quick but industrious one and a slower and self–controlled one, reflecting candidates’ degree of conscientiousness.
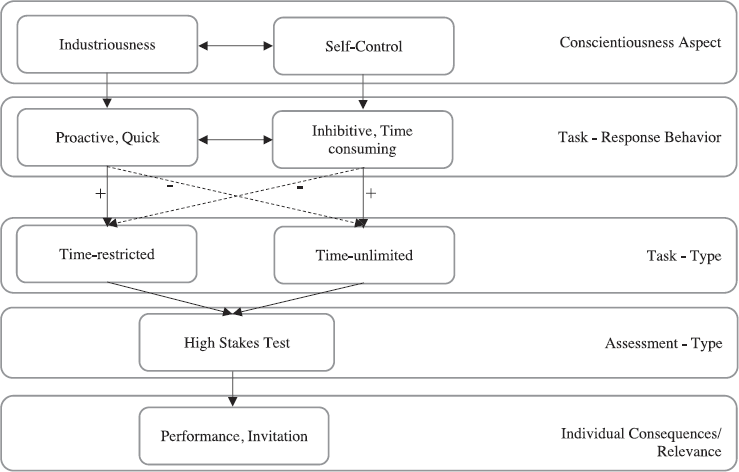
Theoretical concept of the study. Whereas ‘+’ refers to a positive or successful, ‘–’ refers to a negative or less successful association.
Against this background, the general objective of this study was to demonstrate the identifiability and usefulness of different types of responses representing response patterns that fall between a proactive (‘industrious’) behavioural pole and an inhibitive (‘impulse–controlling’) behavioural pole. Therefore, we proposed that a ‘reflective response type’ would correspond with a stronger inhibitive and impulse–controlling aspect of personality and that a ‘more impulsive response style’ would correspond to a more proactive and a more industrious aspect of personality. More specifically, in ‘time–restricted tasks’ (e.g. speeded tests and concentration/attention tests), for example, a proactive and industrious test taker may respond in a faster and more ‘impulsive’ way, which may help to promote fast and goal–oriented (but less accurate) response behaviours. By contrast, an impulse–controlling and inhibitive person may behave with a more ‘reflective’ and careful style, aiming to prevent faulty and careless response behaviour, which may be more helpful in, for example, ‘time–independent tasks’ (e.g. OPTs). However, those who possess the ability to meaningfully adopt strategies and change their behaviour across different tasks (with different demands) should be those who can flexibly change between a more reflective and impulsive response style and should therefore be able to master a more comprehensive test situation more successfully.
In order to obtain relevant test–taking behaviour, we employed two tests: first, we used a task designed as an objective test that was given in the form of an achievement task (a counting test) but was designed to assess impulse control. The items consisted of illustrations of large numbers of unsystematically represented objects on the screen. Test takers were instructed to recognize and count objects with certain characteristics that, especially if they were processed quickly, came with the risk of being overlooked. Test takers were further informed that a correct response was more important than speed on this task. 1 Because test takers had to keep several objects in mind, it was necessary to count at least twice to be sure not to miss anything. In order to achieve higher scores, test takers were put into the situation to initiate and persist in goal–directed behaviours that require perfection from oneself. Even if these tasks appeared to be very simple, test takers were required to suppress the impulse to complete the tasks quickly, and at the same time, they had to invest time to check their own (initial) responses.
Other, similar appearing tasks exist (e.g. Hitt, Trivitt, & Cheng, 2016; Segal, 2012 with regard to the ASVAB) and instruct test takers to be as fast and as accurate as possible, thus addressing coding speed and response rate.
The second test, originally designed to assess concentrated attention, addressed test takers’ industriousness. Test takers were required to keep four different coding rules in mind and to implement them by converting the given sets of stimuli. Compared with the first OPT, candidates were instructed to complete the tasks within a given time interval. We suggest that this type of task includes aspects that require the willingness to exert oneself, to show industriousness by initiating and persisting in goal–directed behaviours and to further prevent oneself from getting distracted as well as from needlessly wasting time. Test takers were required to correctly solve each item from this task while working as quickly as possible and with as much concentration as possible. The conceptualization of the items may appear similar to common perceptual speed tests such as those presented by Ackerman and Beier (2007). In fact, Mount, Oh and Burns (2008) reported that individuals who possess a higher level of impulse control attempted and solved fewer total items in such tasks. In line with our study design, such a finding supports the assumption that, under specific circumstances, it is beneficial to follow the impulse to complete the tasks quickly. The tendencies to control one's impulses and to be cautious may be disadvantageous as they can lead people to ‘waste’ time by rechecking before choosing an answer.
On the basis of the assumption that an extreme form of industrious or self–controlled response strategy may be disadvantageous in particular situations, we further proposed that being flexible in the use of the response strategies reflects another underlying aspect of personality (Barrick, Mount, & Judge, 2001; Rammstedt, Danner, & Martin, 2016). Thus, from the trait perspective, we postulated that impulsivity, reflectivity and flexible behaviour are personality attributes. The same as a ‘pure’ impulsive or reflective response pattern, an adaptable behaviour can influence an individual's performance (e.g. when it comes to complex aptitude and entrance tests for university studies or a job application). Therefore, individuals who are able to use both reflective and impulsive response strategies in accordance with the demands of the tasks should achieve the best test results.
We further included sex, age and (school/academic) performance as covariates. With reference to sex, research has revealed that women score somewhat higher than men on certain facets of conscientiousness, such as self–discipline (Costa, Terracciano, & McCrae, 2001; Feingold, 1994; Weisberg, DeYoung, & Hirsh, 2011). More pronounced sex–related differences where men scored higher than women were revealed for industriousness (Weisberg et al., 2011). With reference to age, studies have revealed age differences with reference to particular facets of conscientiousness. For example, studies have reported that industriousness tends to peak in middle age before declining in late life, whereas impulsiveness and a lack of self–control increase linearly with age (Chopik, 2016; Roberts, Chernyshenko, Stark, & Goldberg, 2005). Finally, intellectual performance was further included in this study due to findings on its relation to academic achievement (O'Connor & Paunonen, 2007). Higher levels of conscientiousness have been found to be related to grades in school (Zhang & Ziegler, 2016), final grade point average and results on the Scholastic Assessment Test (Hakimi, Hejazi, & Lavasani, 2011; McCredie & Kurtz, 2020; Steinmayr, Bipp, & Spinath, 2011). However, small effect sizes have been explained by mediators such as performance motivation, learning strategies and goal orientation (Sorić, Penezić, & Burić, 2017; Zhang & Ziegler, 2016). Only a few studies have suggested that impulse control, order and industriousness have a closer link to better grades in school (Costantini & Perugini, 2016; Steinmayr & Spinath, 2008).
The present study is the first to apply the typological approach to specify individuals’ response styles in a high–stakes assessment situation. Therefore, in the present study, we explored four research aims.
We aimed to examine whether different types of reflective and impulsive response tendencies could be identified with regard to the objective self–control (OSC) test of conscientiousness and the concentrated attention test (CAT).
We expected only impulsive test takers to be (somewhat) faster but more error–prone compared with constantly reflective candidates across the concentrated attention and counting tests. By contrast, we expected reflective test takers to be (somewhat) slower but less error–prone than impulsive test takes across the different test demands. However, we expected test takers who are able to switch between impulsive and reflective behaviour—depending on the task—to tend to be faster on the CAT and slower on the OSC test of conscientiousness. We expected the error rate for these test takers to be lower on both tests.
Because of the small effects of sex, age and grades on conscientiousness (Roberts et al., 2005; Weisberg et al., 2011; Zhang & Ziegler, 2016), we considered the relations between these variables and possible response types in an exploratory way.
We analysed whether the identified types could be characterized (predicted) by selected person characteristics such as sex, age and average grade on the school–leaving certificate.
Further, we aimed to investigate whether an extreme level of an industrious or self–controlled response strategy may be disadvantageous compared with a more demand–related adaptable response behaviour.
We investigated whether extreme industrious or self–controlled strategies would be related to lower performance scores on the entrance test as well as a lower likelihood of receiving an invitation to a programme of study. We further proposed that being flexible in the use of the response strategies would be related to a more successful test outcome (higher performance score and a higher likelihood of receiving an invitation).
As we investigated a new, exploratory approach that could be used to identify response types, we aimed to confirm our final solution and interpretation.
We tested whether the final set of types would show robustness compared with alternative sets of types and across a second independent data set.
Compared with alternative arrangements of types, we expected that the final set of types would produce the best fitting regression model with significant and interpretable associations with sex, age and grade as well as with performance and invitation to a programme of study. Furthermore, we expected to replicate the final set of types itself in a second, independent data set. We further postulated that the correlational structure across the two data sets would not differ significantly and would be invariant across data from two subsequent years.
Method
All analyses were based on cross–sectional data that were collected during a medical programme entrance test in 2017 as well as in 2018 in Austria. The entrance test was developed to examine whether the candidates’ abilities, knowledge and competencies as well as their personality characteristics met the programme's requirements. Along with information about participants’ demographic characteristics (e.g. age and sex), a total of 11 different standardized cognitive and noncognitive tests were administered each year. As the test materials and procedures (e.g. the tests and instructions) were almost identical between the 2 years, we describe the procedure once and then address specific differences between 2017 and 2018. All the data analysis scripts, materials and anonymized data necessary to reproduce these results are publicly available at OSF: https://osf.io/gdjqk/.
Procedure
Cross–sectional data were collected from two independent medical programme entrance tests in Austria (one in 2017 and one in 2018). After prospective students had submitted a written application to the medical programme, they were invited to register to take the entrance test. Students had to pass the test to be admitted into the study, and active consent was obtained from all participants. Finally, each entrance test took place during six consecutive days in April with a maximum of two test sessions per day, beginning at 8:00 am for the first session and at 1:00 pm for the last session in a specially prepared lecture hall on campus.
Each candidate was provided a workspace with a laptop and a computer mouse as well as an extra paper–pencil questionnaire (for a detailed description, see Leiner, Scherndl, & Ortner, 2018). The computerized 4–h aptitude test battery consisted of 11 subtests, including basic knowledge in physics, biology and chemistry; figural and numerical reasoning; memory; planning skills; spatial perception; multitasking; English text comprehension and tests of concentrated attention and aspects of personality. Further, participants provided information about themselves (sex, age, nationality, grades in specific school subjects and final grade on the school–leaving certificate). Prior to all analyses, we excluded data that were based on insufficient instrument completion (if information was missing on the counting test, the CAT, performance test indicators or demographic information that was necessary for the analysis).
In April 2017, the first entrance test (2017 data set) was administered, and information from N = 774 candidates was available. On the basis of the selection criteria, 768 participants, including 452 women between the ages of 17 and 45 (M = 20.75, SD = 2.66) and 316 men between the ages of 18 and 36 (M = 21.19, SD = 2.56) completed the battery (59.8% German citizens; 35.4% Austrian citizens; 4.8% other countries). On average, the self–reported grade on the school–leaving certificate was good (M = 2.2, SD = 0.7). For the second entrance test in 2018 (2018 data set), data from 856 candidates were available. The final sample comprised 745 participants, including 449 women between the ages of 18 and 48 (M = 21.30, SD = 2.70) and 296 men between the ages of 18 and 43 (M = 21.19, SD = 2.56) who completed the battery. The majority of the test takers were German citizens (59.2%) or Austrian citizens (35.2%), and only 5.5% came from other countries. The average final grade from the last school report was good (M = 2.2, SD = 0.6). Descriptive information can be found in Table 1 [(a) 2017 data set and (b) 2018 data set].
Means, standard deviations, intercorrelations and confidence intervals for all scores
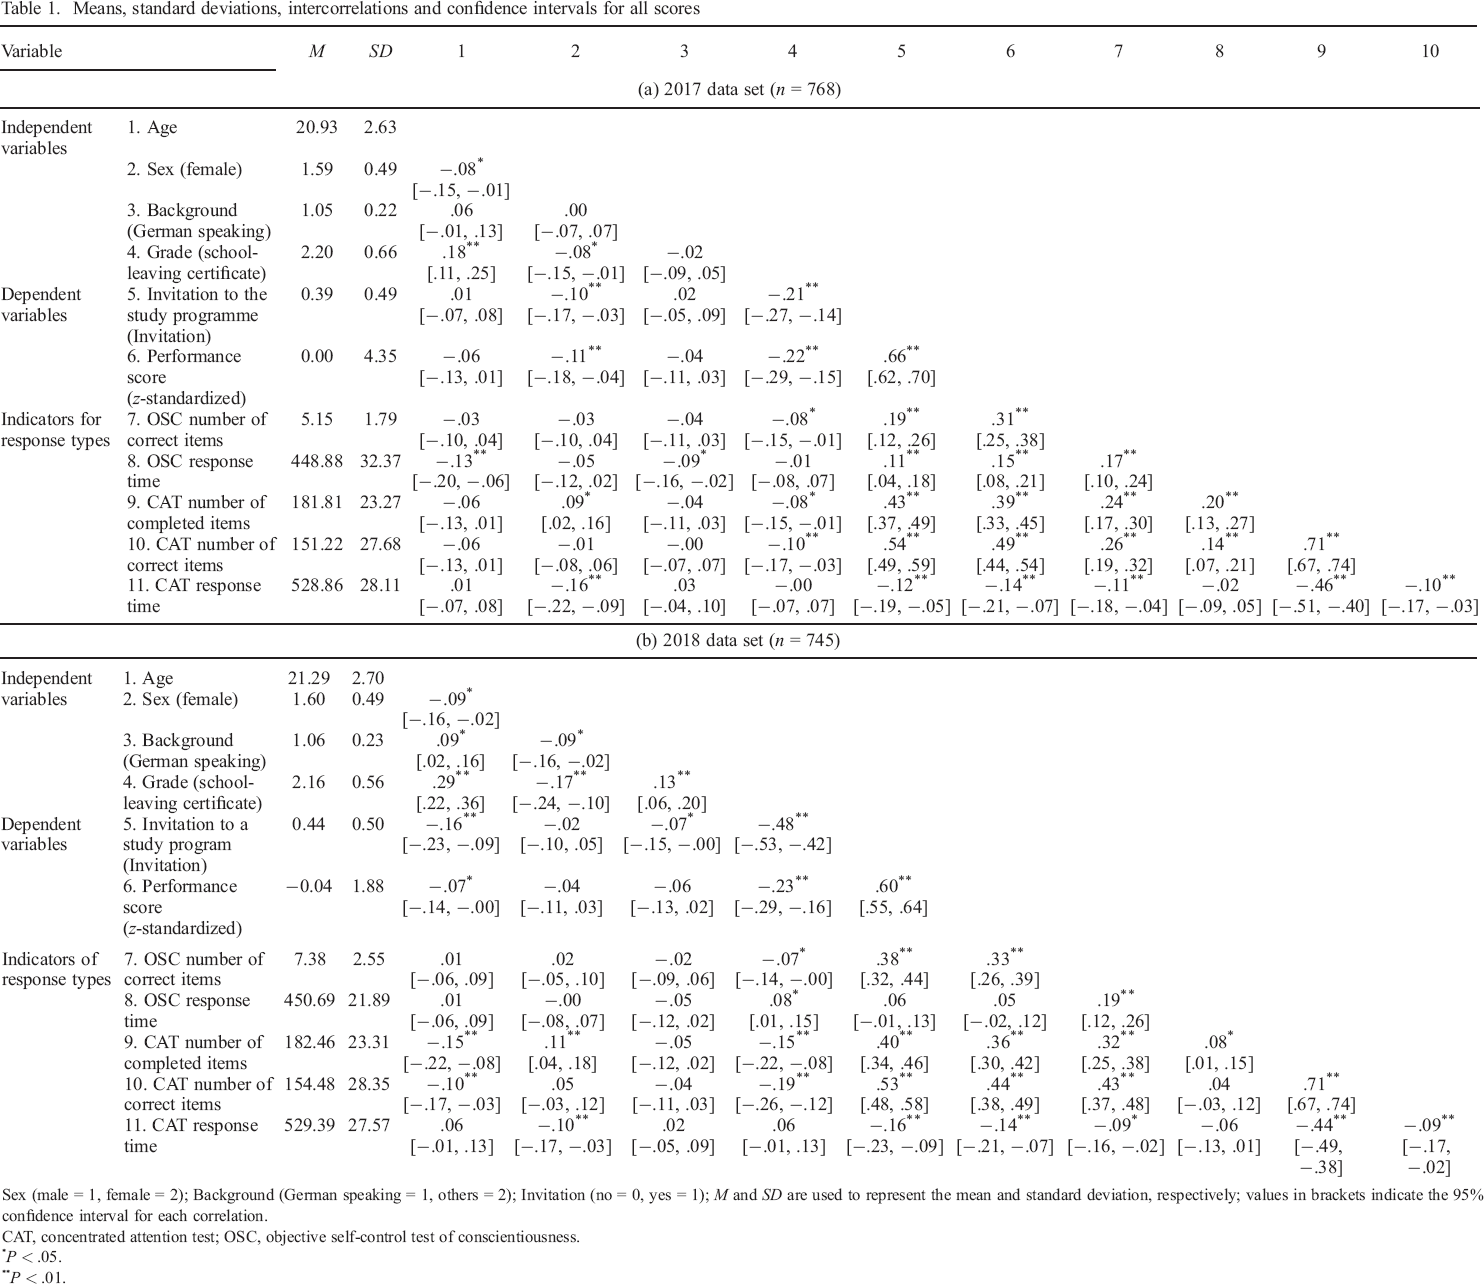
Sex (male = 1, female = 2); Background (German speaking = 1, others = 2); Invitation (no = 0, yes = 1); M and SD are used to represent the mean and standard deviation, respectively; values in brackets indicate the 95% confidence interval for each correlation.
CAT, concentrated attention test; OSC, objective self–control test of conscientiousness.
P < .05.
P < .01.
Measures
Response type indicators
The identification of response types was based on two different tests: an OSC test of conscientiousness and a CAT test. A total of five behavioural indicators were extracted from these tests. As there are some differences between the 2017 and 2018 data sets, general information is presented first, followed by information that is specific to a certain year.
Objective self–control test
This newly developed test is aimed at assessing impulse control, characterized as an inhibitive pole (control over impulses and temptation) and a preference for reflective rather than spontaneous (response) behaviour (Costa & McCrae, 1992). Test takers were instructed to recognize and count the number of times a certain letter, number or symbol appeared on a line or in a cloud of several characters (Figure S1). For example, for the first type of item, previously defined characters had to be counted (e.g. ‘How many “b's are shown?’), and in the second type of item, an additional rule (e.g. ‘How often does a 3 come after a 7?’) had to be considered. Test takers were instructed to insert the correct number in an open box. Importantly, test takers were further instructed that inserting the correct number was important, not working speed. With reference to the test design, we hypothesized that the large number of target stimuli and the large number of distractors implemented in the items would require a very diligent and attentive counting procedure. We expected that test takers who claimed to be able to achieve correct solutions would invest more time checking their solutions as opposed to test takers who did not claim to have high achievement with respect to the correctness of their solutions. With reference to scoring, each correct input was considered a correct response.
In the 2017 entrance test, the test takers were administered 24 items. Six items were excluded from the analysis because their variance was too small, resulting in 18 items and in a maximum possible score of 18 (Mcorrect = 5.2, SD = 1.8, Range: 0 to 10). The internal consistency was acceptable (α = .62). As another score, the time taken to solve all items (Mtime = 448.9 ms, SD = 32.3, Range: 154.0 to 479.0) was calculated (Table 1, panel a). Due to the skewed distribution of working time measurements, a log transformation was additionally applied to achieve an approximate normal distribution of the data (Baayen & Milin, 2010).
In the 2018 entrance test, again, test takers were presented 18 items. As done for the test in 2017, a sum score was calculated (Mcorrect = 7.4, SD = 2.5, Range: 0 to 16). The internal consistency was acceptable (α = .69). Further, the sum of the response times was calculated (Mtime = 450.7 ms, SD = 21.9, Range: 329.5 to 478.6) and again included in the analyses as a log–transformed score (Table 1, panel a).
Concentrated attention test
The CAT was used to capture candidates’ behavioural reactions in time–restricted test environments. On the CAT test, test takers were instructed to complete 25 assignment tasks as quickly and accurately as possible within a limited (restricted) time interval. Test takers were instructed to memorize the assignment of letters to numbers (e.g. A = 1). Items consisted of a row of nine different numbers each assigned to a letter. Furthermore, a ‘translation table’ was provided with six letters assigned to six symbols (i.e., characters). Test takers were instructed to assign a corresponding symbol (from the translation table) to the nine randomly presented numbers given in a new table (Figure S2). This means that test takers had to apply two mental transformations to each stimulus. They were given 30 s to work on the first 10 items and 20 s to work on the remaining 15 items. In addition, the translation table was regenerated after every five items. All test takers were presented 25 items, including a maximum of six characters (letter–symbol assignments). However, the number of characters finalized by the person (within an item) can vary between test takers, depending on the speed they needed to solve a given (letter–symbol) assignment within the given time intervals (maximum 225 characters). An item was considered solved when the assignment of symbols to the given numbers was completed correctly.
Based on the 2017 data set, three different indicators were employed for the given study: The first indicator consisted of the number of number–symbol assignments the test taker worked on, regardless of whether the tasks were solved correctly or not (Mnumber = 181.9, SD = 23.3). This was an indicator of working speed. Second, a sum score of correctly solved number–symbol assignments (Mcorrect = 151.1, SD = 25.9) was calculated. The internal consistency of the sum score was good (α = .86). Third, the time needed to work on all 25 tasks (M = 528.6, SD = 28.7) was calculated (Table 1, panel a). Due to the skewed distribution of time measurements, a log transformation was additionally performed to achieve an approximate normal distribution (Baayen & Milin, 2010; Whelan, 2008).
For the data from the entrance test in 2018, the same three indicators were calculated as for the test in 2017, comprising the number of letter–symbol assignments the test takers worked on (Mnumber = 182.5, SD = 23.3), the sum of correctly solved assignments (Mcorrect = 154.5, SD = 23.3), and a log–transformed indicator of the time the test takers needed to work on all 25 tasks (Mtime = 529.4, SD = 27.6; Table 1, panel b). Again, the internal consistency of the sum score was good (α = .88).
Covariates
Sex, age and grade on the school–leaving certificate were included for a more detailed description of participants’ profiles. The same indicators were employed for the analyses in 2017 and 2018. To predict the different ‘response types’, sex (men = 1, women = 2), age (z–standardized) and the final school grade (z–standardized) were used. In both data sets, the independent variables were based on test takers’ given subjective information that was obtained at the end of the test session.
Test takers’ test performance and whether or not they were invited into a programme of study were used as dependent variables in 2017 and 2018. The overall test performance of each candidate was calculated as an average z–standardized score containing the individual results of five subtests. It included tests designed for the assessment of memory capacity (verbal, numerical and figural), multitasking skills, numerical and figural reasoning, and spatial perception. As a second indicator of successful participation, we collected information on whether the candidates had been invited into the programme of their choice (0 = no, 1 = yes).
Statistical analyses
Regarding the first step in the main analysis, latent profile analyses (LPAs) for the cross–sectional data from 2017 and 2018 were employed to identify and examine the structure and validity of the expected response types. The basic idea of LPAs (Pastor, Barron, Miller, & Davis, 2007; Vermunt & Magidson, 2002) is to introduce a categorical latent variable to explain the associations between continuous observed indicators. For the underlying LPA analysis, the aim is to identify different types of responses that are based on five behavioural indicators (OSC: number of correct items and amount of processing time; CAT: number of processed items, number of correct items and the time needed to complete the test). For each individual, the type that he or she was most likely to belong to was identified on the basis of the person's individual response pattern on these five indicators. The subtypes could then be described in relation to the proportional size (i.e., the relative number of individuals per subtype) and in relation to the type–specific characteristics on the observed indicators.
Using MPlus 7.4, several LPAs were estimated for the 2017 data set (Muthén & Muthén, 1998–2018). To empirically identify the possible types and to ensure that we did not miss a relevant type, we estimated a series of models (until no more solutions could be identified) that differed in the number of types. As no ‘ideal’ fit index exists (Specht et al., 2014; Tein, Coxe, & Cham, 2013), we compared the fit of these models by using different indices. Commonly used indices are the Akaike Information Criterion (AIC) and the sample–size–adjusted Bayesian Information Criterion (SABIC) with smaller values indicating a better fit (Nylund, Asparouhov, & Muthén, 2007; Tein et al., 2013). Whereas the power to identify the correct number of types for the AIC was low regardless of sample size and number of indicators, the SABIC seemed more robust and useful (Tein et al., 2013). The entropy as a widely accepted indicator of the quality of the underlying profile solution (a value close to 1.00 indicates a better fit) was also reported, even though this indicator has proven not to be robust (for smaller sample sizes and smaller numbers of indicators) in a number of simulation studies (Nylund et al., 2007; Tein et al., 2013). Finally, we used a robust version of a likelihood ratio statistical test, more precisely, the bootstrapping likelihood ratio test (BLRT). The test compares the properties of two adjacent solutions, for example, a model with K − 0 types (e.g. a three–type solution) with a model with one fewer type (K − 1 model; e.g. a two–type solution) or a model with one more type (K + 1 model; e.g. a four–type solution). A significant difference indicates that the model with more types should be preferred (Asparouhov & Muthén, 2012; Dziak, Lanza, & Tan, 2014). Although this test only compares two solutions at the same time, this test is preferable, especially for larger samples (Dziak et al., 2014). As the information indices can lead to an overextraction of types, authors have recommended that additional criteria be used, such as the theoretical appropriateness and interpretability (Marsh, Lüdtke, Trautwein, & Morin, 2009). Thus, an additional type for a more complex solution should only be interpreted if this type represents more information than a simple variation of types from a less complex solution with fewer types. To obtain the sparsest and most interpretable solution, we therefore inspected the group sizes, group means and effect sizes. For the effect size, we used Cohen's d, which is a commonly used effect size measure of the univariate mean difference between two groups (Dziak et al., 2014; Tein et al., 2013).
In the second step of the main analysis, the regression model was specified (2017 data set). To test the relationships between the identified types and the independent as well as the dependent variables, we applied simple path models by using the r package ‘lavaan’ (Rosseel, 2012). More precisely, sex, age (z–standardized) and grade on the school–leaving certificate (z–standardized) were used as manifest indicators to predict the types. Further, membership in a certain type served as a predictor of a candidate's test performance (z–standardized) and the invitation to the programme of study.
Because the models specified here are saturated manifest path models, a common outcome of manifest models (Kline, 2011), no global model fit indexes (e.g. χ2 value, root mean square error of approximation and comparative fit index) could be used to evaluate the global model fit. Therefore, to evaluate the appropriateness of the model findings, we focused instead on the estimated standardized model parameters and the explained variance (R 2 values). In addition, to obtain more reliable estimates of the model parameters and their significance, we calculated confidence intervals (CIs) by using bootstrapping, a resampling method (Nevitt & Hancock, 2001). The resampling was iterated a large number of times (10 000 resampling cycles) in order to yield distribution estimates for the model parameters. A 95% CI was used to determine the significance of the indirect effect; that is, if zero was not included in this interval, the effects could be considered statistically significant. The proposed regression model is presented in Figure 2.
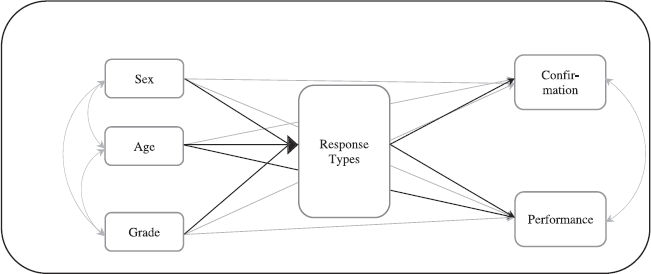
The proposed research model (path model). Response types indicate different types identified by the latent profile analysis.
The ‘test of robustness’ was based on multiple steps. In Step 1, based on the 2017 data set, the regression model with age, school grade and sex as independent variables and confirmation and performance as dependent variables was modelled for the alternative (adjacent) solutions. The aim was to show that the final solution was the most sufficient and most meaningful solution. In Step 2, we tested the robustness of the final solution on the basis of another independent data set from 2018. Similar to the LPA analyses based on the 2017 data set (corresponding to Step 1), several LPAs were specified and compared with each other. Insofar as the final solution from the 2017 data did not fully depend on the specific sample characteristics, a similar solution should be identifiable when based on the 2018 data set. In Step 3, using the 2018 data set, we further specified the regression model (corresponding to Step 2), including the final solution, age, sex and school grade (as independent variables) as well as confirmation and performance (as dependent variables). To test the degree of similarity between the 2017 and 2018 regression models, we tested the significance of the differences in the path coefficients. Based on both data sets, a multigroup model with the year of the assessment was specified, testing the invariance of the regression coefficient across the data sets.
Results
Preliminary analyses
Means, standard deviations and intercorrelations among all study variables are presented in Table 1 [(a) for the 2017 data set and (b) for the 2018 data set]. Notably, in both data sets, the item–based indicators from the OSC and CAT were positively related to each other (2017: r = .24 to r = .26; 2018: r = .32 to r = .43). Test takers who needed more time for the OSC items solved more of these items (2017: r = .17; 2018: r = .19), but test takers who needed more time for the CAT items solved fewer CAT items (2017: r = −.10; 2018: r = −.09). Finally, test takers with more correct OSC and CAT items reported better school grades (2017: r = −.08 and r = −.10; 2018: r = −.07 and r = −.15), achieved higher performance scores (2017: r = .31 and r = .49; 2018: r = .33 and r = .44) and were more often invited into the study programme of their choice (2017: r = .19 and r = .54; 2018: r = .38 and r = .53).
Main analyses
With reference to Research Aim 1, the identification of response types, we examined whether an adequate solution could be found in the 2017 data set for the response types (for two to seven types, Table S1, left hand side). The latent model with seven types did not converge. Inspection of the entropy indices for the latent profile solutions with two to six types did not indicate a clear solution. Indicators ranged from .83 to .86. The ‘quality’ of the solutions was relatively good but similarly high across the profile solutions. Further, the AIC became consistently smaller as the number of latent types increased, a typical result in LPA, especially in large samples (e.g. Marsh et al., 2009). The lowest values for the SABIC criteria occurred for the latent profile solutions with three and four types. No clear solution could be identified on the basis of these values. Finally, the BLRT test revealed a significant difference between the models with solutions with two versus three types. However, no differences between the models with solutions with three versus four types or any other higher order solutions were found. Thus, the solution with three types was favoured as this solution described the data best and in the sparsest and simplest way.
In addition to these results, we also relied on the (theoretical) appropriateness and interpretability of the solutions by comparing the three–type with the two–type (Table S3 left hand side) and four–type solutions (Table S4 left hand side). We preferred the three–type solution as it was the most interpretable model, for example, with reference to group sizes and response patterns. More precisely, the profiles in the two–type solution differed only with respect to the CAT scores (Profile 1: n = 412; Profile 2: n = 356). Thus, this solution seemed to provide insufficient information with respect to relevant potential behavioural differences between the types. By contrast, the three–type solution resulted in three distinct profiles that differed in both the CAT and OSC and therefore provided meaningful information on the configuration of response types. The four–type solution reproduced the same profiles as the three–type solution plus an additional and smaller subtype (Profile 1: n = 59, Profile 2: n = 262, Profile 3: n = 174 and Profile 4: n = 273). Characteristically, test takers characterized by this fourth type seemed to be especially weak in their OSC (only a few correct items and a comparatively long time spent working on the tasks) and CAT scores (i.e., a comparatively small number of items completed and solved correctly with a relatively long amount of time needed to complete the tasks). However, this particularly weak fourth type was relatively small and contained no (additional) information or insights with reference to the response types (compared with the profiles from the three–type solution). The description of the three–type solution is provided in Table 2.
Descriptive information about the three–type solution from the 2017 data set
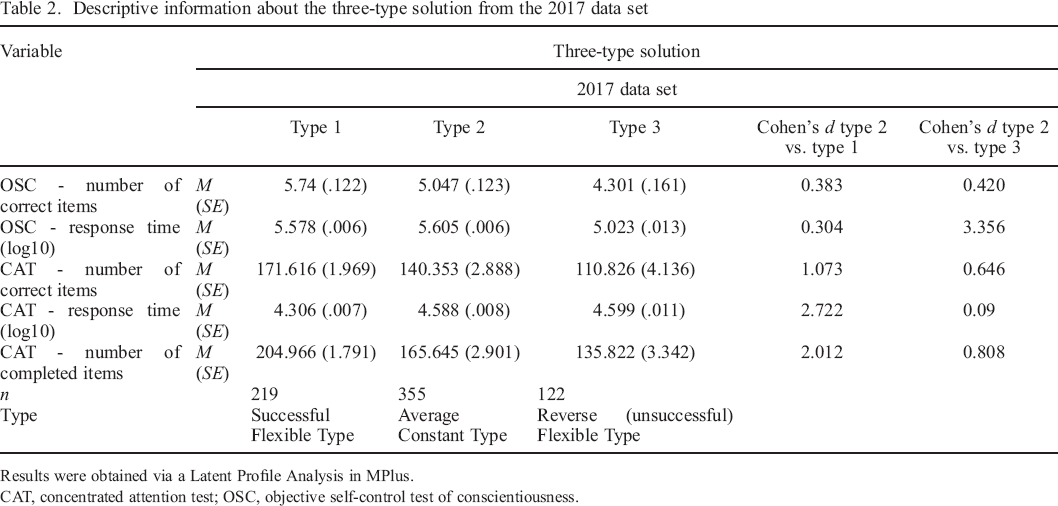
Results were obtained via a Latent Profile Analysis in MPlus.
CAT, concentrated attention test; OSC, objective self–control test of conscientiousness.
In consequence, we selected the three–type solution as the best–fitting model, as it was the most parsimonious solution that provided meaningful and distinct profiles (Figure 3). The first type, identified as ‘Successful Flexibles’, comprised 37.9% (n = 291) of the sample; compared with the test takers of the other types, the members of this type completed most of the CAT items and had the highest numbers of correctly solved CAT and OSC tasks. In addition, they were able to handle the CAT items the fastest under time pressure, whereas they handled the OSC items (without time restrictions) rapidly but were not the fastest (compared with the other types of this three–type solution). Accordingly, it seems that test takers comprising this type were capable of switching between reflective and inhibitive as well as between impulsive and more proactive response strategies in accordance with the demands of the different tasks (time–restricted vs. time–unrestricted). The second, not ideal type, named ‘Unsuccessful or Reversed Flexibles’, included 15.9% (n = 122) of the sample. Individuals assigned to this type were characterized as having completed a comparatively small number of CAT items and having solved fewer CAT and OSC tasks correctly. In contrast to the Successful Flexibles, these individuals invested a relatively large amount of time working on the CAT items despite the limited time available to solve the tasks. Interestingly, this type was comparatively fast on the OSC items even though no restrictive time conditions were set. This type showed that flexibility in using different response strategies might not always be effective, which could be seen in the incorrect selection of a certain response strategy for the wrong task/demand. Finally, the third and largest type, the ‘Average Constant Type’, was composed of 46.2% of the sample (n = 355). Compared with the Successful Flexibles, this type took more time to complete the CAT tasks with fewer correctly solved items, whereas this type needed less time to complete the OSC items but made more mistakes. As the response times between the different tasks did not differ much, these candidates were relatively constant in the way they handled different tasks; whereas they were too slow for the ideal processing of the CAT items, they were too fast for the OSC items. This tendency was reflected in slightly higher error rates in comparison with the Successful Flexibles.
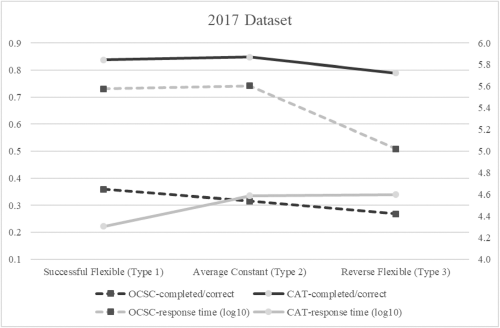
Profiles of the three–type solution from the 2017 data set. The scale on the left side shows the ratio of correctly processed items to the (maximum) number of processed items; the scale on the right side shows the logarithmic response time. CAT, concentrated attention test; OSC, objective self–control test of conscientiousness.
Analyses with reference to Research Aim 2 comprised the associations between the response types and the independent variables of sex, age and school grade. Therefore, individuals’ response type was represented by two dummy variables: The first variable represented the ‘Successful Flexible Type’, and the second variable represented the ‘Unsuccessful/Reverse Flexible Type’, both in reference to the Average Constant Type.
However, only sex and school grade were associated with test takers’ types; when comparing the Average Constant Type with the ‘Reverse Flexible Type’, women were less often represented in the unsuccessful profile than men were (b = −0.09, SE = 0.06, P = .040; 95% CI [0.010, 0.273]). Further, those candidates with lower grades (higher values) on the final school–leaving certificate were more often captured by the Average Constant Type than the Successful Flexible Type (b = − 0.10, SE = 0.02, p = .006; 95% CI [− 0.075, − 0.012]).
With regard to Research Aim 3, we examined whether individuals’ type predicted their performance and whether they were invited into the study programme of their choice. The results indicated that the response types were relevant predictors; individuals from the Reverse Flexible Type showed a poorer performance (b = −0.23, SE = 0.06, P < .001, 95% CI [− 0.546, − 0.308]) on the assessment test and were invited into a study programme less frequently (b = − 0.19, SE = 0.04, P < .001, 95% CI [−0.346, − 0.209]) compared with those from the Average Constant Type. Finally, comparing the Successful Flexible Type and the Average Constant Type revealed a higher probability of being invited into a study programme for the Successful Flexible Type (b = 0.31, SE = 0.04, P < .001, 95% CI [0.249, 0.408]) and they received higher scores on the assessment test (b = 0.26, SE = 0.05, P < .001, 95% CI [0.262, 0.456]). An inspection of the amount of variance explained (R 2 ) by age, grade and sex in the type membership revealed rather small values (between R 2 = 1.0% and R 2 = 1.4%). However, type membership provided a greater contribution to the amount of variance explained in the dependent variables (between R 2 = 21.4% and R 2 = 22.0%; Table 3).
Results for the regressive model from the 2017 data set (three–type solution)
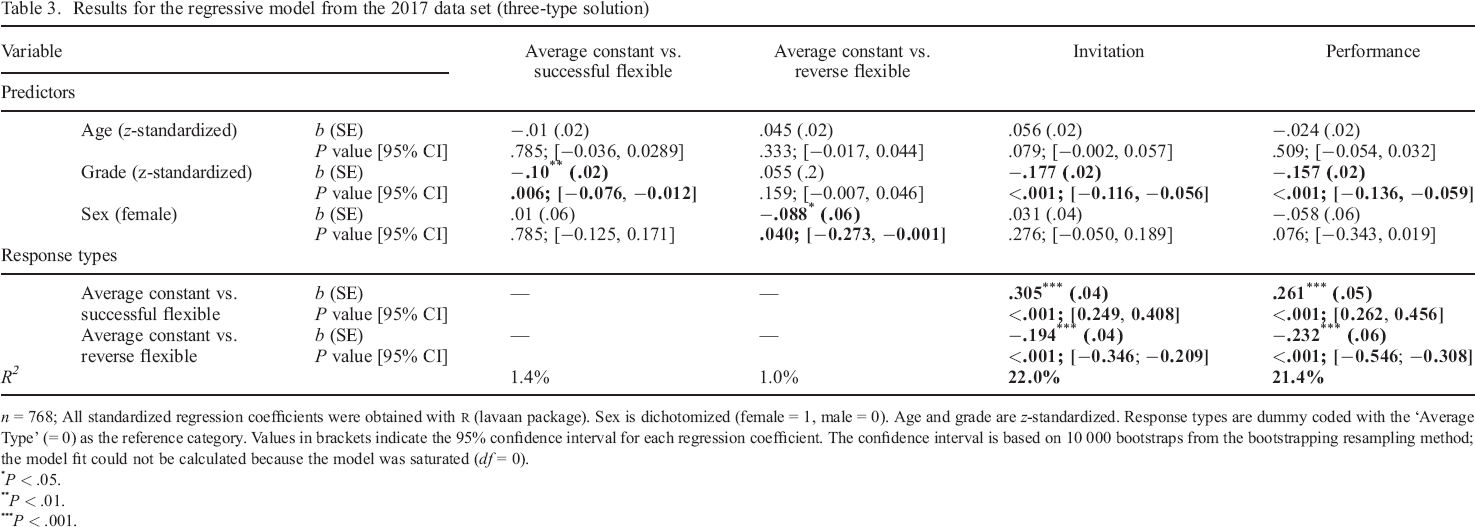
n = 768; All standardized regression coefficients were obtained with r (lavaan package). Sex is dichotomized (female = 1, male = 0). Age and grade are z–standardized. Response types are dummy coded with the ‘Average Type’ (= 0) as the reference category. Values in brackets indicate the 95% confidence interval for each regression coefficient. The confidence interval is based on 10 000 bootstraps from the bootstrapping resampling method; the model fit could not be calculated because the model was saturated (df = 0).
P < .05.
P < .01.
P < .001.
With reference to Research Aim 4, the test of robustness, we specified alternative solutions across two independent data sets. First, we replicated the regression model by integrating the response types for the two–type and four–type solutions based on the 2017 data set (see Tables S5 and S6). Only for the four–type solution were candidates with a better grade on the school–leaving certificate less likely to be assigned to the smallest and weakest groups than to the largest, average group (four–type solution: b = − 0.184, SE = 0.02, P < .001; 95% CI [− 0.121, − 0.060]; Table S6). Further, both solutions showed relationships between candidates’ type membership and whether they received an invitation to a study programme as well as their performance. For the two–type solution, participants who were assigned to the less successful group were less likely to receive an invitation to a study programme (b = − 0.413, SE = 0.04, P < .001; 95% CI [− 0.499, − 0.370]) and less often achieved good results on the performance tests (b = − 0.365, SE = 0.05, p < .001; 95% CI [− 0.580, − 0.405]) than candidates in the average and largest group (Table S5). The same pattern was revealed for the four–class solution: The less successful type (confirmation: b = − 0.261, SE = 0.04, P < .001; 95% CI [− 0.368, −0.205]; performance: b = − 0.159, SE = 0.05, P < .001; 95% CI [− 0.322, − 0.118]) and the least successful type (confirmation: b = − 0.259, SE = 0.04, P < .001; 95% CI [− 0.565, − 0.426]; performance: b = − 0.264, SE = .07, P < .001; 95% CI [− 0.783, −0.502]) were neither very likely to receive an invitation to a study programme nor were they likely to perform well on the test. Further, candidates from the successful group more often received an invitation (b = 0.154, SE = 0.05, P < .001; 95% CI [0.087, 0.288]) and achieved higher scores (b = 0.221, SE = 0.07, P < .001; 95% CI [0.219, 0.474]) than the average type. To sum up, whereas the two–type solution was not able to provide more detailed and differentiating information about the candidates (i.e., it distinguished between only the average and poor response styles) for the 2017 data set, the additional ‘bad’ group from the four–type solution did not provide any further (predictive) information beyond the three–type solution (same correlational structure).
As a second test of robustness, we aimed to replicate the final solution from the 2017 data set by using the independent data set from 2018. In sum, the results from the 2017 data set were replicated in the 2018 data set, and the profile solutions were relatively similar (Table S1, right hand side). Analogous to the 2017 data set, the entropy and the AIC did not reveal a clear solution, as the entropy ranged from .81 to .87, and the AIC value became consistently smaller across the six latent profile solutions. However, the SABIC criterion from the 2018 data had the lowest values for the three–type and four–type profile solutions, and the BLRT showed a significant difference between the model with the two–type and three–type solutions. Again, no differences between the three–type and four–type solutions or any other higher order solution were found. On the basis of these results, we focused on the two–type, three–type and four–type solutions in detail for the 2018 data set (Tables S3 and S4 right hand side and Figure S3). The two–type solution differed only with respect to the CAT indicators (Profile 1: n = 410, Profile 2: n = 335), and the four–type solution reproduced an additionally very small subtype to the types of the three–type solutions (Profile 1: n = 242, Profile 2: n = 53, Profile 3: n = 153, Profile 4: n = 297). Similar to the 2017 results, the three–type solution again appeared to be preferable, including a type of Successful Flexibles (34.4%; n = 256), a smaller group of Unsuccessful or Reversed Flexibles (16.6%; n = 124), as well as an Average Constant Type (48.9%; n = 365, Table S2 for detailed information).
Third, the same regression model was specified and compared across the 2017 and 2018 data sets (Table S7). Obviously, the regression model for the 2018 data was similar to the results for the 2017 model; women were less often assigned to the Reverse Flexible Type than to the Average Constant Type (b = −0.08, SE = 0.03, P = .026; 95% CI [−0.110, −0.007]). Further, those with worse final school grades were less often identified as the Successful Flexible Type (b = −0.09, SE = 0.02, P = .027; 95% CI [−0.071, −0.004]) but more often as the Reverse Flexible Type (b = 0.12, SE = 0.02, P = .003; 95% CI [0.015, 0.071]) when compared with the Average Constant Type. Additionally, older candidates were less often categorized in the Successful Flexible Type than in the Average Type (b = −0.10, SE = 0.02, P = .002; 95% CI [− 0.068, − 0.015]). Individuals in the Reverse Flexible Type showed a poorer performance (b = − 0.19, SE = 0.04, P < .001, 95% CI [− 0.288, − 0.139]) on the assessment tests compared with those classified as the Average Constant Type and received an invitation to a study programme less frequently (b = − 0.14, SE = 0.04, P < .001, 95% CI [− 0.279, −0.129]). Comparing the Successful Flexible Type and the Average Constant Type revealed a higher probability of receiving an invitation to a study programme for the Successful Flexible Type (b = 0.31, SE = 0.04, P < .001, 95% CI [0.279, 0.422]) as well as a higher score on the assessment tests (b = 0.29, SE = 0.03, P = .006, 95% CI [0.196, 0.317]). Inspecting the R2 values again showed a picture that was similar to the one that resulted for the 2017 model: Although the power that the independent variables had for explaining the types was low (between R 2 = 2.3% and R 2 = 3.7%), the value that the types had for explaining the dependent variables was better (between R 2 = 38.7% and R 2 = 20.8%). Finally, when testing for invariance across the 2017 and 2018 regression coefficients, the results indicated that the effect patterns between the two data sets were very similar. All differences between the regression coefficients were not significant (Table S8).
To summarize, there was a great deal of consistency in the response type profiles we identified across the two different data sets of 2017 and 208. Thus, three personality (response) types were identified on the basis of test takers’ (i) OSC and CAT scores and (ii) reaction times on these tasks. The predictive validity of the type assignment revealed comparable results with reference to the criteria: invitation to a study programme and test performance.
Discussion
On the basis of previous findings that identified the expression of conscientiousness in behavioural indicators and recent studies on the facet structure of conscientiousness (Costantini & Perugini, 2016), we employed data sets from two consecutive years from test takers who took an entrance examination for a programme of study, and we investigated whether behaviour on these tasks could be captured by a statistical type approach.
Research–related strengths and contribution
To our knowledge, this study was the first to employ a new perspective by suggesting that two different tasks in the form of achievement tests could be used in combination as behavioural indicators of different aspects of conscientiousness: self–control and industriousness. We further proposed that the combined interpretation of theses scores (number of processed items, number of correctly solved items and response times) would allow us to estimate an individual's trait–like ability to act flexibly when responding to different demands. Whereas the first task required test takers’ reflective behavioural control to successfully solve a task that appeared to be easy because it required them to override the impulse to proceed too fast, the second test called for test takers’ higher cognitive capacities by requiring test takers’ willingness to exert themselves and engage in industrious response behaviour. In contrast to the first task, the second task was expected to get test takers to initiate and persist in goal–directed response behaviours. We therefore suggested that individuals’ combined (response) behaviour on the two tasks would serve as a new, behaviour–based indicator of conscientiousness.
Analyses revealed three types of conscientiousness–related response behaviours or strategies. As expected, one type—the Successful Flexibles—was able to switch (correctly) between a more reflective and a more impulsive response strategy, depending on the task. This ideal type succeeded in working proactively and industriously on the time–restricted tasks and was thus able to show more impulsive response behaviour. For time–unrestricted tasks, this type used the opposite strategy and worked on the items in a more reflective way, thereby showing a more impulse–controlling or inhibitive aspect of personality. Consequently, test takers assigned to this Successful Flexible Type achieved higher scores on the overall performance test and revealed a higher probability of being invited into a programme of study. Unlike this type, the second profile was less successful in the flexible use of different behaviours; individuals of this type showed a more reflective and time–consuming approach to handling time–restricted items on the one hand and more impulsive response behaviour in responding to items without time constraints on the other hand. In summary, individuals of this type showed behaviour that went counter to the task characteristics. Consequently, the error rate across the two task types was quite high, which was reflected by a lower overall test performance and probability of being accepted into a programme. Finally, the largest group consisted of the Average Constant test takers who were characterized by a similarly long response time and high error rates across different tasks. Test takers of this type might not be successful in the sense they did not follow the ideal response strategy. However, across all tests, this behaviour did not provide an optimal fit with each of the tasks but was also not completely inappropriate. It was difficult to predict whether test takers who fit this type would be successful students. Although they performed better on the overall performance test and were more frequently invited into a programme of study than the Unsuccessful Flexibles, more information on criteria for identifying successful university students would be needed in order to make a valid statement.
We propose that this study is characterized by some noteworthy strengths and innovations: these include (i) a new approach in which behavioural indicators were used to identify response types on the basis of test candidates’ conscientiousness–related subfacets, (ii) the use of LPAs, which enabled us to control for measurement error due to the person–related (and not variable–oriented) statistical approach and (iii) the confirmation of the statistical results in two consecutive cohorts of prospective students.
We hope that this new behavioural approach serves as a starting point for enriching the existing literature, which is based primarily on self–estimated or self–evaluated hypothetical behaviour or attitudes. We further propose that thinking beyond single tasks and combining behaviour related to personality throughout the tasks may lead to a more valid approach in the context of aptitude testing. This approach may have the capacity to ring in a new time in personality psychology as well in psychological assessment, leading to a rethinking of models of personality.
Limitations and future research
However, there are some weaknesses in this study that should be addressed. One may question whether we represented the conscientiousness aspect appropriately with the tests we used. We stuck to the narrow definition of subfacets of conscientiousness given by Costantini and Perugini (2016) when we chose the task. Furthermore, this new perspective was conducted in line with the knowledge that scores obtained on achievement tests are always—at least to some extent—confounded with noncognitive skills and characteristics (e.g. Baumert & Demmrich, 2001; Poropat, 2009; Richardson et al., 2012; Trapmann et al., 2007). This led Pawlik (2006) to postulate that the conceptualization of achievement versus personality established in the psychological literature is ‘artificial’.
Second, the question remains whether the solution of different types presented in this study represents different trait–like personality types. With reference to Snow, Corno and Jackson (1996), we speak of a habitual characteristic when test takers show primarily a reflective or impulsive response pattern across different types of tasks. Thus, if individuals are characterized by ‘habitual’ (response) strategies that they show preferentially across different tasks (Snow et al., 1996), why should not the (habitual) flexible change between different response strategies be interpreted as a person or trait–like aspect? Thus, the extent to which individuals’ response styles remain constant or flexible across the test situation and different task conditions may also be interpreted as a habitual or trait–like characteristic.
Third, we employed two cross–sectional data sets from individuals who might be highly selective with respect to candidates’ past (school) performance and willingness to perform in the future. It makes sense to assume that medical school candidates possess specific cognitive and noncognitive characteristics. Future studies may expand our analyses to include more diverse samples or entrance test data for other subjects (e.g. pedagogy).
Fourth, it would be desirable to observe the same individuals in longitudinal studies (e.g. throughout the course of the programme of study) with more than one–time point. This is particularly important given the fact that there might be some discrepancy between cross–sectional and longitudinal results, for example, with respect to the predictive validity of the identified three–type solution on candidates’ (later) satisfaction with the programme of study or the successful completion of the programme.
Fifth, profile analyses have several strengths such as the latent modelling approach but also have some limitations. For example, the identification of the best fitting number of types with quantitative criteria is limited in this approach, and a subjective interpretation is unavoidable. So far, there is no appropriate indicator of absolute model fit that would enable a strictly confirmatory approach to LPA (Specht et al., 2014, p. 33). Nevertheless, although we employed an exploratory approach to identify the most adequate response type solution and rather descriptive indices to evaluate the fit of the models, we replicated the results in an independent data set. Certainly, as Funder et al. (2013) stated, the findings might still be tentative and need to be replicated by independent analysts (Specht et al., 2014). Thus, one may criticize the typological approach employed here as a method of reducing valuable information. For example, the profile of a single individual might not fit a type completely even though this person was assigned to it. However, the cut–off values for group assignment—at least for our purposes—were based only on empirical results.
Sixth, the data used here were based on behavioural indicators as well as on test taker’ performance scores. Although one could argue that the indicators we employed here demonstrate content validity because the observed behaviour could be interpreted as the criterion (Schmitt et al., 2015), future studies should use criteria that are independent of the test situation (e.g. failing/passing exams, grades and dropping out) in order to estimate the measures’ predictive validity. Furthermore, and although for some domains, only low or no relations were revealed for the data obtained from different measurement approaches (e.g. OPT and self–report) that were aimed at assessing the same or similar constructs, future studies should combine different approaches in order to also estimate the incremental value of the new indicators.
Finally, in contrast to dimensional approaches or practice–oriented reporting strategies (e.g. the Myers Briggs’ Type Indicator), we do not propose that our solution for the types is meaningful for practice. Taking into consideration that tests are used to make relevant and often life–changing decisions, we do not claim that the complexity of personality should be reduced to a small number of types. We propose this solution as work in the service of basic research in order to stimulate the use of behavioural data in personality research. Additional research is needed to capture and investigate more complex personality characteristics and to explore the implications of the resulting profiles.
In the future, we would like to encourage scientists to employ behaviour–based methods in network analyses in order to check whether the framework proposed by Costantini and Perugini (2016) can be generalized across behavioural and possibly indirect indicators or whether new networks arise from a multimethological view. Further, multimethod approaches (e.g. including observer reports, self–reports and behavioural observation methods; Koch, Schultze, Eid, & Geiser, 2014) would further provide a valuable strategy based on which the convergent validity of the three response types can be examined across different assessment methods.
General conclusion
Big Data may serve as a starting point from which to investigate the value of individuals’ behavioural indicators in combination for personality research. Big Data is real–time information about individuals, collected in a variety of formats. Response times and click behaviour seem to be ‘obvious’ indicators to calculate. However, more behavioural indicators in the test (time spent typing text, correction clicks and movements of the computer mouse/touchpad), but also indicators of the computer–based environment (type of computer, leaving the test page), could possibly serve as indicators for predispositions. However, currently, a personality theory or basic research addressing such Big Data information is missing. Therefore, we chose an interplay of theory–based ideas and an empirical procedure (for a detailed description, see Kroehne & Goldhammer, 2018; Stadler, Fischer, & Greiff, 2019). This work aimed to define trait–related typical ‘real–world’ behaviour in the test situation and may therefore serve as a starting point for further research. The huge amount of data and the enormous variety of behaviours recorded in these data offer researchers in psychology the opportunity to conduct what Chen and Wojcik (2016) describes as quantitative computer–related field research. In order to generalize our results across cultures, we further suggest, for example, that researchers examine similar data in cultures other than Western European in order to study the cross–cultural consistency of the patterns and the significance of the conscientiousness–related personality types we identified. We furthermore encourage researchers in the field to increase knowledge on personality beyond self–estimations, memories, self–reports and test takers’ imaginations, and go back on the real data and behavioural traces available that has been ignored for the last decades. Big Data gives us the possibility to observe and record almost natural behaviour in specific situations and the amount of data generated and collected should allow to capture a wide variety of human behaviour and at a deep granularity. This available but so far rarely used data, which accompanies us like a ‘shadow’ with the technologies available to us, may enrich or even change how we define and measure certain personality aspects in the future.
Acknowledgements
We thank Jane Zagorski for her efforts in editing the manuscript. Further, we thank Sandra Augart and Sebastian Auer for help with data collection and Alexandra Schoor and Julian Fuchs for data entry.
Supporting Information
Supporting Information, per2296-sup-0001 - Personality in Action: Assessing Personality to Identify an ‘Ideal’ Conscientious Response Type with Two Different Behavioural Tasks
Table S1. Comparison of Models with a Different Number of Personality Types for the 2017 and 2018 Datasets
Table S2. Descriptive Information about the Three-Type Solution from the 2018 Dataset
Table S3. Descriptive Information about the Two-Type Solution from the 2017 and 2018 Datasets
Table S4. Descriptive Information about the Four-Type Solution from the 2017 and 2018 Datasets
Table S5. Results for the Regression Model for the Two-Type Solution from the 2017 Dataset
Table S6. Results for the Regression Model for the Four-Type Solution from the 2017 Dataset
Table S7. Results for the Regression Model for the Three-Type Solution from the 2018 Dataset
Table S8. Difference Test for the Regression Models from the 2017 Data Set versus the 2018 Dataset
Figure S1. Example item from the OSC.
Figure S2. Example item from the CAT.
Figure S3. Profiles from the three-type solution from the 2018 dataset. The scale on the left side shows the ratio of correctly processed items to the (maximum) number of processed items; the scale on the right side shows the logarithmic response time; OSC = objective self-control test of conscientiousness; CAT = concentrated attention test.
Supporting Information, per2296-sup-0001 for Personality in Action: Assessing Personality to Identify an ‘Ideal’ Conscientious Response Type with Two Different Behavioural Tasks by GABRIELA GNIEWOSZ, TUULIA M. ORTNER and THOMAS SCHERNDL, in European Journal of Personality
Table S1. Comparison of Models with a Different Number of Personality Types for the 2017 and 2018 Datasets
Table S2. Descriptive Information about the Three-Type Solution from the 2018 Dataset
Table S3. Descriptive Information about the Two-Type Solution from the 2017 and 2018 Datasets
Table S4. Descriptive Information about the Four-Type Solution from the 2017 and 2018 Datasets
Table S5. Results for the Regression Model for the Two-Type Solution from the 2017 Dataset
Table S6. Results for the Regression Model for the Four-Type Solution from the 2017 Dataset
Table S7. Results for the Regression Model for the Three-Type Solution from the 2018 Dataset
Table S8. Difference Test for the Regression Models from the 2017 Data Set versus the 2018 Dataset
Figure S1. Example item from the OSC.
Figure S2. Example item from the CAT.
Figure S3. Profiles from the three-type solution from the 2018 dataset. The scale on the left side shows the ratio of correctly processed items to the (maximum) number of processed items; the scale on the right side shows the logarithmic response time; OSC = objective self-control test of conscientiousness; CAT = concentrated attention test.
Footnotes
Supporting Information
Additional supporting information may be found online in the Supporting Information section at the end of the article.