
Abstract
This study explored the validity of person judgements by targets and their acquaintances (‘informants’) in longitudinally predicting a broad range of psychologically meaningful life experiences. Judgements were gathered from four sources (targets, N = 189; and three types of informants, N = 1352), and their relative predictive validity was compared for three types of judgement: direct predictions of future life experiences (e.g. number of new friendships), broad (Big Five) domains (e.g. extraversion), and narrower personality nuances (e.g. sociable). Approximately 1 year later, the targets’ actual life experiences were retrospectively assessed by the targets, and by informants nominated by the targets (TNI). Overall, we found evidence for predictive validity across predictor sources and types. Direct predictions by targets were by far the most valid, followed by TNI. Personality–based predictions by targets and TNI had substantial but lower validity. Domain–based predictions were less valid than nuance–based predictions. Overall, informants with lower ‘liking’ and ‘knowing’ towards targets made less valid predictions. Person–centred multilevel analyses showed both considerable validity of direct predictions (which increased with knowing) and positivity bias (which increased with liking). Taken together, given the relatively high methodological rigour of the study, these results provide an especially realistic picture of the rather moderate predictive power of person judgements regarding future life experiences and corroborate the common practice of obtaining such judgements from targets and their close acquaintances. © 2020 The Authors. European Journal of Personality published by John Wiley & Sons Ltd on behalf of European Association of Personality Psychology
A core assumption in personality research is that people judge their own and others’ personalities in order to ultimately predict the respective target persons’ future behaviour, experiences, and life course. For example, when judging a person as ‘industrious’, one implies that the target person may be counted on to invest effort and diligence into tasks and is likely to deliver satisfactory results. In contrast, when judging a person as ‘impulsive’, one implies that the person may have a hard time controlling themselves, which may lead to all sorts of undesirable future life experiences (e.g. speeding tickets and arrests). In the present study, we investigate to what extent such personality judgements (both on the level of Big Five domains and on the level of personality ‘nuances’) enable valid predictions of actual future life experiences (e.g. number of new friendships). We compare this predictive validity to that of ‘direct’ predictions of the same life experiences (e.g. the expected number of new friendships). In addition, we examine whose judgements are most valid: do the targets know best what to expect from their own future? Or are other people who know the targets (‘informants’) able to make better predictions? Finally, we ask how the respective perceivers’ relationship with their target persons—in terms of how well they know and how much they like the target—influences the validity of the perceivers’ judgements. To answer all of these questions, we ask targets to judge their own personality and to make direct predictions regarding important experiences in the next year of their lives. We also ask different types of informants to do the same for the targets. Approximately 1 year later, we then compare all of these judgements with retrospective reports of the experiences that actually took place in the targets’ lives since the first judgements were provided.
What are relevant consequences of personality?
There is vast body of literature examining how personality is associated with—or predictive of—all sorts of variables. For example, studies show that personality predicts academic achievement and job performance (Connelly & Ones, 2010; Lüdtke, Roberts, Trautwein, & Nagy, 2011; Ozer & Benet–Martínez, 2006; Paunonen & Ashton, 2013; Poropat, 2014; Roberts, Kuncel, Shiner, Caspi, & Goldberg, 2007), various aspects of social relationships (Back, 2015), subjective well–being (Little, 2015; McCrae & Costa, 1991), and mortality (Jokela et al., 2019; Roberts et al., 2007; Turiano, Chapman, Gruenewald, & Mroczek, 2015), to name just a few.
In the present study, we examine the validity of direct and personality–based predictions with regard to a large variety of life experiences. Our list of relevant life experiences is based on—and thus overlaps considerably with—previous research in the field (e.g. Hammen, 1991, 2005; Sarason, Johnson, & Siegel, 1978; Vaidya, Gray, Haig, & Watson, 2002; Wessels, Zimmermann, & Leising, 2016). We focus on experiences that are (i) most relevant for our student population and time frame of 1 year and (ii) relatively ‘factual’ in nature (i.e. assessing them requires little inference or interpretation). Consistent with most previous research, in addition to variables that may be considered ‘outcomes’ or ‘consequences’ in the strictest sense (e.g. having a child) (Wessels et al., 2016), we also assess many more variables that may better be called ‘responses’ or ‘behaviours’ (e.g. smoking) but are still very useful as they may be viewed as easily available proxy measures of outcomes that are important but much harder to assess (e.g. actual health risks). Therefore, instead of ‘consequences’ or ‘outcomes’, we use the somewhat broader term ‘life experiences’ here (Sarason et al., 1978; Vaidya et al., 2002). To provide some measure of order for the large number of life experiences that we investigate, we classify them in accordance with three broad life domains suggested by Ozer and Benet–Martínez (2006): individual, interpersonal, and social/institutional.
Direct versus personality–based predictions
We assess the predictive validity of two different kinds of person judgements: (i) direct predictions, in which perceivers try to explicitly judge the likelihood that certain life experiences will occur in a target's life within the next year, and (ii) personality judgments, with no explicit link to any particular future life experience. As for personality judgements, we compare judgements on different levels of abstractness: (i) broader ones, on the level of Big Five domains (i.e. ‘domain–based predictions’), and (ii) narrower ones, on the level of personality items representing markers of personality ‘nuances’ (i.e. ‘nuance–based predictions’) (McCrae, 2015; Mõttus, Kandler, Bleidorn, Riemann, & McCrae, 2017). Big Five domains have repeatedly been shown to predict actual behaviour (e.g. Back, Schmukle, & Egloff, 2009) and rather specific future life outcomes (e.g. Ozer & Benet–Martínez, 2006; Roberts et al., 2007; Soto, 2019). Interestingly, more recent research on personality nuances (Mõttus et al., 2017; Mõttus et al., 2019; Mõttus, Bates, Condon, Mroczek, & Revelle, 2019; Seeboth, Mõttus, & Kandler, 2018) has shown that item–level personality judgements seem to have considerable (incremental) predictive power over Big Five personality judgements in predictions of diverse life outcomes (Mõttus, Bates, et al., 2019; Seeboth et al., 2018). In comparing these different kinds of predictions with one another, one needs to consider the so–called bandwidth–fidelity trade–off (Cronbach & Gleser, 1957). The term denotes the inevitable trade–off between broadness and validity in person judgements: broader person judgements (e.g. of Extraversion or Agreeableness) are likely to predict a whole range of future life experiences, but the predictive validity for each individual life experience will not be particularly high. In contrast, more specific predictions may be higher in validity, but the downside of such predictions tends to be that they are much more limited in scope. In the present study, we compare the predictive validity of broader and narrower personality judgements regarding specific life experiences with the validity of direct predictions of the same life experiences. Given that the match in bandwidth is perfect in the latter case, the validity estimates obtained this way may function as a kind of benchmark.
Longitudinal predictions using different data sources
In their literature review of some of the more recent literature investigating the consequences of personality, Wessels et al. (2016) identified several problematic features of typical studies in this field. First, only a relatively small number of studies actually used longitudinal designs, which would be necessary to draw somewhat firmer conclusions regarding the direction of effects. In the present study, we do predict the targets’ future life experiences longitudinally, over the course of approximately 1 year. Second, in the vast majority of previous studies, the personality variables that were used as predictors and the life experiences that were to be predicted, were assessed by the same source (usually the targets themselves). This may be problematic for various reasons. For example, in single–source studies, ‘shared method effects’ (Campbell & Fiske, 1959; Podsakoff, MacKenzie, & Podsakoff, 2012) may be misinterpreted as systematic associations between personality and life experiences. One such type of shared method effect may be due to the perceivers’ formal response styles, such as their differential tendencies to consistently prefer a certain location (e.g. a value in the middle) over others on the available response continuum (Wetzel, Lüdtke, Zettler, & Böhnke, 2016). Another shared method effect may be due to the perceivers’ evaluative attitudes towards the targets, making some perceivers consistently describe their targets in more positive terms than others (Anusic, Schimmack, Pinkus, & Lockwood, 2009; Leising, Erbs, & Fritz, 2010; Leising, Scherbaum, Locke, & Zimmermann, 2015). Each of these effects by itself would be sufficient to create correlations between measures that would have to be disentangled from the actual ‘substantive’ correlations of interest. In the present study, we therefore do not only ask the target persons to describe themselves but also have them recruit a number of so–called informants who know them well enough to describe them, make predictions regarding their future life experiences, and retrospectively report on those experiences later on.
Of course, the present study is not the first to use informant ratings as an additional source of information besides the targets’ self–ratings (e.g. Connelly & Ones, 2010; Poropat, 2014; Vazire, 2006). There are many reasons to suspect that informant ratings may have some incremental validity (Vazire, 2010): for example, the visual perspective of others (as compared with the targets') may be advantageous for making judgements of highly visible traits (e.g. of emotional expressivity). Also, the targets may be distracted by their own inner experiences when tasked with forming generalized judgements of their own behavioural inclinations. On the other hand, the targets have ‘privileged access’ to certain types of information about themselves (especially their own preferences, thoughts, interests, and so on) and may thus be likely to provide the most valid judgements regarding their own more internal traits. Research has shown that personality ratings obtained from informants can be as valid or even more valid than targets’ self–ratings (e.g. Connelly & Ones, 2010; Poropat, 2014; Vazire, 2010; Vazire & Mehl, 2008), including longitudinal predictions of behaviours (e.g. Connelly & Ones, 2010; Thielmann, Zimmermann, Leising, & Hilbig, 2017) and outcomes (e.g. Jackson, Connolly, Garrison, Leveille, & Connolly, 2015; Luan et al., 2019).
In most previous studies, however, informants were recruited by the targets themselves. Such informants will hereafter be called ‘target–nominated informants’ (TNI; Leising et al., 2010). Research has shown that TNI tend to be people who are very close to the targets (e.g. spouses and friends). This may pose advantages as well as disadvantages in terms of data quality: on the positive side, close acquaintances may be expected to know the targets best, given that they (i) probably spend more time with them than most other people do, (ii) may have more opportunities to learn about the targets’ inner experiences (e.g. by talking to them), and (iii) may be able to observe the targets’ behaviour in more private situations. In fact, a large body of empirical evidence suggests that such acquaintance does promote the validity of person judgements (e.g. Bernieri, Zuckerman, Koestner, & Rosenthal, 1994; Biesanz & Human, 2010; Biesanz, West, & Millevoi, 2007; Blackman & Funder, 1998; Borkenau, Mauer, Riemann, Spinath, & Angleitner, 2004; Connelly & Ones, 2010; Funder & Colvin, 1988; Letzring, Wells, & Funder, 2006; Paunonen, 1989). In the present study, we also expect to find evidence for such an effect. In addition to this likely advantage of personality ratings by TNIs, such ratings can also be obtained with relative ease (Vazire, 2006), which is probably one of the main reasons why using this kind of data has become relatively common.
However, research has also shown that TNI tend to like their targets very much (Leising et al., 2010) and that they often produce descriptions of their targets that are even more positive than the targets’ self–descriptions (Leising, Gallrein, & Dufner, 2014). Although validity and bias are not necessarily related to one another (West & Kenny, 2011), it may be asked whether such extremely positive attitudes can be detrimental to the validity of judgements. Some evidence for this was uncovered in previous studies (e.g. Wessels, Zimmermann, Biesanz, & Leising, 2020). Such an effect seems possible for various reasons: for example, perceivers who like their targets may be aware of their targets’ more negative characteristics but simply not report them out of loyalty. Another reason is that these perceivers may manage to systematically overlook the more negative aspects of their targets’ personalities, which would also result in overly positive images of the targets that lack validity, despite the perceivers actually believing in them (e.g. Sackeim & Gur, 1978, 1979). In the present study, we investigate this issue by examining the relative predictive validity of judgements that are provided by different types of informants whose relationships with the targets are characterized by varying degrees of closeness. More precisely, in addition to TNI, we recruit a number of informants per target (with the targets’ explicit consent) who are not nominated by the targets themselves. As these latter informants are recruited from groups to which the targets also belong (e.g. university seminars), we will hereafter call them ‘group informants’ (‘GI’). Based on what the GI say about how much they like the targets they judge, we assigned them to one of two subgroups: the ‘high–liking GI’ (‘GI+’) and the ‘low–liking GI (‘GI–’).
The present study
After briefly addressing the issue of interrater agreement in judgements of life experiences (which, according to our knowledge, has not been investigated before), we present two sets of analyses addressing our main research questions. The first set of analyses we present is variable centred. It addresses the question of how strong the validity of predictions of the targets’ life experiences is overall and how it varies across predictor types (domain based, nuance based, and direct) and across predictor sources (targets, TNI, GI+, and GI−). The second set of analyses we present is person centred. It addresses the question of how validity and positivity bias in direct predictions of life experiences vary with how well a perceiver knows a target and how much a perceiver likes a target. 1
As design and analyses presented in the present paper are fairly complex, we give an overview of terminology in the Supplemental Note S1 in order to make the presentation as unambiguous and easy to follow as possible.
Methods
The present study uses unique longitudinal data on psychologically meaningful life experiences, which have not been published before. They are part of a larger dataset with Wave 2 personality ratings previously utilized as part of Study 2 in Wessels et al. (2020). Before consenting to participate, participants were fully informed about purpose and procedures of the study. No experimental manipulation took place, and there was no risk involved of being harmed. The German Research Foundation granted the study without an additional ethics review (grant no. LE 2151 / 5–1). In total, there were four waves of assessment. In the present study, we focus on Waves 1–3, and we report only those measures that are relevant to the research questions that we laid out above. The data are publicly available on the Open Science Framework (https://osf.io/35mej/). A complete list of all variables that were assessed may be obtained from the first author upon request. We report all measures relevant to the research questions that are addressed in the present study. We also report how we determined our sample size, and when and why we excluded which data from analyses.
Recruitment
Participants were recruited in pre–existing groups of students, namely, seminars and student councils from different faculties at two German universities. We did not perform a specific a priori power analysis to estimate the sample size needed for the (complex) statistical models used in the present study. However, as a very rough approximation, we originally aimed for 350 targets in order to be able to statistically corroborate an effect size of r = .15 for a simple correlation between two variables with α (two–tailed) = .05 and 1 − β = .80. Recruitment turned out to be more difficult and time–consuming than anticipated, however, so we (i) decided to adapt our remuneration strategy to make participation more attractive and (ii) had to stop recruiting participants before reaching the originally planned sample size as resources were exhausted. A group of subjects was eligible for the study when a minimum of six persons were willing to participate, which was true for 355 groups comprising 3575 students altogether. Group size ranged between 6 and 22.
Wave 1
Procedure and sample
The purpose of the first round of assessments was to recruit target persons and informants, with the latter knowing the targets but not being selected by them. Members of eligible groups were sent a link and a personalized code which allowed them to access a round–robin online questionnaire in which participants were asked to report how much they liked and how well they knew each of the other group members. The personalized codes were established to match data from the different assessment waves and to identify members of the same group. This first questionnaire was completed by 2801 participants, constituting a response rate of 78%. While initially participants were not compensated for completing the first questionnaire, participants who were recruited later received 5 € for their participation, in order to make participation more attractive.
On the basis of the data from this questionnaire, we determined one target and up to six GI for each group. This was done using an algorithm aiming at maximizing the range of liking and knowing that the informants had towards the targets. Participants qualified as potential targets when there were at least two others in their group who reported not liking them too much (GI−; mean liking ≤ 3.5 on a 1–5 rating scale) and two more others who reported liking them (GI+; mean liking > 3.5) (Wessels et al., 2020). Seventy–seven groups were excluded because no suitable target could be identified using this algorithm. Overall, the procedure led to the inclusion of 278 groups whose members were asked to complete the second online questionnaire (refer to Wave 2).
Measures
Initial recognition
Participants were presented with each of the other group members’ full names and asked whether they knew who the respective person was (yes/no).
Liking and knowing
For any group member that participants said they knew, we asked them to report how much they liked that person and how well they knew that person using two scales with four items each. For both scales (knowing and liking), two items had a negative valence and two had a positive valence. Internal consistencies were high (refer to Supplemental Table S2). We calculated liking and knowing means by rescaling the two negative items on each scale and then averaging the reported values on all four items. The response options ranged from 1 (does not apply at all) to 5 (applies exactly).
Wave 2
Procedure and sample
The second online questionnaire followed shortly after the first one. Its purpose was to collect target and informant ratings of the targets’ personalities, baseline measures for some of the life experience variables, and explicit expectations by all perceivers as to what behaviours and life events they would expect to occur in the targets’ lives in the course of the next year. It is important to note that, for practical reasons, for many life experiences, we assessed behavioural proxies rather than actual outcomes in the strictest sense (Wessels et al., 2016). For example, we assessed the number of cigarettes smoked as a proxy for negative consequences that are associated with smoking but do not necessarily occur within 1 year (e.g. lung cancer). The questionnaire was administered in a one–with–many fashion (Kenny, Kashy, & Cook, 2006), that is, all members of each group (including the target) judged the same person (the target). In addition, the targets were asked to provide email addresses of up to three more informants (TNIs) who had agreed to also judge them. This way, we obtained more typical informant ratings in addition to the earlier–described group informant ratings, giving us the opportunity to compare the predictive validity of judgements by the different types of informants with one another.
For statistical analyses, we included those groups in which at least one target and at least two GI had completed this second online questionnaire (the maximum number of GI per target was six). Out of the 278 groups whom we had asked to participate in this phase of the study, 189 ultimately met the requirements: the sample at this stage of the study thus consisted of 189 targets (female = 124; age, M = 22.49, SD = 3.48); 158 targets had recruited at least one TNI who completed the second questionnaire, resulting in a total of 409 TNI (female = 264; age, M = 30.01, SD = 13.17; range, 1–3; 2.59 per target who had nominated at least one informant). Overall, there were 943 GI (female = 643; age, M = 22.62, SD = 3.16) with an average of 4.99 GI per target (range, 2–6). Out of these, 534 informants reported low–average–liking levels, and 409 informants reported high–liking levels towards the target (cut–off, 3.5). GI with high–liking and low–liking levels did not differ with regard to education, χ2(6, N = 943), p = .33, age, t(941) = −1.11, p = .27, and gender, p = .72 (Fisher's exact test).
As for remuneration, targets initially received 20 €, and GI entered a lottery with 500 prizes of 20 € each. However, when it became increasingly difficult to recruit participants, we decided to adapt the remuneration scheme in order to make participation more attractive. Now, all GI and targets received 10 € for completing the second online questionnaire, and targets received another 10 € when providing contact details of potential TNI who had agreed to participate. As an additional incentive, all participants in Wave 2 also entered a lottery in which they could win prizes of 1000 € (1 prize) or 500 € (2 prizes).
Measures
Liking and knowing
As in Wave 1, we assessed the informants’ liking and knowing towards the target with four items each (e.g. ‘I do not like this person’, refer to Supplemental Table S2 in our OSF project) and computed mean values across the four items, respectively, with very high internal consistencies for both the liking (ICC [2, 4] = .89) and the knowing (ICC [2, 4] = .93) scale (Wessels et al., 2020). Response scales ranged from 1 (does not apply at all) to 5 (applies exactly). Across the different informant groups, the two variables were positively associated with one another, r(1352) = .62, p < .01, 95% CI [0.59, 0.65] (Wessels et al., 2020). As expected, the three informant groups differed with regard to their average liking and knowing levels towards the targets (refer to Table 1): GI− reported significantly lower liking (tWelch(904.64) = −45.35, p < .001, Δ = −1.50, 95% CI [−1.56, −1.43], d = 2.89) than did GI+ and also significantly lower knowing (tWelch(804.14) = −10.49, p < .001, Δ = −0.63, 95% CI [−0.75, −0.51], d = 0.70). In addition, GI+ reported significantly lower liking (tWelch(798.71) = −12.90, p < .001, Δ = −0.41, 95% CI [−0.46, −0.35], d = 0.97) and knowing (tWelch(620.16) = −27.70, p < .001, Δ = −1.51, 95% CI [−1.61, −1.40], d = 1.94) than did TNI. In the following analyses, we report liking and knowing values from Wave 2.
Means and standard deviations for liking and knowing in different informant groups
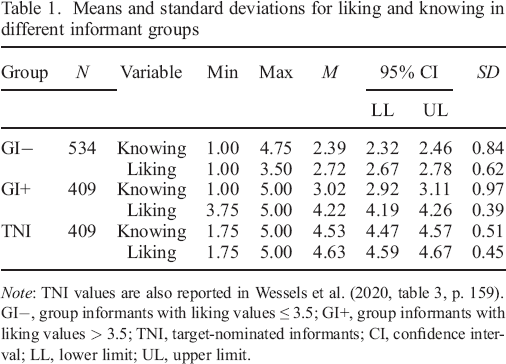
Note: TNI values are also reported in Wessels et al. (2020, table 3, p. 159).
GI−, group informants with liking values ≤ 3.5; GI+, group informants with liking values > 3.5; TNI, target–nominated informants; CI, confidence interval; LL, lower limit; UL, upper limit.
Predicted life experiences
We compiled a list of 73 items to assess direct predictions of the targets’ (future) life experiences (refer to Supplemental Table S3). 2 On the basis of existing lists of life events (Lüdtke et al., 2011; Sarason et al., 1978; Vaidya et al., 2002), we selected events that were most relevant to our student participant population and to the given time frame of 1 year (e.g. ‘What do you expect: Within the next year, how many new romantic relationships are you going to have that will last at least one month?’). In addition, we also included various items covering behaviours and experiences that tend to occur on more regular bases (e.g. drinking alcohol). Items were to be answered on different response scales: some were dichotomous (yes/no) and some were in open format (e.g. ‘__ days a week’). We asked all participants (targets, GI, and TNI) to make predictions regarding the respective target's life in the course of the next year, using these items. The items were slightly reformulated to adapt them to the different perspectives (self–reports and informant reports).
Note that we retrospectively assessed a number of additional life experiences at T3, for which we had not collected direct predictions at T2. These are therefore not part of the present study.
However, as the extent to which the different informants knew the targets was very diverse (due to our study design) with low–liking GI in particular tending to not know the targets very well, we applied a special technique to allow all informants to make valid predictions for life experiences that were conditional upon a baseline. For these life experiences, we provided all informants (GI and TNI) with the different possible baseline scenarios and asked them to make predictions on the basis of each of those scenarios, independent of whether they knew about the target's current situation (e.g. ‘Imagine this person is currently in a relationship. What do you expect: In one year, will this person still be in the same relationship?’ and ‘Imagine this person is currently single. What do you expect: In one year, will this person still be single?’). For our statistical analyses, we then selected those informant predictions that were in line with the actual baseline as reported by the target.
Personality ratings
We assessed the Big Five personality traits with 30 adjectives compiled by Borkenau and Ostendorf (1998). Each factor is covered by six adjectives (e.g. ‘witty’), of which three have a positive valence and three have a negative valence. Targets’ self–ratings and informant ratings were assessed with the same set of items The response scale ranged from 1 (does not apply at all) to 5 (applies exactly). The values for each of the Big Five personality traits were computed as means across the six items, after rescaling the three items with a negative valence. Internal consistencies of the five scales were high both per predictor source and across predictor sources (refer to Supplemental Table S4 for more details), with an overall Mdn α = .77 for Agreeableness, Mdn α = .78 for Conscientiousness, Mdn α = .85 for Extraversion, Mdn α = .76 for Emotional Stability, and Mdn α = .73 for Openness. The Big Five scale scores (domains) and the 30 individual adjectives (nuances) were used for personality–based predictions of the targets’ future life experiences.
Wave 3
Procedure and sample
As had been clearly stated from the beginning, approximately 1 year later, targets and TNI were contacted again via email, provided with their personal codes again, and invited to log in to another online questionnaire. The Wave 3 questionnaire assessed retrospectively whether or how often all of the specific life experiences had occurred in a target's life in the course of the last year. On average, the interval between the Wave 2 and Wave 3 assessments was 369.91 days for targets (SD = 11.97) and 354.90 days for TNIs (SD = 25.87).
The Wave 3 questionnaire was originally completed by 155 targets, who received another 25 € for their participation, and by 345 TNI. We excluded informants from statistical analyses when more than three TNI per target completed the questionnaire, which was true in two cases. One group with only one TNI was excluded because of failure to meet Wave 2 inclusion criteria. We therefore included the data of 155 targets (response rate, 82%; female = 103; age, M = 23.46, SD = 3.47) and 342 TNI (response rate, 84%; female = 224; age, M = 31.55, SD = 13.36) in statistical analyses involving Wave 3 data. These partcipants came from 162 different groups. More specifically, there were 144 groups with both target ratings and 1–3 TNI ratings, 12 groups with only target ratings, and six groups with only TNI ratings. Of the 342 TNI, 330 had also participated in Wave 2, while there were 12 TNI who only completed the Wave 3 questionnaire. Therefore, participant numbers may still vary slightly depending on the analysis at hand.
We examined possible differences between participants who participated in Wave 3 and those who did not with two separate multiple logistic regressions. In the model predicting target (T) dropouts, we included gender, age, education, and self–reported Big Five traits. In the model predicting TNI dropouts, we included gender, age, and education, as well their liking and knowing towards the targets. Overall, there were basically no differences between participants who completed the Wave 3 questionnaire and participants who did not. Neither gender (T, OR = 0.65, p = .37; TNI, OR = 0.84, p = .51) nor education (T, OR = 0.94, p = .84; TNI, OR = 1.13, p = .18) significantly predicted dropouts in Wave 3. There were slightly higher odds for older TNI to participate in Wave 3 as opposed to younger TNI (OR = 1.02, p < .05), while there were no significant age differences for targets (T, OR = 0.99, p = .81). For targets, there were no significant differences in terms of self–reported Big Five traits (Agreeableness, OR = 0.66, p = .25; Conscientiousness, OR = 1.91, p = .12; Extraversion, OR = 0.82, p = .48; Emotional Stability, OR = 1.27, p = .39; Openness, OR = 1.01, p = .98). For TNI, there were no significant differences with regard to Wave 2 liking (OR = 0.90, p = .74) or knowing (OR = 1.20, p = .49) regarding the targets.
Measures
Actual life experiences
The list of 73 life experience items was now used by the targets (target–rated actual life experiences, AEX_t) and the TNI (TNI–rated actual life experiences, AEX_tni) to retrospectively assess the actual levels of each of the life experience variables. For this, the items were adapted in terms of tense (e.g. ‘Last year, how many exams did you pass?’). TNI were provided with an alternative response option in case they felt unable to answer a question properly (‘I do not know’). These responses were treated as missing values in the analyses.
The 73 life experience items had different (e.g., numeric) response formats. We dichotomized all non–dichotomous variables, for mainly two reasons: first and most important, we wanted to make analyses directly comparable with each other, as our main aim was not to show individual effects for specific life experiences but rather to explore the ‘big picture’. Almost all of the non–dichotomous variables were also extremely skewed, leading to convergence problems in many analyses. Second, the dichotomization enables multilevel profile analyses across many life experiences at once (refer to succeeding discussions).
After an initial exclusion of extreme value outliers (e.g. 88 900 pregnancies during the last year) and outliers on the basis of logical reasoning (e.g. more than 7 days per week of feeling hurt) , we dichotomized the respective variables by recoding them into 0 representing ‘no’ (=0) and 1 representing ‘yes’ (> 0), where a meaningful 0 was present. In the course of this procedure, we excluded 19 life experiences where the value zero was implausible (e.g. body weight), four life experiences due to constant values (e.g. number of days spent in prison), and three life experiences with extremely restricted variability for target ratings, TNI ratings, or both (e.g. number of abortions) (refer to Supplemental Table S3 in our OSF project for more details as to which life experiences were excluded for what reasons). The analyses reported below are thus based on 47 dichotomous life experience variables (Table 2). The biserial correlations between the original and the respective dichotomous variables were high, with a median of rMdn = .92 for direct predictions of life experiences (range, .48 to 1), rMdn = .98 for target–rated actual life experiences (range, .45 to 1), and rMdn = 1 for TNI–rated actual life experiences (range, .46 to 1) (Table 2).
Means of dichotomous predicted and actual life experiences, biserial correlations between original and dichotomized variables, and agreements between perceivers on actual life experiences
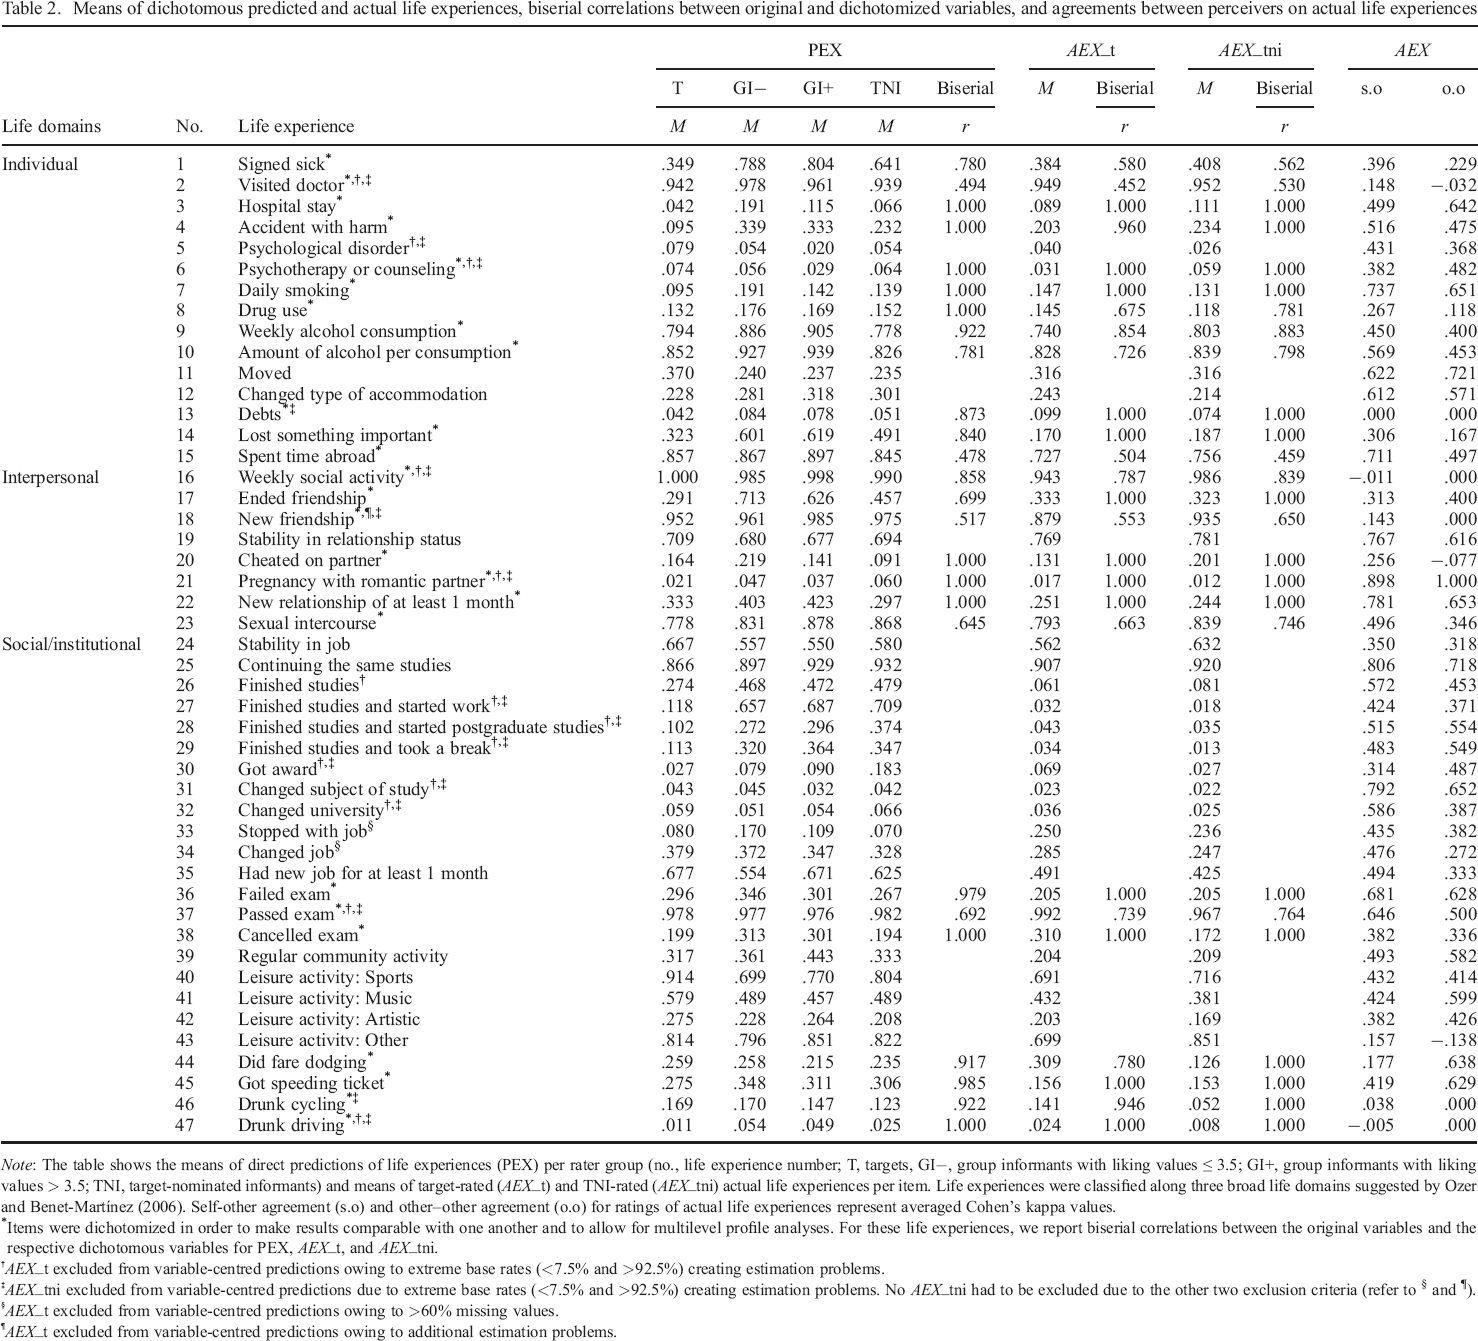
Note: The table shows the means of direct predictions of life experiences (PEX) per rater group (no., life experience number; T, targets, GI−, group informants with liking values ≤ 3.5; GI+, group informants with liking values > 3.5; TNI, target–nominated informants) and means of target–rated (AEX_t) and TNI–rated (AEX_tni) actual life experiences per item. Life experiences were classified along three broad life domains suggested by Ozer and Benet–Martínez (2006). Self–other agreement (s.o) and other–other agreement (o.o) for ratings of actual life experiences represent averaged Cohen's kappa values.
Items were dichotomized in order to make results comparable with one another and to allow for multilevel profile analyses. For these life experiences, we report biserial correlations between the original variables and the respective dichotomous variables for PEX, AEX_t, and AEX_tni.
AEX_t excluded from variable–centred predictions owing to extreme base rates (<7.5% and >92.5%) creating estimation problems.
AEX_tni excluded from variable–centred predictions due to extreme base rates (<7.5% and >92.5%) creating estimation problems. No AEX_tni had to be excluded due to the other two exclusion criteria (refer to § and ¶).
AEX_t excluded from variable–centred predictions owing to >60% missing values.
AEX_t excluded from variable–centred predictions owing to additional estimation problems.
Besides the target–rated actual life experiences (AEX_t), we also used consensual reports by the target–nominated informants (AEX_tni) as a second criterion variable for determining judgemental validity. They were computed as the mode of the judgments by the 1–3 TNI per target. Where there was no agreement among these informants, that is, where no mode could be determined (e.g. when there was 1 TNI saying ‘yes’ and 1 TNI saying ‘no’), the value for the respective life experience was set to missing. This was true for 5.1% of valid cases.
Content ratings
Life experiences were independently classified by two of the authors with regard to the three broad life domains suggested by Ozer and Benet–Martínez (2006) in their literature review: (i) individual, (ii) interpersonal, and (iii) social/institutional. We use these three life domains as a scheme for organizing the variables with regard to content (e.g. in some of our tables and figures). Agreement among the two raters across all 47 variables was very high (κ = .97). In cases of disagreement (n = 1), the authors agreed on a category after discussion. Overall, 31.9% (n = 15) of the 47 life experiences analyzed below can be classified as ‘individual’, 17.0% (n = 8) as interpersonal, and 51.1% (n = 24) as social/institutional.
Social desirability ratings
All 47 life experience variables were rated with regard to social desirability (‘To what extent does the description of a target with this statement imply a positive or negative evaluation?’). Ratings were obtained from a separate group of 18 psychology students (16 women) between the age of 20 and 24 (M = 21.72, SD = 0.96). They were recruited at a university in a mid–sized German city and were remunerated with 5 € for their participation. Social desirability was rated on a 10–point scale ranging from 1 (very negative) to 10 (very positive), with almost perfect reliability (ICC [2, 18] = .98). The items’ average social desirability values ranged from 1.33 to 9.67 with a mean of 5.69 (SD = 2.26) (refer to Supplemental Figure S5 displaying results separated by life experience). That is, they basically covered the full spectrum of the desirability scale. In addition, they were almost normally distributed. The items’ average social desirability ratings were used to account for positivity bias in the person–centred analyses reported below.
Statistical analyses
Data preparation and statistical analyses were performed in SPSS Statistics Version 26.0 and R 3.5.3 (R Development Core Team, 2018; 2019) using the R packages brms (Bürkner, 2017), lme4 (Bates, Mächler, Bolker, & Walker, 2015), psych (Revelle, 2018), and tidyverse (Wickham et al., 2019). The respective R–scripts needed to reproduce our results, as well as additional tables can be retrieved from our OSF project (https://osf.io/35mej/). Note that most of the following analyses were exploratory in nature and that we did not pre–register any specific hypothesis.
Variable–centred analyses
The following analyses reflect a ‘variable–centred’ approach. In variable–centred analyses, the relationship between two variables is examined, with the individual perceiver–target dyads constituting the cases.
Self–other and other–other agreement
We computed the average pairwise agreement between targets and TNI (i.e. self–other agreement), as well as between TNI (i.e. other–other agreement) per (dichotomized) life experience using Cohen's kappa. That is, for each life experience, we first computed Cohen's kappa for individual pairs of perceivers (e.g. targets with their respective first informants and targets with their respective second informants), and then we derived the median of those kappas. We also report the average of these median kappas across all 47 life experiences.
Validity of predictions
One core issue addressed by the present study concerned the predictive validity of judgements by different groups of perceivers (i.e. ‘predictor sources’), namely, targets’ self–ratings (‘T’) compared with ratings by target–nominated informants (‘TNI’), compared with ratings by ‘group informants’ (GI) who were recruited independent of the targets’ preferences, and who had higher (‘GI+’) or lower (‘GI−’) levels of liking towards the targets. By comparing these different sources with one another, we were able to determine whose ratings were more valid in predicting the targets’ actual life experiences. We also compared the predictive validity of these different predictor sources with regard to three ‘predictor types’: direct predictions of life experiences, domain–based predictions (based on Big Five domain scores), and nuance–based predictions (based on ratings on individual items). For both types of personality–based predictions, we tested omnibus models including all of the respective personality ratings (5 for the Big Five and 30 for the nuances) simultaneously as predictors. This approach is in line with research suggesting that, especially with small sample sizes, individual effect sizes may be too small to be detected, but combining the effects in one model may yield significant predictions of outcomes (refer to Mõttus et al., 2017, for a more detailed discussion). Also, we were mainly interested in the overall predictive power of personality ratings compared with direct predictions and not in specific effects of individual domains or nuances. To answer the research questions outlined earlier, separately for each of the four predictor sources (T, TNI, GI+, and GI−), we conducted several sets of (multiple) logistic regression analyses using (i) target–rated actual life experiences (AEX_t) and (ii) TNI–rated actual life experiences (AEX_tni) at Wave 3 as two distinct validation measures (i.e. criterion variables). These were predicted using three different types of predictors: (i) direct predictions of the same life experiences, (ii) all five Big Five domain scores, and (iii) all 30 Big Five items (6 per domain), all of which were measured at Wave 2.
For each target, we randomly drew one informant of each type (GI−, GI+, and TNI) out of all informants who had described that target at Wave 2. Then we used the different ratings, including the targets’ self–ratings, to predict the targets’ actual life experience levels at Wave 3. The random selection of informants was repeated 1000 times, to obtain more reliable results. We report the median of the respective coefficients across all 1000 iterations.
Before conducting the final analyses, we had to exclude several life experiences because they were causing estimation problems. More precisely, we excluded any life experience item with (i) extremely low or high occurrence rates (<7.5% or >92.5%) for either validation measure (self– or TNI ratings) or (ii) more than 60% missing values. This led to the exclusion of 14 target–rated and 16 TNI–rated actual life experiences owing to (i) and two more target–rated actual life experiences owing to (ii). In addition, there was one more life experience item causing estimation problems (for other reasons) for target–rated actual life experiences, which was therefore also excluded (refer to Table 2 for information on which item was excluded for which reason). The core results we report below are thus based on 3 (predictor types) × 4 (predictor sources) × 30 (life experiences) = 360 separate analyses for target–rated actual life experiences, and 3 × 4 × 31 = 372 separate analyses for TNI–rated actual life experiences. When we answer our research questions, we sometimes average the results of these analyses across predictor types, or across predictor sources.
To derive p–values for individual models and relevant combinations of models, we applied a permutation strategy. That is, we first repeated each analysis 1000 times, each time randomly rearranging the values of the dependent variable. 3 This way, we created distributions of model coefficients under the null hypothesis for each model. We also created distributions of aggregated model coefficients (e.g. median across sources and types of predictions) as well as of differences between those aggregated coefficients. We then compared our observed values with these distributions to derive p–values, and statistical significance was determined using an alpha level of 1%. Models were tested one–tailed yielding significant results when the observed coefficient was larger than the 99% quantile of the distribution under the null hypothesis. Differences between models were tested two–tailed, yielding significant results when the observed value was smaller than the 0.5% quantile or larger than the 99.5% quantile of the distribution under the null hypothesis.
When conducting the 1000 permutations, we reduced the number of random selections of informants from 1000 to 20 for models involving informant ratings as predictors. This was done owing to constraints regarding computational power and time (analyses with 1000 random selections would have taken almost a year to compute on our computers).
We selected the adjusted entropy–based R2 (
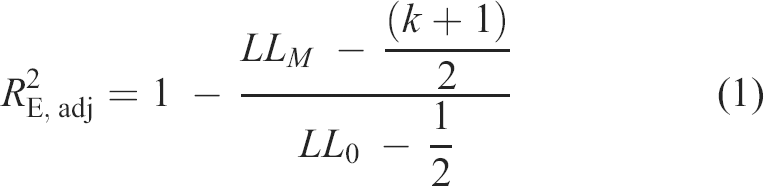
with LLm representing the log–likelihood of the model, LL0 the log–likelihood of the null (‘intercept only’) model, and k the number of predictors in the model.
As the interpretation of pseudo R2 values is not so straightforward, we rely on common standards for the interpretation of correlation coefficients (r = .1 for small, r = .2 for moderate, and r = .3 for large) in personality psychology (Funder & Ozer, 2019; Gignac & Szodorai, 2016). When transforming these into R2 values, the resulting equivalent values would be R2 = .01 for small, R2 = .04 for moderate, and R2 = .09 for large effects. Note, however, that in logistic regressions, these values do not represent the amount of explained variance, but the relative extent to which the maximized log–likelihood is reduced. To account for this, we will mainly focus on relative effects by comparing the effect sizes for different predictor sources and different predictor types with one another.
Person–centred analyses
Another aim of the present study was to investigate whether and how the perceivers’ liking and knowing of their targets differentially affected their ability to make accurate predictions regarding those targets’ life experiences in the course of the next year. We applied multilevel modelling to examine these potential influences on the informants’ direct predictions of the targets’ future life experiences. The analyses are based on the social accuracy model (Biesanz, 2010) and essentially represent an applied case of the truth and bias model (T&B model; West & Kenny, 2011), extended to multilevel profile analyses. In this approach, the core unit of analysis is the person (Biesanz, 2010; Furr, 2008). For each perceiver–target dyad we predicted associations between profiles of actual and predicted life experiences from two variables characterizing the relationship between the respective target and perceiver (i.e. liking and knowing). A similar kind of analysis was applied in previous research, where a detailed description of the approach is available (Wessels et al., 2020; Zimmermann, Schindler, Klaus, & Leising, 2018).
In the T&B model, judgements are predicted from (i) truth variable(s) and (ii) bias variable(s). In the present research, we performed two multilevel profile analyses. In both, the bias variable was the profile of the individual experiences’ social desirability ratings. In Model 1, we used the profile of all 47 target–rated actual life experiences (AEX_t), whereas in Model 2 we used the profile of the 47 TNI–rated actual life experiences (AEX_tni) as the truth variable. In the analysis using AEX_t, predictions were provided by all informants (regardless of informant type). In the analysis using AEX_tni, predictions by the TNI were excluded to avoid shared method effects. The life experience ratings (Level 1) were nested in perceivers (Level 2), which were nested in targets (Level 3), both for target–rated (Model 1) and TNI–rated (Model 2) actual life experiences. In the T&B model, the extent to which judgements are accurate is called ‘truth force’, while the extent to which judgements are biased is called ‘bias force’. We examined the effects of liking and knowing as moderators of the truth and bias forces. The analyses are based on Bayesian estimations using ‘Stan’ for full Bayesian inference via the package ‘brms’ (Bürkner, 2017) in R 3.5.3 (R Development Core Team, 2018; 2019). The model can be expressed by the following equations:
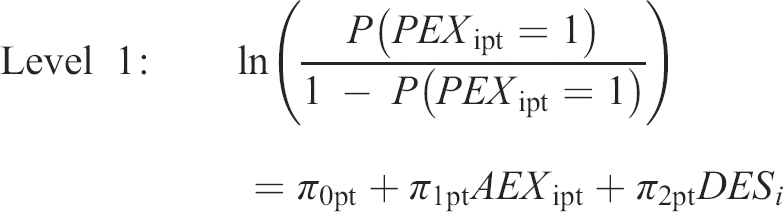
The dependent variable represents the log odds of informant (perceiver) p on life experience (item) i to report expecting the respective life experience (PEX) for target t to occur (0 = no, 1 = yes). It was predicted from the actual life experience for target t (AEXt) as rated by the targets themselves (AEX_t, Model 1) or by the TNI (AEX_tni, Model 2) and from the items’ social desirability (DES i ) on Level 1, and perceiver p's liking (Likingpt) and knowing (Knowingpt) towards target t on Level 2. In order to enhance interpretability, we centred Likingpt (Model 1, M = 3.75; Model 2, M = 3.37), Knowingpt (Model 1, M = 3.22; Model 2, M = 2.66), and DES i (M = 5.69) around their respective grand mean.
The fixed effect γ000 contains the log odds for the average informant expecting that a life experience with average desirability will occur (PEX) for his or her target when the actual life experience did not occur (AEX = 0). The fixed effects γ010 and γ020 represent the expected increase in the log odds of reporting that a life experience with average desirability is expected to occur for every 1 unit increase in liking and knowing, respectively, irrespective of whether this life experience actually occurred. That is, they reflect how much the informants’ predictions of future experiences for their targets varied depending on how well they said they knew their targets, and how much they said they liked their targets. The expected changes in these values due to the actual life experience level (AEX; 0 = no, 1 = yes) are represented by the fixed effects γ100, γ110, and γ120. More precisely, the fixed effect γ100 represents the expected increase in the log odds of reporting that a life experience with average desirability is expected to occur when the actual life experience was reported to have occurred, holding liking and knowing constant at their respective means. It is thus a measure of the average informant's validity in predicting the targets’ life experiences. The fixed effects γ110 and γ120 represent the extents to which associations between the log odds of expecting life experiences with average desirability to occur (PEX) and their actual occurrence (validity) change depending on liking and knowing, respectively. That is, they reflect how the validity of the informants’ predictions changed with how much they said they liked their targets, and with how well they said they knew their targets. The fixed effect γ200 represents the average positivity bias in predictions of future life experiences across targets and perceivers. The expected change in positivity bias due to variations in liking and knowing, respectively, is represented by the fixed effects γ210 and γ220. Note that, in order to account for any other possible differences between GI and TNI (e.g. due to the different recruitment strategies), we also included an additional dummy–coded variable (Type) in Model 1 (0 = GI, 1 = TNI) as another predictor in each of the three equations at Level 2. This variant is not depicted in the algebraic model above. The respective fixed effects γ130 and γ230 represent the expected changes in accuracy and positivity bias that are due to the respective perceiver's belonging to a specific informant group (GI vs. TNI), while holding liking and knowing constant at their means.
The random effects r0pt, r1pt, and r2pt as well as u00t, u10t, and u20t represent deviations in the log odds for predicted life experiences, positivity bias and the accuracy of predictions that are attributable to specific perceivers p and targets t, respectively. Random effects were assumed to be normally distributed and allowed to correlate within levels. Because of the algorithm that we applied to select targets, targets t did not differ from one another in terms of liking and knowing, so we did not include the respective random effects for the sake of model simplicity.
Results
When referring to specific life experiences, we provide the respective life experience number (Table 2) in brackets.
Variable–centred analyses
Self–other and other–other agreement in judging actual life experiences
Agreement (calculated as median pairwise kappas) between targets and TNI (i.e. self–other agreement), as well as between TNI (i.e. other–other agreement), varied greatly depending on the life experience being measured (Table 2). It ranged from basically no agreement for, for example, ‘drunk driving’ [47] (self–other agreement κ = 0; other–other agreement κ = 0) and ‘debts’ [13] (self–other agreement κ = 0; other–other agreement κ = 0), to very good agreement for, for example, ‘continuing the same studies’ [25] (self–other agreement κ = .81; other–other agreement κ = .72) and ‘pregnant’ [21] (self–other agreement κ = .90; other–other agreement κ = 1.00). For most life experiences, the two forms of agreement were of very similar magnitude, r = .82, p < .01. The largest difference was found for ‘fare dodging’ [44] (self–other agreement κ = .18; other–other agreement κ = .64), followed by ‘cheated on partner’ [20] (self–other agreement κ = .26; other–other agreement κ = −.08). Across all 47 life experiences, there was considerable self–other agreement, with a median of κ = .44, and other–other agreement, with a median of κ = .43.
Validity of predictions
As explained in the Methods section, we used a bias–corrected R2 as our core measure of predictive validity. This measure was first computed separately for each individual combination of predictor type (3), predictor source (4), and actual life experience (30/31). In the following, we focus on results averaged across actual life experiences, however, as we are particularly interested in differences between predictor types and between predictor sources. Note that most of these analyses should be considered exploratory, as we had no particular hypotheses regarding many of the respective differences between predictor types and between predictor sources. Therefore, in our discussion of the individual effects in the next few sections, we focus on relative effect sizes rather than p–values. Figure 1 illustrates the overall pattern of results: We found clear evidence for validity across predictor types and predictor sources, but with small–to–moderate effect sizes. This is probably attributable to the relatively high methodological rigour of the present study (in particular the longitudinal prediction of life experiences 1 year later), and to differences in the ‘bandwidth’ between some of the predictors (personality domains and nuances) and the criteria (specific life experiences).
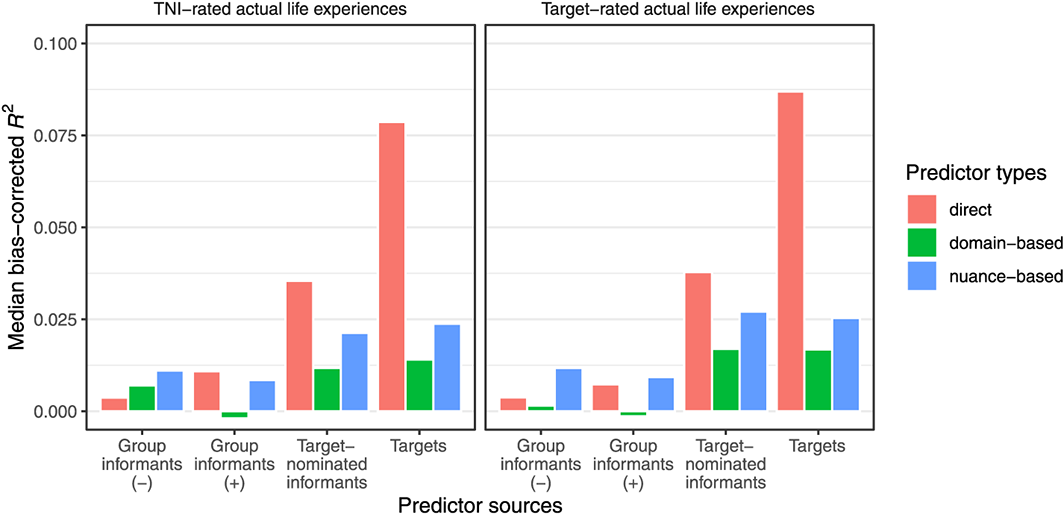
Median bias–corrected R2 values for the four different predictor sources and the three predictor types across 31 TNI–rated actual life experiences (left half) and 30 target–rated actual life experiences (right half). TNI = target–nominated informant. [Colour figure can be viewed at wileyonlinelibrary.com]
Validity of predictions for different predictor types
Results pertaining to the predictive validity of different predictor types across predictor sources are displayed in Table 3. Across criterion variables and predictor sources, all three predictor types afforded significant predictions of target–rated and TNI–rated actual life experiences. The greatest validity in this regard was found for direct predictions (AEX_t, Mdn R2 = .020, p < .001; AEX_tni, Mdn R2 = .024, p < .001) and nuance–based predictions (AEX_t, Mdn R2 = .019, p < .001; AEX_tni, Mdn R2 = .018, p < .001). Domain–based predictions (AEX_t, Mdn R2 = .009, p < .001; AEX_tni, Mdn R2 = .008, p < .001) had significantly lower predictive validity than the other two types of predictions (p < .001).
Validity of predictions for different predictor types
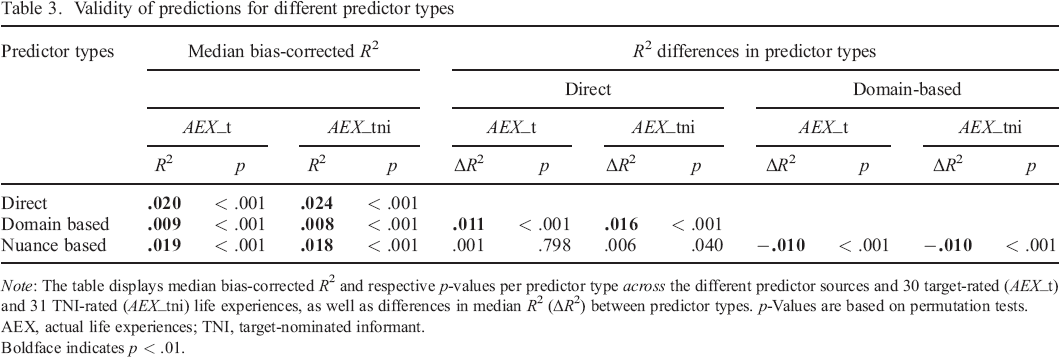
Note: The table displays median bias–corrected R2 and respective p–values per predictor type across the different predictor sources and 30 target–rated (AEX_t) and 31 TNI–rated (AEX_tni) life experiences, as well as differences in median R2 (ΔR2) between predictor types. p–Values are based on permutation tests.
AEX, actual life experiences; TNI, target–nominated informant.
Boldface indicates p < .01.
Validity of predictions for different predictor sources
Results pertaining to the predictive validity of different predictor sources across predictor types are displayed in Table 4. Across criterion variables and predictor types, all four predictor sources afforded valid predictions regarding TNI–rated actual life experiences, whereas only TNI–rated and target–rated predictors afforded valid predictions regarding target–rated actual life experiences.
Validity of predictions for different predictor sources
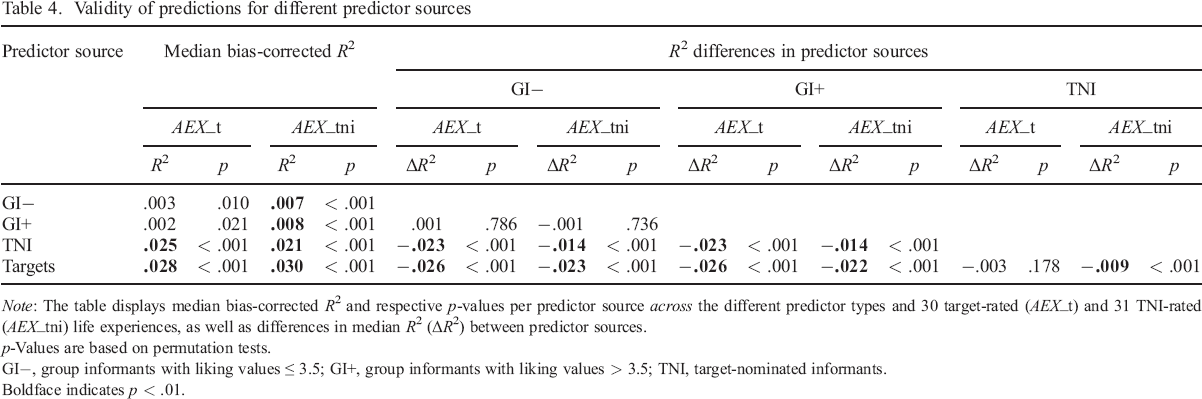
Note: The table displays median bias–corrected R2 and respective p–values per predictor source across the different predictor types and 30 target–rated (AEX_t) and 31 TNI–rated (AEX_tni) life experiences, as well as differences in median R2 (ΔR2) between predictor sources.
p–Values are based on permutation tests.
GI−, group informants with liking values ≤ 3.5; GI+, group informants with liking values > 3.5; TNI, target–nominated informants.
Boldface indicates p < .01.
When predicting target–rated actual life experiences, targets (Mdn R2 = .030, p < .001) and TNI (Mdn R2 = .021, p < .001) provided the most valid ratings, while notably targets (Mdn R2 = .028, p < .001) significantly outperformed (p < .001) TNI (Mdn R2 = .025, p < .001) when predicting TNI–rated actual life experiences. Both of these findings, but particularly the latter, suggest that shared method effects did not play a major role. Predictions by high–liking GI (AEX_t, Mdn R2 = .002, p = .021; AEX_tni, Mdn R2 = .008, p < .001) and low–liking GI (AEX_t, Mdn R2 = .003, p = .010; AEX_tni, Mdn R2 = .007, p < .001) were only significant for TNI–rated actual life experiences, and overall significantly less valid than predictions by targets and TNI (p < .001). They did not significantly differ from each other in that regard.
Predictive validity for different predictor sources, given predictor type
Results pertaining to the predictive validity of different predictor sources given a specific predictor type are displayed in Table 5. Overall, direct predictions were valid for all predictor sources, but targets vastly outperformed all other sources of information. TNI also had substantial (moderate) predictive validity, while direct predictions by GI had only small predictive validity. The pattern of findings was similar for personality–based predictions: however, targets and TNI made about equally valid personality–based predictions which clearly outperformed personality–based predictions by the GI.
Predictive validity for different predictor sources, given predictor type
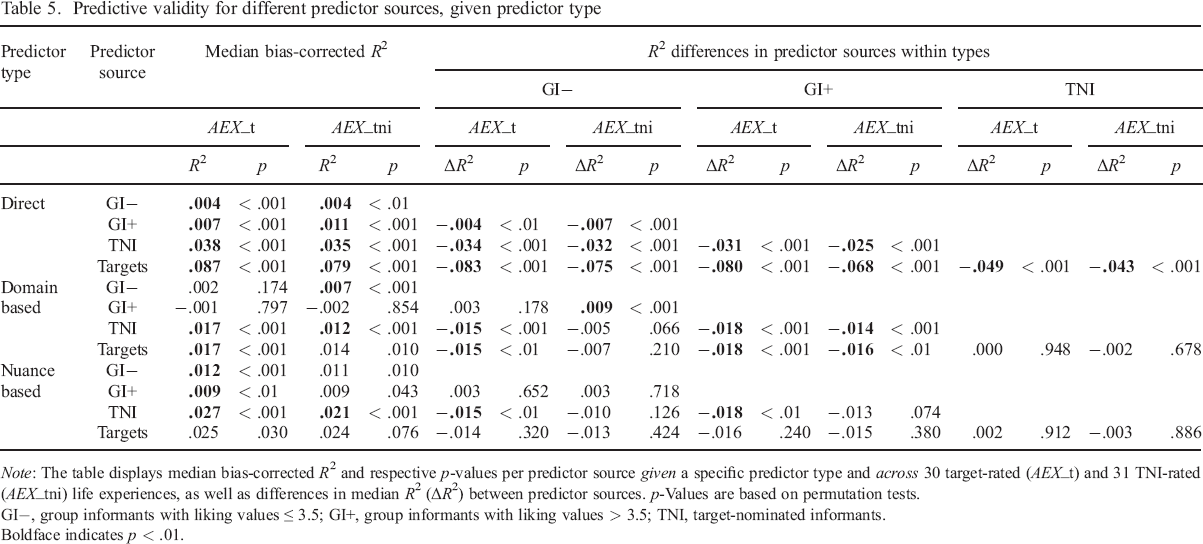
Note: The table displays median bias–corrected R2 and respective p–values per predictor source given a specific predictor type and across 30 target–rated (AEX_t) and 31 TNI–rated (AEX_tni) life experiences, as well as differences in median R2 (ΔR2) between predictor sources. p–Values are based on permutation tests.
GI−, group informants with liking values ≤ 3.5; GI+, group informants with liking values > 3.5; TNI, target–nominated informants.
Boldface indicates p < .01.
More specifically, across validation measures (AEX_t and AEX_tni), there was significant validity for direct predictions of actual life experiences by all four sources. For both target–rated and TNI–rated actual life experiences, targets provided the best direct predictions (AEX_t, Mdn R2 = .087, p < .001; AEX_tni, Mdn R2 = .079, p < .001), followed by TNI (AEX_t, Mdn R2 = .038, p < .001; AEX_tni, Mdn R2 = .035, p < .001), followed by GI+ (AEX_t, Mdn R2 = .007, p < .001; AEX_tni, Mdn R2 = .011, p < .001) and by GI− (AEX_t, Mdn R2 = .004, p < .001; AEX_tni, Mdn R2 = .004, p < .01). All differences between these sources were significant (p < .01 or p < .001).
Personality nuances rated by the targets had no predictive validity at the p < .01 level (AEX_t, Mdn R2 = .025, p < .05; AEX_tni, Mdn R2 = .024, p = .08), but the effects were of similar size as and did not significantly differ from those we found for TNI–rated nuances, which significantly predicted actual life experiences across the two validation measures (AEX_t, Mdn R2 = .027, p < .001; AEX_tni, Mdn R2 = .021, p < .001). To a significantly lower degree (p < .01), GI+ ratings (Mdn R2 = .009, p < .01) and GI− ratings (Mdn R2 = .012, p < .01) of personality nuances also had some validity when predicting target–rated actual life experiences. They did not significantly differ from each other in that regard. When predicting TNI–rated actual experiences, GI+ rated nuances (Mdn R2 = .009, p = .043) and GI− rated nuances (Mdn R2 = .011, p = .010) did not have any significant predictive validity at the p < .01 level.
Across the two validation measures, personality domains rated by targets (AEX_t, Mdn R2 = .017, p < .001; AEX_tni, Mdn R2 = .014, p = .010) and by TNI (AEX_t, Mdn R2 = .017, p < .001; Mdn R2 = .012, p < .001) were the most valid predictors. Differences in validity between target ratings and TNI ratings of personality domains were not significant. In addition, TNI–rated actual life experiences (Mdn R2 = .007, p < .001) but not target–rated actual life experiences (Mdn R2 = .002, p = .174) were significantly predicted by GI− rated personality domains. For neither of the two validation measures did GI+ rated personality domains have significant predictive validity (AEX_t, Mdn R2 = −.001, p = 797; AEX_tni, Mdn R2 = −.002, p = .854).
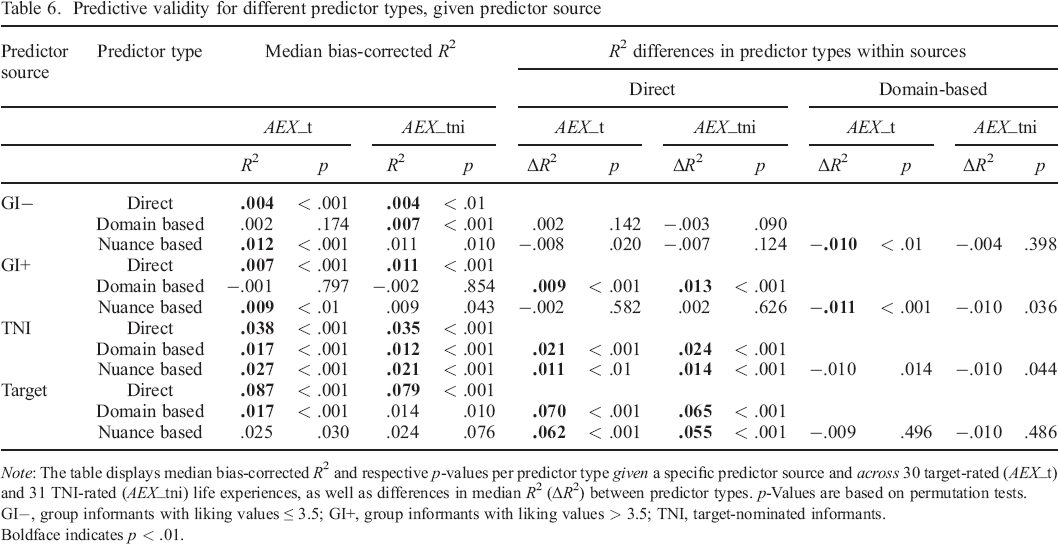
Predictive validity for different predictor types, given predictor source
Results pertaining to the predictive validity of different predictor types given a specific predictor source are displayed in Table 6. Overall, targets’ direct predictions had by far the greatest predictive validity, followed by nuance–based and domain–based predictions, which were about equally valid. The same pattern was found for predictions by TNI, which also had much stronger validity for direct compared with personality–based predictions, yet the difference between the two predictor types here was not as big. Predictions by GI had very little predictive validity overall and (almost) no predictive validity when they were domain–based.
Predictive validity for different predictor types, given predictor source
Note: The table displays median bias–corrected R2 and respective p–values per predictor type given a specific predictor source and across 30 target–rated (AEX_t) and 31 TNI–rated (AEX_tni) life experiences, as well as differences in median R2 (ΔR2) between predictor types. p–Values are based on permutation tests.
GI−, group informants with liking values ≤ 3.5; GI+, group informants with liking values > 3.5; TNI, target–nominated informants.
Boldface indicates p < .01.
More specifically, when comparing the validity of different types of predictions for targets, direct predictions performed by far the best across both validation measures (AEX_t, Mdn R2 = .087, p < .001; AEX_tni, Mdn R2 = .079, p < .001). Personality–based predictions were also somewhat valid, but to a significantly lower degree (p < .001). Nuance–based predictions (AEX_t, Mdn R2 = .025, p = .030; AEX_tni, Mdn R2 = .024, p = .076) were about equally valid as domain–based predictions (AEX_t, Mdn R2 = .017, p < .001; AEX_tni, Mdn R2 = .014, p = .010) but missed the threshold of statistical significance.
Ratings by target–nominated informant had significant predictive validity across all three types of predictors. For both validation measures, direct predictions by TNI (AEX_t, Mdn R2 = .038, p < .001; AEX_tni, Mdn R2 = .035, p < .001) had significantly higher validity (p < .01 or p < .001) than personality–based predictions in terms of domains (AEX_t Mdn R2 = .017, p < .001; AEX_tni, Mdn R2 = .012, p < .001) and nuances (AEX_t, Mdn R2 = .027, p < .001; AEX_tni, Mdn R2 = .021, p < .001).
For high–liking GI (GI+), only direct predictions had significant validity across the two validation measures (AEX_t, Mdn R2 = .007, p < .001; AEX_tni, Mdn R2 = .011, p < .001). Nuance–based predictions by the GI+ performed about equally well as direct predictions by the same perceivers. They were significantly valid with regard to target–rated actual life experiences (Mdn R2 = .009, p < .01) but missed the threshold of p < .01 with regard to TNI–rated actual life experiences (Mdn R2 = .009, p = .043). Domain–based predictions by the GI+ did not have any significant predictive validity (AEX_t, Mdn R2 = −.001, p = .797; AEX_tni, Mdn R2 = −.002, p = .854).
Direct predictions by low–liking GI (GI−) had some significant validity regarding both target–rated (Mdn R2 = .004, p < .001) and TNI–rated (Mdn R2 = .004, p < .01) actual life experiences. Nuance–based predictions by the GI− also had some significant validity (AEX_t, Mdn R2 = .012, p < .001; AEX_tni, Mdn R2 = .011, p = .010) and outperformed (p < .01) domain–based predictions with regard to target–rated actual experiences, whose validity was not significantly different from zero (Mdn R2 = .002, p = .174). In contrast, when using TNI–rated actual life experiences as the validation measure, domain–based predictions by the GI− did show some validity (Mdn R2 = .007, p < .001).
Summary of predictive validity in variable–centred analyses
To summarize, across predictor sources, direct and nuance–based predictions were the most valid. Across predictor types, targets and TNI were the most valid sources of information. Targets’ direct predictions had by far the best predictive validity. These judgements probably benefit from the targets’ privileged access to some kinds of (especially: personal) information, combined with a perfect match in bandwidth between predictor and criterion. Direct predictions by TNI had the second highest validity. Again, in these predictions, there is a perfect match in bandwidth, but the TNI probably have less valid information about the targets as compared with the targets themselves. Personality–based predictions by targets and TNI were also somewhat valid, but GI predictions had very little (to no) predictive validity overall.
To provide more detail regarding individual life experiences, we display the results of some more fine–grained analyses in Figure 2 (refer to Supplemental Table S6 for the five life experiences with the most valid predictions for each combination of predictor type and predictor source).
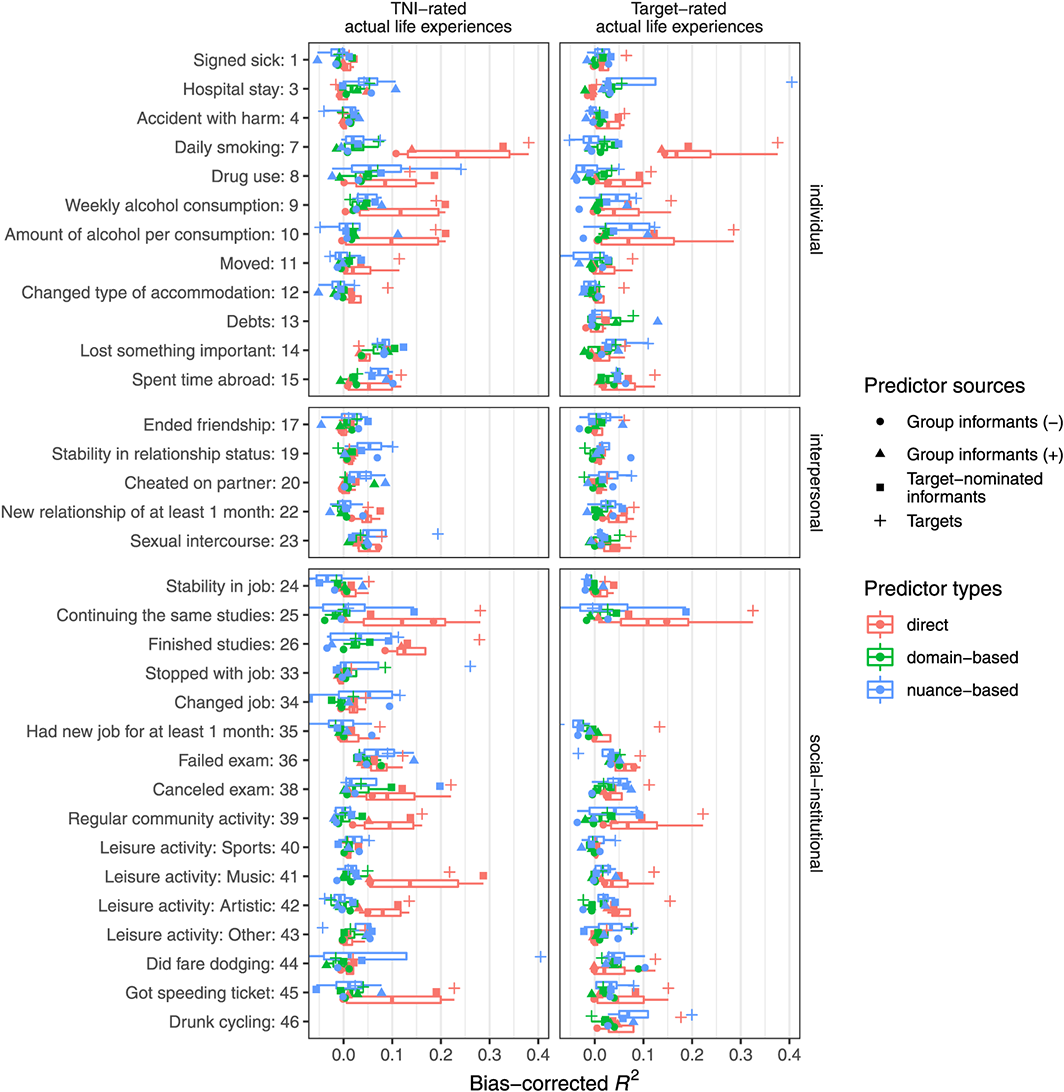
The figure summarizes the results of a total of 732 (multiple) logistic regression models. Bias–corrected R² are displayed for 33 actual life experiences (y–axis) as rated by the target–nominated informants (‘TNI’) (31 life experiences, left) or the targets (30 life experiences, right), the three predictor types (colours), and the four different sources (shape). The box–and–whisker plots summarize the results per predictor type across sources for each individual life experience. Two extreme R2 values (>.40) were rescaled to .405 in order to improve the figure's interpretability. Life experiences are grouped along three broad life domains suggested by Ozer and Benet–Martínez (2006) (displayed on the right): individual, interpersonal, social/institutional. [Colour figure can be viewed at wileyonlinelibrary.com]
Person–centred analyses
In Table 7, we display the results of multilevel profile analyses investigating associations between liking and knowing on the one hand, and validity and positivity bias on the other hand. Person–centred analyses were required in this regard, in order to be able to disentangle the unique effects of the two predictors (liking and knowing), which tend to be strongly correlated with one another. Please note that these analyses pertain to direct predictions only, as they were not possible for personality–based predictions, owing to the data structure.
Effects of liking and knowing on validity and positivity bias in direct predictions of actual life experiences
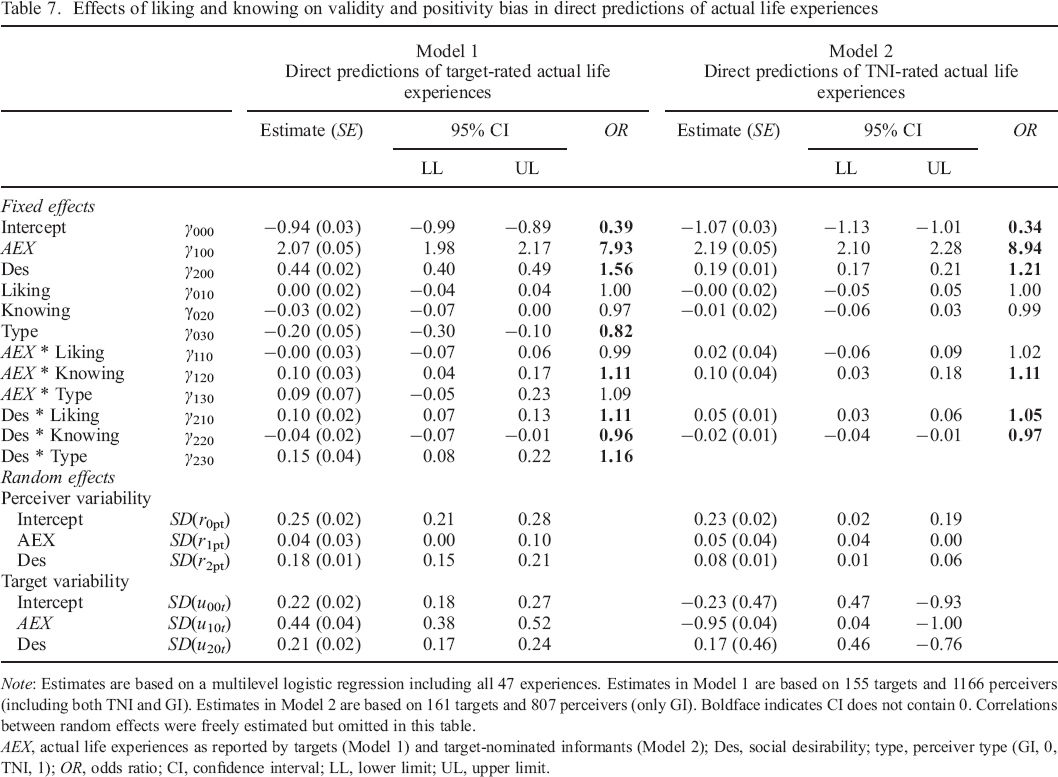
Note: Estimates are based on a multilevel logistic regression including all 47 experiences. Estimates in Model 1 are based on 155 targets and 1166 perceivers (including both TNI and GI). Estimates in Model 2 are based on 161 targets and 807 perceivers (only GI). Boldface indicates CI does not contain 0. Correlations between random effects were freely estimated but omitted in this table.
AEX, actual life experiences as reported by targets (Model 1) and target–nominated informants (Model 2); Des, social desirability; type, perceiver type (GI, 0, TNI, 1); OR, odds ratio; CI, confidence interval; LL, lower limit; UL, upper limit.
These analyses were performed twice: once across 47 target–rated actual life experiences (Model 1, left half) and once across 47 TNI–rated actual life experiences (Model 2, right half). Overall, effects were very consistent across the two validation measures. Both of the analyses suggested that knowing and liking did not have an effect on overall levels of predicted life experiences. This might have been expected, given that the set of life experiences we studied was fairly balanced in terms of social desirability (refer to preceding discussions). We did, however, find a negative effect for predictor type (OR030) representing further differences between GI and TNI in Model 1: The odds of reporting that any life experiences were expected to occur were somewhat lower (factor: 0.82) for TNI than for GI.
For both validation measures, we found considerable predictive validity overall, as indicated by large odds ratios. Specifically, the expected odds of reporting that a certain life experience was expected to occur were eight to nine times greater when that life experience actually did occur, as compared to when it did not (Model 1, OR100 = 7.93; Model 2, OR100 = 8.94). Neither analysis suggested a moderating influence of liking or perceiver type on validity, but in line with our expectations, we did find a significant positive influence of knowing on validity (across validation measures), with the expected odds of making accurate predictions being about 1.1 times greater with every one unit increase in knowing (OR120). Also, there was a significant positivity bias across both validation measures (Model 1, OR200 = 1.56; Model 2, OR200 = 1.21), implying that life experiences were generally expected to be more likely to occur the more positive they were rated to be. In line with our expectations, liking significantly increased this positivity bias, with the expected odds of making more positive predictions being about 1.1 times greater with every unit increase in liking (OR210). Thus, irrespective of whether or not certain life experiences did occur later on, perceivers expected better things to happen for targets they liked. We found a similar effect for perceiver type in Model 1 (OR230 = 1.16): TNI expected significantly more positive things to happen to their targets than did GI, above and beyond the effect of their liking towards the targets. Finally, knowing was associated with a slightly lower positivity bias across the two models (Model 1, OR220 = 0.96; Model 2, OR220 = 0.97), suggesting that perceivers expected slightly less positive things to happen for targets they said they knew better.
Discussion
In the present study, we investigated the predictive validity of various kinds of person judgements in regard to a broad range of psychologically meaningful life experiences. In contrast to most prior research in this field (cf. Wessels et al., 2016), we used relatively rigorous research methods. Specifically, we predicted the targets’ future life experiences longitudinally, over an interval of approximately 1 year, and we had both the predictor and the criterion variables in these predictions assessed by multiple sources: both the target persons and the informants they nominated provided data on predictor and criterion variables. In addition, we also obtained predictor ratings from a new type of (‘group’) informants who were somewhat familiar with the targets, but over whose recruitment the targets had no control. We did this in order to be able to investigate how validity and bias in person judgements vary across a broader spectrum of knowing and liking levels. We were also able to compare the predictive validity of three different predictor types varying in bandwidth (direct, personality nuances, and personality domains) with one another and—using multilevel modelling—to determine the unique associations between perceiver liking and knowing on the one hand, and validity and positivity bias on the other hand. In the following, we will briefly discuss the most noteworthy findings from our research in more detail.
Based on a systematic overview of prior research into possible ‘consequences of personality’, we compiled a relatively comprehensive list of 73 such consequences, concentrating on the ones being relatively ‘factual’ in nature (i.e. assessing them required little inference or interpretation). This list may in itself be seen as one useful result of the present study, as it may inform the selection of criterion variables in other, future studies. As it integrates many of the diverse lists of life experiences that had been used in previous studies (e.g. Lüdtke et al., 2011; Sarason et al., 1978; Vaidya et al., 2002), we think that our list may claim a certain level of representativeness. Our analyses of the data led to the insight that potential problems with extreme base rates (sometimes resulting in convergence problems) need to be anticipated and accounted for in this type of research. In our study, only a subsample (30–47) of the life experiences we had assessed could actually be used for statistical analyses.
Variable–centred analyses
Our analyses of which types and sources of predictions were most valid yielded the following results: first, direct predictions of future life experiences by the targets themselves had by far the greatest validity (cf. Table 5). This may be explained (i) in terms of the perfect match between predictor and criterion in terms of bandwidth in this case, as well as (ii) privileged knowledge that only the targets have about their own life circumstances, resources, plans, obstacles, and so on (Vazire, 2010). Second, direct predictions by the TNI were substantially less valid than those by the targets themselves, but still more valid than all other predictions (cf. Table 5). This may also be explained in terms of (i) bandwidth match and (ii) superior knowledge that TNI but not the GI have about the targets. In line with previous research (e.g. Connelly & Ones, 2010; Jackson et al., 2015; Luan et al., 2019; Thielmann et al., 2017), we also found evidence for substantial validity of personality–based predictions by the targets and TNI. The overall level of validity for such predictions was fairly similar when comparing personality domains and nuances with one another (cf. Table 6), and when comparing predictions by targets and TNI (cf. Table 5).
Generally speaking, predictions based on information that was provided by the GI often had some significant validity as well, but this validity was fairly limited (cf. Table 6). We conclude that the highly effortful recruitment of this relatively uncommon type of informant did not pay off in terms of validity (cf. Table 4). This, however, may be seen as ‘good news’ in terms of how data tends to be collected in contemporary personality research: judgements by targets and TNIs are not only relatively easy to obtain (Vazire, 2006, 2010) but also have substantial validity, even when making longitudinal predictions of future life experiences, and even when predicting narrow experiences from broader personality nuances and domains. Among the four different sources of information that we studied here, the two that are most commonly used turned out to be by far the most useful (cf. Table 4).
Notably, we did not find much evidence of shared method effects (Campbell & Fiske, 1959; Podsakoff et al., 2012) that may have inflated correlations between predictors and criteria. This conclusion may be drawn from a comparison of within–source (e.g. predictor and criterion rated by TNI) and between–source (e.g. predictor rated by target, criterion rated by TNI) predictions (e.g. in Table 6), which yielded very similar results. We assume that this finding is rooted in the relatively ‘factual’ nature of the life experiences that we assessed as criterion variables. Even though these experiences differed from one another in terms of social desirability, and even though we did find both a general positivity bias in predictions and an increase of that bias with liking (refer to succeeding discussions), it still seems plausible that the participants’ retrospective reports regarding the actual occurrence of these experiences were relatively immune to shared method bias.
Interestingly, across predictor sources and validation measures, the validity of nuance–based predictions was much stronger than that of domain–based predictions (cf. Table 3). These findings are in line with recent research showing that narrower traits (i.e. facets) may sometimes outperform broader traits (e.g. Ashton, Paunonen, & Lee, 2014; McAbee, Oswald, & Connelly, 2014; Paunonen & Ashton, 2013) and, more specifically, nuances may outperform Big Five personality traits in predicting life outcomes to a substantial degree (Mõttus, Bates, et al., 2019; Seeboth et al., 2018). This can be interpreted as a rather unsurprising instantiation of the bandwidth–fidelity dilemma (Cronbach & Gleser, 1957). In the context of the present study, over–fitting may have played a role as well, even though we attempted to diminish this influence to the extent possible by applying both a theoretical correction and an empirical bias correction. Firm conclusions in this regard would require proper cross–validation, however, which was not possible with the current dataset, owing to the relatively small sample size.
The overall level of predictive validity that was observed in our study may be regarded as somewhat sobering, given the closer associations between personality judgements and ‘consequences’ that were reported in many previous studies (e.g. Connelly & Ones, 2010; Roberts et al., 2007). In interpreting these findings, three things need to be considered: first, our study was more methodologically rigorous than many other studies in this field (e.g. Mõttus, 2016; Wessels et al., 2016), as we used a longitudinal design with a relatively long interval between assessments of predictor and criterion variables. Therefore, in contrast to studies using cross–sectional designs, associations between these two types of variables in the present study are unlikely to have been inflated by shared but unwanted influences such as the participants’ current mood or life circumstances. In a way, our more rigorous research design enabled more realistic and thus more modest estimations of the relevant effect sizes. Second, measurement error may have played a role as well, as each life experience in our study was measured with one item only and average interrater reliability for ratings of actual life experiences was only about .4. While this can actually be seen as a considerable level of interrater agreement for one–item measures, this rather low reliability (in absolute terms) might still have limited possible associations between predictor and criterion variables. Third, whereas we did not find any evidence for inflation of correlations owing to shared method effects (refer to preceding discussions), we cannot rule out the possibility that non–shared method effects had an attenuating effect on these correlations. Specifically, if it is true that our criterion variables (life experiences) did not strongly reflect bias factors such as the perceivers’ attitudes towards the targets (Leising et al., 2015), then correlations between these criterion variables and any predictors that do reflect such biases more strongly may be diminished. Research has shown that most person–descriptive terms, from which the items of most personality measures are composed, are highly evaluative and thus do strongly reflect the perceivers’ attitude towards the targets (Anderson, 1968; Dumas, Johnson, & Lynch, 2002; Leising, Ostrovski, & Borkenau, 2012).
Person–centred analyses
We also conducted person–centred multilevel analyses in which we predicted associations between whole sets of actual and predicted life experiences for each perceiver–target dyad (Level 1) from variables (liking and knowing) that characterize the relationship between perceiver and target (Level 2). This was necessary in order to be able to determine the unique contributions of the two Level 2 predictors, which tend to be strongly correlated (Leising et al., 2010). Owing to the data structure, these analyses were only possible for direct predictions of life experiences. Overall, we again found evidence for strong validity of such predictions, with odds ratios lying between 8 and 9 (cf. Table 7). In line with previous studies (e.g. Bernieri et al., 1994; Biesanz, West, & Millevoi, 2007), we also found that validity increased with knowing. Furthermore, we did find evidence for an overall positivity bias (i.e. regardless of validity, informants regarded life experiences as more likely the more positive they were rated to be) which increased with liking. That is, the more perceivers liked someone, the more they overestimated the extent to which their targets would experience positive things. The latter effect aligns well with previous findings (e.g. Human & Biesanz, 2011; Leising et al., 2015; Leising, Ostrovski, & Zimmermann, 2013; Zimmermann et al., 2018). However, to our knowledge, the present study is the first to corroborate these effects with regard to direct predictions of narrowly defined life experiences. In addition, the TNI also expected more positive things to happen to their targets than the GI did, independent of what the targets actually experienced, and above and beyond the analogous effect of liking. While TNI are typically family members or close friends (Leising et al., 2010), most GI in this study were members of the same university classes. Therefore, it is conceivable that these incremental effects might be due to the TNIs’ stronger emotional bonds with the targets (Vazire, 2010), which may not have been fully captured by our relatively simple measure liking.
We did not find any evidence for detrimental effects of liking on predictive validity. Again, this may be seen as ‘good news’ regarding the common use of TNI in personality research. Given that such informants tend to have extremely positive attitudes towards the targets who recruited them (Leising et al., 2010), it was conceivable that their ability to accurately predict what is going to happen to these targets in the future may be somewhat compromised. According to the present study, this is not the case, while, at the same time, the relatively high extent to which such informants know their targets clearly constitutes an advantage in terms of predictive validity.
Limitations and outlook
Despite the relatively high methodological rigour of the present study, a few limitations need to be acknowledged as well: first, the present study had a relatively small sample size, yielding potential over–fitting problems for multiple regression models with several interrelated predictors. While we used adjusted pseudo–R2 measures as our focal estimate of effect sizes and additionally freed these estimates from their empirically observed bias under the null hypothesis, some remaining over–fitting issues cannot completely be ruled out for our analyses involving personality nuances. Therefore, their results need to be interpreted with caution, and future studies should aim for considerably larger sample sizes, which allow for cross–validation and alternative statistical methods such as penalized regressions (e.g. LASSO).
Second, the present analyses focus on linear relationships between predictors and actual life experiences. While this is a common approach in psychological research, it is conceivable that our predictors may have non–linear and/or interactive effects on life experiences. One reason for our focus on linear relationships was the limited interrater reliability (i.e. self–other and other–other agreement) of the life experience assessments, because this may hinder the detection of non–linear relationships (e.g. using techniques such as machine learning) (Jacobucci & Grimm, 2020). Future studies should therefore aim not only for larger sample sizes but also for more reliable ways of measuring actual life experiences (e.g. systematic behavioural observation; use of more objectives measures; aggregating across larger numbers of judges).
Third, we used an open response format for some of the life experiences that we assessed, which resulted in some extremely skewed distributions. To control for that, and in order to enable our person–centred multilevel analyses, we decided to dichotomize these variables. Even though correlations between non–dichotomized and dichotomized variables were very high on average, doing so necessarily resulted in some loss of information, which is why the estimates we obtained from the respective analyses should be regarded as being somewhat conservative. Future studies may benefit from consistently assessing life experiences with forced choice response formats, to make such post hoc dichotomization unnecessary. To preserve some of the ‘hard’, factual nature of these assessments, it may be helpful to first gather some representative information about typical distributions of the relevant variables using open–ended questions and then apply some reasonable categorization scheme.
Fourth, our strategy for recruiting alternative (‘group’) informants was supposed to increase the range of perceivers’ liking and knowing towards the targets, which largely succeeded. However, all of these informants (as well as the targets) were recruited in a university context, making them rather uniform in terms of (e.g.) age and education level. Assessing a more diverse group of participants would yield higher levels of generalizability.
Fifth, for the same reason (university context), some of the (more consequential) life experiences (e.g. days spent in prison) had extremely low or zero occurrence rates in our sample and thus had to be excluded from the analyses. Aiming for a more diverse sample of targets may also yield greater variation in this regard and thus enable conclusions regarding such relatively ‘grave’ life experiences as well.
Overall, given the relatively high methodological rigour of the present study, the results cast a more realistic—and maybe somewhat sobering—light on the rather modest predictive power of personality judgements in regard to a broad range of relatively specific and meaningful life experiences. At the same time, the present study showed that people do indeed know—to some extent—what the next year will hold for them when asked to make direct predictions: the target persons themselves made by far the best direct predictions of this kind, followed by their close acquaintances. Hence, instead of relying on inferences regarding broader or (rather) narrower personality traits, sometimes it might be more informative to ask perceivers directly to predict a target person's future behaviour, experiences, and life course. Interestingly, while perceivers do expect more positive things to happen to their targets when they like these targets more, our findings suggest that this does not negatively affect the validity of these perceivers’ predictions in terms of rank–order. Taken together, across different types of judgements, the targets themselves, as well as their close acquaintances, seem to be the best judges of the targets’ future life experiences. This may be viewed as reassuring by personality researchers, as it corroborates the common practice of collecting person judgements that are provided by the targets and their close acquaintances.
Acknowledgement
Open access funding enabled and organized by Projekt DEAL.
Supporting Information
Supporting Information, per2293-sup-0001 - Who Knows Best What the Next Year Will Hold for You? The Validity of Direct and Personality–based Predictions of Future Life Experiences across Different Perceivers
Note S1. Overview of Terminology.
Table S2. Liking and Knowing Scales.
Table S3. Original 73 German Actual Life Experience Items and Respective English Translations.
Table S4. Cronbach's Alpha for the Big Five domain per Source and Medians across Sources.
Figure S5. Social Desirability Ratings of Life Experiences.
Table S6. The Five Best Predicted Life Experiences per Predictor Type and Source.
Supporting Information, per2293-sup-0001 for Who Knows Best What the Next Year Will Hold for You? The Validity of Direct and Personality–based Predictions of Future Life Experiences across Different Perceivers by NELE M. WESSELS, JOHANNES ZIMMERMANN and DANIEL LEISING, in European Journal of Personality
Note S1. Overview of Terminology.
Table S2. Liking and Knowing Scales.
Table S3. Original 73 German Actual Life Experience Items and Respective English Translations.
Table S4. Cronbach's Alpha for the Big Five domain per Source and Medians across Sources.
Figure S5. Social Desirability Ratings of Life Experiences.
Table S6. The Five Best Predicted Life Experiences per Predictor Type and Source.
Supporting Information
Supporting Information, per2293-sup-0002 - Who Knows Best What the Next Year Will Hold for You? The Validity of Direct and Personality–based Predictions of Future Life Experiences across Different Perceivers
Supporting Information, per2293-sup-0002 for Who Knows Best What the Next Year Will Hold for You? The Validity of Direct and Personality–based Predictions of Future Life Experiences across Different Perceivers by NELE M. WESSELS, JOHANNES ZIMMERMANN and DANIEL LEISING, in European Journal of Personality
Footnotes
Supporting Information
Additional supporting information may be found online in the Supporting Information section at the end of the article.