
Abstract
Researchers are increasingly interested in the affect dynamics of individuals for describing and explaining personality and psychopathology. Recently, the incremental validity of more complex indicators of affect dynamics (IADs; e.g. autoregression) has been called into question (Dejonckheere et al., 2019), with evidence accumulating that these might convey little unique information beyond mean level and general variability of emotions. Our study extends the evidence for the construct validity of IADs by investigating their redundancy and uniqueness, split–half reliability based on indices from odd–numbered and even–numbered days, and association with big five personality traits. We used three diverse samples that assessed daily and momentary emotions, including community participants, individuals with personality pathology, and their significant others (total N = 1192, total number of occasions = 51 278). Mean and variability of affects had high reliability and distinct nomological patterns to big five personality traits. In contrast, more complex IADs exhibited substantial redundancies with mean level and general variability of emotions. When partialing out these redundancies by using residual variables, some of the more complex IADs had acceptable reliability, but only a few of these showed incremental associations with big five personality traits, indicating that IADs have limited validity using the current assessment practices. © 2020 The Authors. European Journal of Personality published by John Wiley & Sons Ltd on behalf of European Association of Personality Psychology
Indicators of Affect Dynamics: Structure, Reliability, and Personality Correlates
Major personality models include emotions as part of personality along with motivations, cognitions, and behavioral dispositions (Carver, Sutton, & Scheier, 2000). Researchers have growing interest in how emotions unfold and interact with each other dynamically across time (i.e. affect dynamics) and how these processes relate to diverse psychological phenomena (e.g. Trull, Lane, Koval, & Ebner–Priemer, 2015). For example, affect dynamics have been targeted for describing and explaining well–being (Dejonckheere et al., 2019; Houben, Van Den Noortgate, & Kuppens, 2015), mood disorders (e.g. Bos, de Jonge, & Cox, 2019), borderline personality pathology (e.g. Mneimne, Fleeson, Arnold, & Furr, 2018), transdiagnostic dimensions of psychopathology (Scott et al., 2020), and normal–range personality differences (e.g. Kalokerinos et al., 2020; Kuppens, Van Mechelen, Nezlek, Dossche, & Timmermans, 2007). Affect dynamics can be measured by various person–specific summary statistics of an emotional time series [e.g. mean of states, standard deviation (SD), autoregression, and mean square successive differences (MSSD)] using intensive longitudinal research designs (Csikszentmihalyi & Larson, 1987; Hamaker & Wichers, 2017). Hereinafter, we refer to those statistics as indicators of affect dynamics (IADs).
Conceptually, it is presumed that the various IADs each capture distinct and meaningful features of the individuals’ emotional experience (in other words, that IADs possess construct validity). The validity of IADs is commonly evaluated by their associations to other relevant constructs (i.e. criterion validity). Critically, past research has demonstrated that manifold redundancies exist between IADs, including mathematical interdependencies (e.g. Jahng, Wood, & Trull, 2008; Mestdagh et al., 2018) and possibly conceptual overlap. These redundancies have to be considered when criterion validity is evaluated, because associations found between IADs and other relevant constructs might be non–specific, thereby undercutting the unique interpretations that presumably justify the use of these metrics. For example, non–specific associations were documented for the criteria of depression (e.g. Koval, Pe, Meers, & Kuppens, 2013), well–being (e.g. Houben et al., 2015), and neuroticism (Kalokerinos et al., 2020). Indeed, the accumulating evidence casts doubt on the incremental validity of more complex IADs (e.g. autoregression) beyond mean level and general variability of emotions (Bos et al., 2019; Dejonckheere et al., 2019). To date, there is still insufficient knowledge about the reliability and validity of more complex IADs using the current assessment practices.
In the following, we describe the IADs considered in the current study along with their common interpretation. First, given a sufficient number of repeated measurements, the individual mean of states (M) is a stable feature of individuals (Watson & Clark, 1999) and can be regarded as a good approximation of trait affect (e.g. Watson & Tellegen, 1985). Second, the individual SD is generally referred to as emotional variability, with past research indicating that it might be a stable and substantive trait even when controlling for its overlap with the mean (Eid & Diener, 1999). Third, the individual MSSD captures the strength of sudden fluctuations in the process. High values of MSSD have been interpreted as emotional instability (Jahng et al., 2008). Fourth, the individual strength of autoregression, which is the likelihood of remaining in a particular affective state from observation to observation, has been interpreted as emotional inertia (Kuppens et al., 2012; Kuppens, Allen, & Sheeber, 2010). Fifth, several statistics capture types of emotion differentiation, defined as the degree to which individuals report distinct emotional states. This concept may be applied to differentiating between affects (e.g. individual contemporaneous correlation between positive affect (PA) and negative affect (NA): affective bipolarity; Dejonckheere et al., 2018) or differentiating between more fine–grained emotional states within affects (e.g. the individual average item intercorrelation of positively valenced emotions). Sixth, cross–lagged effects can be used to describe how distinct affects predict each other across time as operationalized by temporal networks from dynamic network models (Epskamp, Waldorp, Mõttus, & Borsboom, 2018). Trait affect and also (to a somewhat lesser extent) emotional variability have received most support for their validity. In addition, M and SD yield the most parsimonious description of an emotional time series when compared against more complex IADs, as the calculation of the former disregards the inherent temporal sequence of repeated measurement. In contrast, more complex IADs do consider the temporal sequence.
The current ambiguity about the validity of IADs impedes research progress on affect dynamics. Three samples were used for secondary analysis in order to shed more light on this issue in several ways: (i) elucidating potential patterns of redundancy by investigating the structure of IADs, (ii) estimating their reliability as a prerequisite for validity, and (iii) extending their nomological network to big five personality traits. Big five personality traits are especially important to consider for tests of criterion validity, as those provide an established framework for capturing major psychological differences between individuals. This study included heterogenous samples in order to achieve generalizability across populations (i.e. community participants, individuals with personality pathology and their significant others) and sampling frames (i.e. daily and momentary data on emotions). In order to establish the incremental information of IADs, we controlled statistically for redundancies with mean level and general variability of an emotional process by using residual variables. More specifically, the SD statistics had scale means (i.e. residual variable Type I) and more complex IADs had scale means and SDs partialed out (i.e. residual variable Type II). As a result, our residual variables captured the individuals’ relative score in relation to what would be expected, given the individuals’ mean (and variability) on affect scales.
Method
Participants
Participants who completed at least 20 consecutive measurement occasions 1 were selected for the current analyses, resulting in N total participants = 1192 and t total occasions = 51 278. Big five personality traits at baseline were assessed in all samples. A detailed overview of sample characteristics is given in Table 1.
The inclusion criterion of 20 measurement occasions is a common, yet arbitrary, threshold.
Sample characteristics
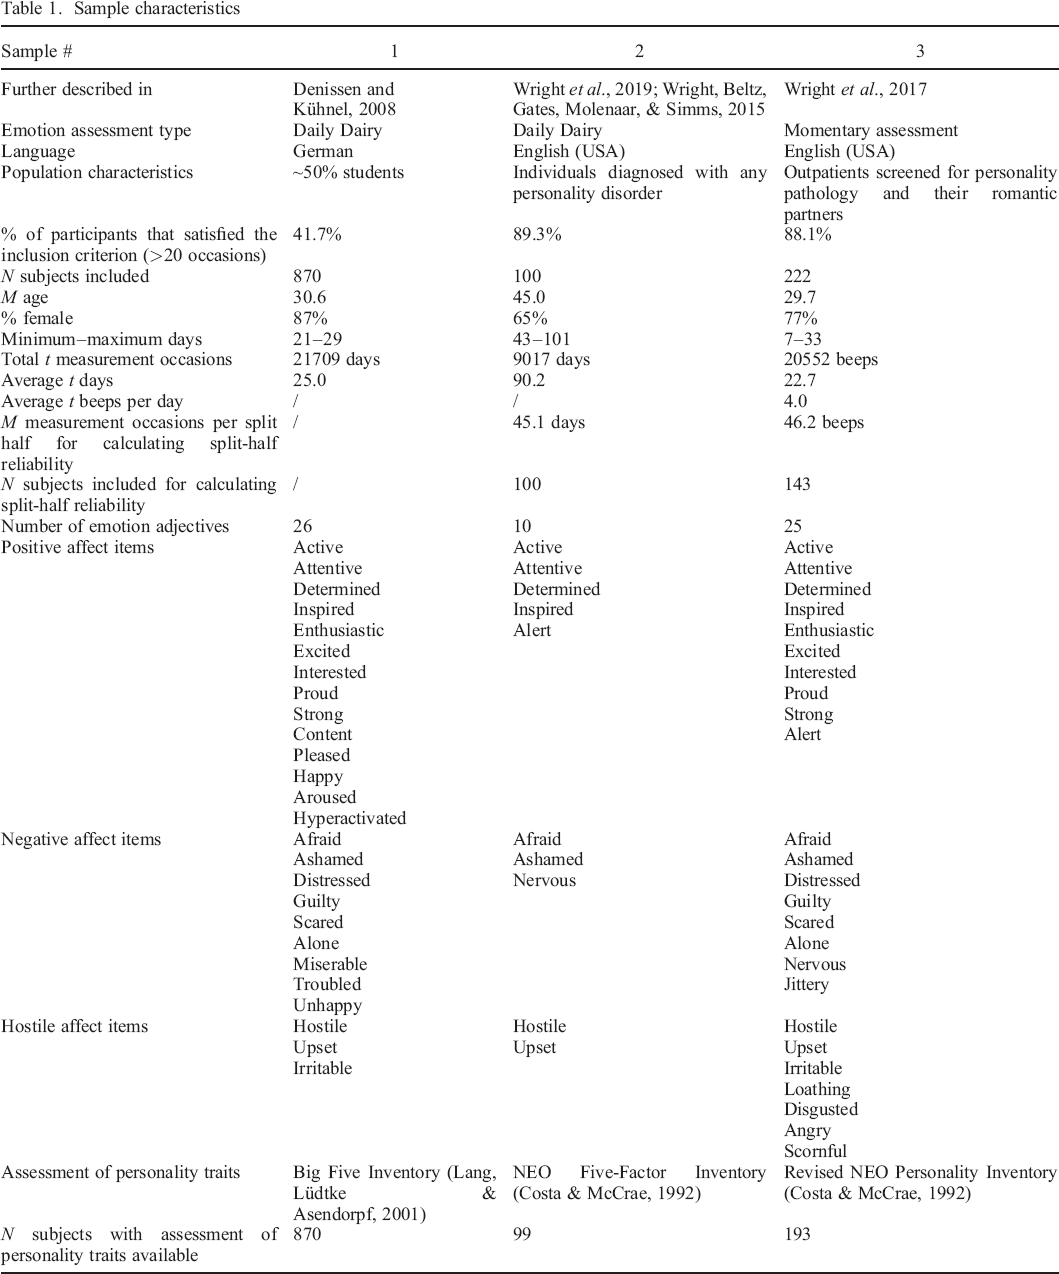
The first sample was based on the Berlin Diary Study (Denissen & Kühnel, 2008). Participants received daily questionnaires containing retrospective measurement of affect over 30 days that were filled out before going to bed. The second sample (Wright et al., 2019) included individuals with a personality disorder diagnosis who completed daily retrospective assessments of affect over 100 days. The third sample (Wright et al., 2017) consisted of dyads who completed a 21–day period of ecological momentary assessment (3.7 assessments per day on average) including individuals who were engaged in outpatient psychiatric treatment and their significant others. In Sample 3, momentary affect was assessed multiple times a day following social interactions (i.e. event–contingent assessment).
Measures
Daily and Momentary Emotions
Emotion adjectives were used to assess daily and momentary affect. In Sample 1, participants were asked to indicate to what degree emotions were descriptive of how they generally felt today on a 5–point scale, ranging from 0 (not at all) to 4 (extreme). In Sample 2, participants were asked about the extent to which they had felt this way over the past 24 hours on a 5–point scale, ranging from 0 (very slightly) to 4 (extremely). In Sample 3, participants were asked multiple times a day to rate their momentary emotions on a 5–point scale ranging from 1 (very slightly or not at all) to 5 (extremely). IADs were calculated for scales of PA, NA, and hostile affect (HA), as those were consistently identified across samples (see Results section). The included emotion adjectives are enlisted in Table 1.
Personality Traits
In all samples, we assessed the big five personality traits (i.e. openness to new experiences, conscientiousness, extraversion, agreeableness, and neuroticism). In Sample 1, the German version of the Big Five Inventory (Lang et al., 2001) was used. Participants rate 42 statements on a 5–point scale ranging from 1 (strongly disagree) to 5 (strongly agree). In Sample 2, the 60–item NEO Five–Factor Inventory (Costa & McCrae, 1992) was used. In Sample 3, the Revised NEO Personality Inventory (Costa & McCrae, 1992), consisting of 240 items, was used. For the latter two NEO instruments, items were rated on a 5–point scale ranging from 0 (strongly disagree) to 4 (strongly agree).
Statistical Analysis
Selection and Computation of Iads
Affect scales were included for calculating IADs when they aligned with within–person factors identified by multilevel exploratory factor analysis (ML–EFA; Reise, Ventura, Nuechterlein, & Kim, 2005). The ideal number of within–person factors was selected with respect to interpretability and a combination of model fit indices, including the comparative fit index (CFI), root mean square error of approximation (RMSEA), and the models’ improvements in level–specific fit using standardized root mean square residual (SRMR–within and SRMR–between; Kim, Dedrick, Cao, & Ferron, 2016).
The included IADs comprised univariate statistics (Jahng et al., 2008) and model–based statistics (Epskamp et al., 2018). The calculation of univariate IADs was based on rescaled affect scores with values ranging from 0 to 10 for facilitating cross–sample comparisons. Univariate IADs included individual scale mean (M), SD, MSSD, and the average item intercorrelation (
The full results on network model parameters (i.e. fixed effects, random effect variances) will be made available by the corresponding author upon request.
Structure of Indicators of Affect Dynamics
Several analytic steps were taken to delineate the structure of the 30 calculated IADs and elucidate their potential redundancies. First, we used parallel analysis and visual inspection of the scree plot (i.e. elbow criterion).
3
Second, the Spearman correlation matrix of IADs was used to extract varimax rotated principal components.
4
Third, we investigated IADs’ particular overlap with affect Ms and SDs using the multiple correlation coefficient (R). For emotional variability statistics (i.e. SD, SDc), we computed their multiple correlation with means, and for more complex statistics (i.e. MSSD, MSSDc,
Exploratory factor analysis was considered; however, solutions had bad fit or did not converge.
Quartimin rotation was considered and produced similar results.
Split–Half Reliability
Split–half reliability was used to evaluate whether IADs consistently measure the same constructs at the between–person level (e.g. Mejía, Hooker, Ram, Pham, & Metoyer, 2014). To this end, residualized IADs were calculated separately based on time series including only odd or even days, and correlations between split–halves were computed. The correlations between split–halves were then corrected using the Spearman–Brown prophecy formula in order to derive reliability estimates of the IADs based on the complete time series (rsb). In Sample 2, split–half intervals consisted of 45.1 days on average (odd days = 44.5, even days = 45.7). In Sample 3, split–half intervals consisted of 11.4 days and 46.2 momentary occasions on average (odd days = 44.1, even days = 48.4). Split–half reliability was not calculated in Sample 1, as fewer measurement occasions per person were available. Reliability was regarded as low (∼.50), moderate (∼.70), or high (∼.90).
Associations with Personality Traits
The incremental validity of IADs was evaluated by their bivariate correlations with self–report measures of personality traits using residual variables. Pearson correlations were calculated and Fisher z–transformed in each sample separately, before integrating them in a random effects meta–analysis. In the current study, significant meta–analytic correlations indicate that IADs are incrementally associated with big five personality traits (i.e. across populations and sampling frames) beyond mean level and general variability of affect.
Software Packages
Openly accessible R scripts and data are provided that allow reproduction of the reported statistical analyses at https://osf.io/6ghcx/. All analyses were executed with the statistical environment R version 3.6.1 (R Core Team, 2019). ML–EFA was estimated using the WLSMV estimator and oblique geomin rotation in Mplus 8.0 (Muthén & Muthén, 2018). SDc and MSSDc were calculated using the relativeVariability package version 1.0 (Mestdagh et al., 2018). Principal components, scree plots, and parallel analysis were computed by the psych package version 1.8.18 (Revelle, 2018). Multilevel dynamic networks were estimated by the mlVAR package version 0.4.3 (Epskamp, Deserno, & Bringmann, 2019). Random effects meta–analysis was estimated by the metafor package version 2.1–0 (Viechtbauer, 2010).
Results
Selection of Affect Dimensions
Considering both fit and interpretability, ML–EFA solutions were retained that indicated five (Sample 1) or three within–person factors (Samples 2 and 3) achieving acceptable fit, RMSEA ≤ .044, CFI ≥ .929, SRMR–within ≤ .039. PA, NA, and HA were consistently identified in all samples and were therefore used for calculating IADs. Additional factors were identified (i.e. factors of tiredness and calmness) but were not considered for calculating IADs, as those were only present in Sample 1. Further information on ML–EFA models are displayed in the supporting information (see Table S1 for fit statistics and Tables S2–S4 for the estimated within–person factor loadings).
Descriptive Statistics
Median, IQR, and skew of raw IADs are displayed in Table 2. Individual mean of affect was high for PA as compared to NA and HA, indicating that individuals tended to report positive emotions more often than negative emotions. Greater positive skew was observed in NA and HA distributions. MSSD statistics had positive skew across the included affect scales (>1.24). Median of the average item intercorrelation of affect scales (i.e.
Note that the HA scale comprised only two emotion adjectives (i.e. hostile, upset) in Sample 2.
Median, interquartile range, and skew of raw IADs
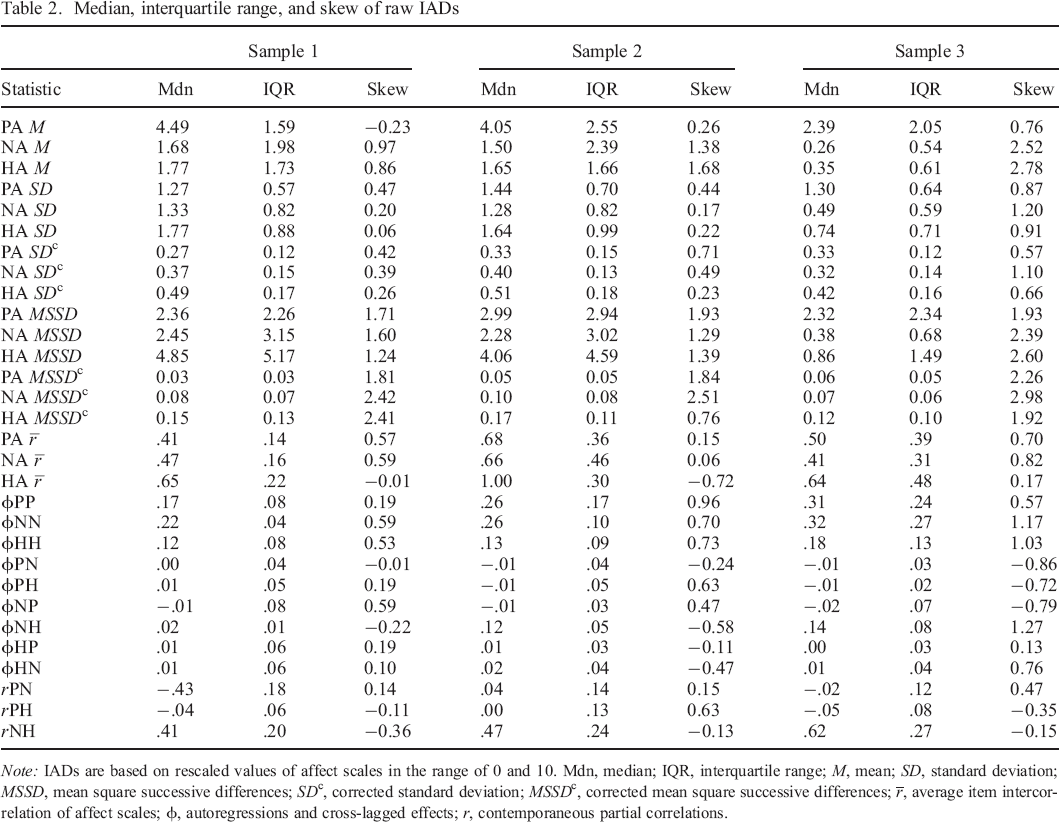
Note: IADs are based on rescaled values of affect scales in the range of 0 and 10. Mdn, median; IQR, interquartile range; M, mean; SD, standard deviation; MSSD, mean square successive differences; SDc, corrected standard deviation; MSSDc, corrected mean square successive differences;
Median of individual autoregressive parameters was ranging from .12 (small) to .32 (large), indicating that affects carried over to the next day/moment for the average individual. IQR of individual autoregressive parameters was small to moderate in daily data (IQR = .04–.17) and small to large in momentary data (IQR = .13–.27). Median of individual cross–lagged parameters was small (Mdn = −.02–.02), except for ϕNH, for which small–to–moderate median was observed in Sample 2 (Mdn = .12) and Sample 3 (Mdn = .14). Individual cross–lagged effects had small IQR, IQR = .01–.08. Median of individual contemporaneous partial correlation between NA and HA was large (Mdn = .41–.62), and IQR was moderate to large, IQR = .20–.27. Median of individual contemporaneous partial correlation between PA and NA was negative in Sample 1 (Mdn = −.43, IQR = .18) and close to zero in Sample 2 (Mdn = .04, IQR = .14) and Sample 3 (Mdn = −.02, IQR = .12). Median of individual contemporaneous partial correlation between PA and HA was close to zero (Mdn = −.05–.00) and IQR was small, IQR = .06–.13. Similar distributions of individual random effects were obtained for odd and even days when compared against the networks that were calculated using the complete data (e.g. rNH in Sample 2, complete data: .47, odd days: .47, even days: .45; ϕHH, complete data: .13, odd days: .13, even days: .17).
Structure
Parallel analysis indicated seven components in Sample 2 and nine components in Samples 1 and 3. Visual inspection of scree plots was inconclusive because there were no clear drops in eigenvalues. We base our interpretation of the structure of IADs on the seven–component resolution as it represented the greatest common denominator across samples. Figure 1 provides a sparse graphical display of the varimax rotated principal components. Commonalities were found between univariate IADs of PA (Sample 1, C1; Sample 2, C6; Sample 3, C3, C5), indicating that those tended to be interrelated. Univariate IADs of NA and HA were reflected in several principal components (Sample 1, C2, C5, C7; Sample 2, C1, C2; Sample 3, C1, C2). Temporal effects including autoregressive and cross–lagged parameters formed additional principal components (Sample 1, C3, C4, C6; Sample 2, C3, C4, C5; Sample 3, C4, C7). The average item intercorrelation of affect scales formed principal components in Sample 2 (C7) and Sample 3 (C6).
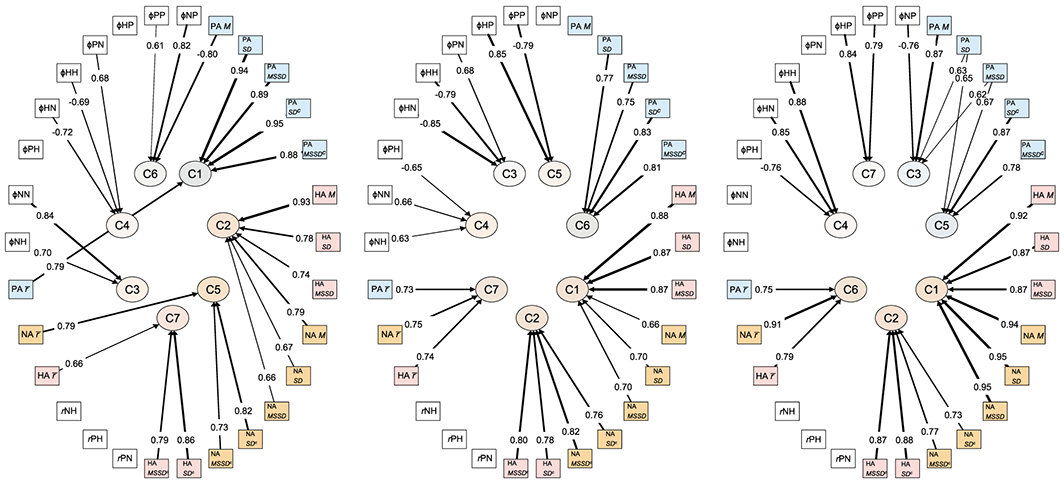
Varimax rotated components of IADs across samples. Component loadings < .60 are suppressed. PA, positive affect; NA, negative affect; HA, hostile affect; M, mean; SD, standard deviation; MSSD, mean square successive differences; SDc, corrected standard deviation; MSSDc, corrected mean square successive differences;
Figure 2a–c shows variance decompositions of IADs by sample, indicating the particular degree to which variation in IADs was accounted for by scale means and SDs. 6 Generally, scale means and SDs shared plenty of common variance with the more complex IADs, including autoregressions, cross–lagged effects, and contemporaneous partial correlations, thus, highlighting the need to consider these redundancies for extracting their more unique information.
The total variance was decomposed into the part of variance explained by scale means (i.e. the squared multiple correlation with scale means), the part of variance explained by scale standard deviations beyond what had already been explained by scale means (i.e. the squared multiple correlation with scale means and scale standard deviations minus the squared multiple correlation with scale means), the unique variance that was reliable (i.e. split–half reliability of the residualized variable), and the unique variance that was not reliable (one minus the sum of the aforementioned variance parts).
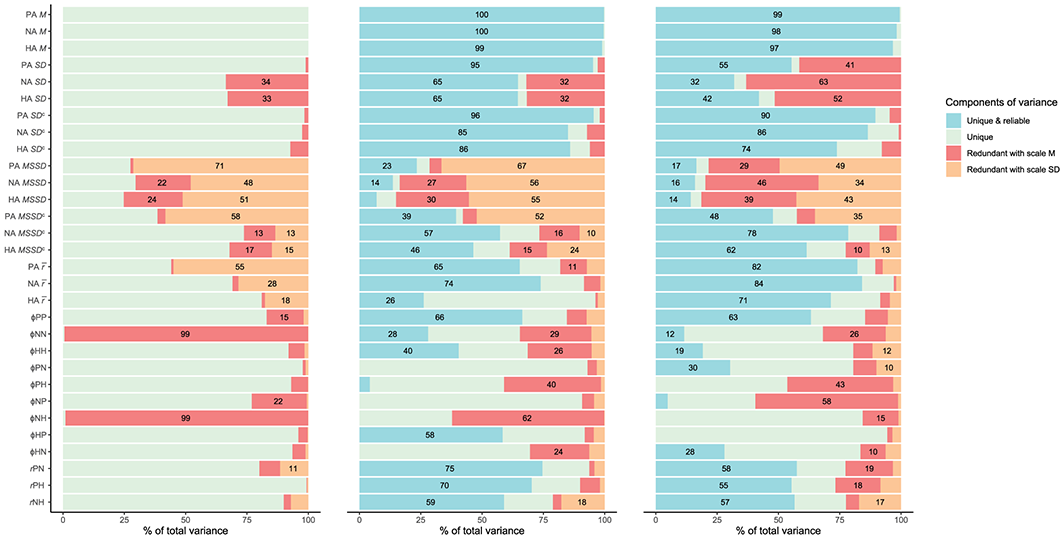
(a–c) Variance decomposition of IADs. From left to right Samples 1–3 are depicted. PA, positive affect; NA, negative affect; HA, hostile affect; M, mean; SD, standard deviation; MSSD, mean square successive differences; SDc, corrected standard deviation; MSSDc, corrected mean square successive differences;
Split–Half Reliability
Figure 2b–c displays the estimated variance of IADs that was unique and reliable in Samples 2 and 3 as fractions of the total variance observed. These estimates align with the split–half reliability of residualized IADs (see Figures S1 and S2). Split–half reliability of raw IADs is reported in Table S5. Individual M of affect scales was highly reliable, rsb = .94–.99. Residualized SD and SDc had moderate–to–high reliability (SD, rsb = .77–.96; SD
c
, rsb = .67–.95), indicating that those tend to reliably capture incremental features of emotional time series beyond mean of affect. Partialing out scale means and SDs tended to reduce the split–half reliability of more complex IADs, indicating that their reliability estimates were inflated because of redundancies with M and SD. For example, the split–half reliability of PA MSSD decreased from .92 to .69 in Sample 2 and the split–half reliability of ϕNP decreased from .75 to .06 in Sample 3. Nevertheless, some residualized IADs achieved moderate–to–high reliability (e.g. MSSD and MSSDc, rsb = .61–.88). The reliability of residualized HA MSSD was low in Sample 2, rsb = .31. The residualized average item intercorrelations of affect scales had moderate–to–high reliability, rsb = .64–.85, except for HA
Associations with Personality Traits
Figure 3 displays meta–analytic estimates for the bivariate associations between residualized IADs and personality traits. Tables S6–S7 display sample–specific results for raw and residualized IADs. More desirable mean level of affect (i.e. high PA, low NA, and HA) were associated with extraversion (PA M, r = .32; NA M, r = −.24; HA M, r = −.14) conscientiousness (PA M, r = .23; NA M, r = −.20; HA M, r = −.20), agreeableness (PA M, r = .11; NA M, r = −.16; HA M, r = −.26), and openness (PA M, r = .16). Less desirable mean level of affect were associated with neuroticism (PA M, r = −.26; NA M, r = .39; HA M, r = .30). When controlling for mean level of affects, greater PA variability and NA variability were incrementally associated with openness (PA SD, r = .15; PA SDc, r = .13; NA SD, r = .06; NA SDc, r = .06) and extraversion (PA SD, r = .15; PA SDc, r = .14; NA SDc, r = .08). Lower PA variability was incrementally associated with agreeableness (PA SDc, r = −.07). The residualized statistics of NA and HA variability (SD), but not SDc, were incrementally associated with neuroticism (NA SD, r = .17; HA SD, r = .15).
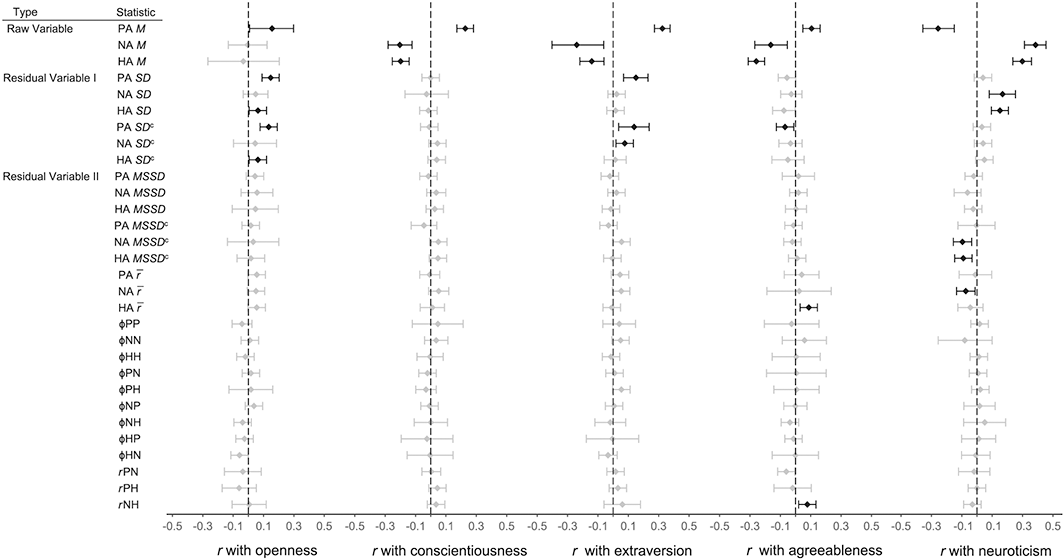
Meta–analytic estimates of the bivariate correlations between residualized IADs and big five traits. Residual variable type I were residualized for scale means. Residual variables type II were residualized for scale means and standard deviations. r, meta–analytic estimate of the bivariate correlation; PA, positive affect; NA, negative affect; HA, hostile affect; M, mean; SD, standard deviation; MSSD, mean square successive differences; SDc, corrected standard deviation; MSSDc, corrected mean square successive differences;
The bivariate correlations between more complex IADs and personality traits were of smaller size when residual variables were used, indicating that non–specific associations were induced by redundancies with M and SD. For example, the correlation between NA SD and neuroticism decreased from .22 to −.04 (Sample 1), and the correlation between ϕNN and neuroticism decreased from .16 to −.02 (Sample 1). Notwithstanding, some incremental associations between more complex IADs and personality traits were found that reached statistical significance (p < .05). After controlling for scale means and SDs, lower NA instability and HA instability were incrementally associated with neuroticism (NA MSSDc, r = −.10; HA MSSDc, r = −.09). A less differentiated reporting of hostile states was incrementally associated with agreeableness (HA
Remember that the contemporaneous partial correlation rNH of the average individual was large, .41–.61.
Discussion
Failed tests of incremental validity of more complex IADs raised doubt about their validity and usefulness for studying affect dynamics (Dejonckheere et al., 2019). The current study extends the body of evidence by providing a comprehensive analysis of their structure, split–half reliability, and association with personality traits. In line with earlier results, more complex IADs exhibited substantial redundancies with mean level and general variability of emotions. When these redundancies were controlled statistically, the reliability and validity coefficients of more complex IADs shrunk, and in some cases, they became small or non–significant, indicating that many of the more complex IADs convey limited incremental information on affect dynamics using the current assessment practices.
Structure of Indicators of Affect Dynamics
The covariance structures of IADs elucidated similar patterns of redundancy in the included samples, showing that many of the more complex IADs exhibit marked redundancies with mean level and general variability of emotional time series. Our analyses indicate that additional redundancies may exist beyond of that, as was exemplified by principal components that summarized additional common variance between IADs related to emotion differentiation (i.e.
We discuss possible reasons for the observed redundancies. The statistical overlap between individual M and SD of affect scales was of higher magnitude when the underlying emotion distributions exhibited greater skew, which was the case for negative emotions, hostile emotions, and when affects were measured using momentary assessment. This points to the fact that M and SD are mathematically interdependent in skewed distributions. The redundancies found between MSSD and SD indicate that their raw forms capture similar constructs at the between–person level, that is, general variability. This is not surprising considering that both SD and MSSD may serve as global indices of dispersion (Jahng et al., 2008). However, the residualized form of MSSD and MSSDc that were used in the current study should have a different interpretation, because their statistical redundancies with M and SD were partialed out (i.e. 10–85% of variance). Thus, the residualized MSSD should mainly reflect the temporal dependency of consecutive measurement occasions, similar to the autoregressive parameter. Thereby, the residualized MSSDc may delineate a continuum that ranges from emotional instability (i.e. high values) to emotional inertia (i.e. low values).
We have no explanation for the divergent pattern of redundancy with respect to the average item intercorrelation of affect scales (i.e. PA
Network parameters (i.e. autoregressions, cross–lagged effects, and contemporaneous partial correlations) exhibited redundancies primarily with M, some of those were extremely large (i.e. ϕNN and ϕNH in Sample 1). This may be unintuitive, as the networks were estimated using within–person centered variables. However, within–person centering does not change the variance and shape of individual state affect distributions, and, as noted above, many of the affect scales showed little variance (i.e. small IQR) and were skewed, especially the negative items. Thus, the well–known associations between the mean and variability and the role of variance restriction serve as the likely explanation for the observed redundancies between network random effects and individual M (including redundancies of ϕNN and ϕNH in Sample 1). Indeed, this has been an issue that has plagued the psychological network literature, which has often found that many of the most conceptually interesting statistics are highly dependent on observed variances in real world data (Rodebaugh et al., 2018).
Split–Half Reliability of Indicators of Affect Dynamics
In line with prior research, mean and variability of affects had high reliability indicating that those consistently measure the same constructs at the between–person level. Some of the more complex IADs were moderately reliable (e.g. MSSDc,
Temporal effects (i.e. autoregressions and cross–lagged effects) tended towards having very poor or no reliability (except for ϕPP). This suggests that those are not valid IADs for between–person research using the current assessment practices. Considering that most temporal effects yielded little random effect variances, it seems quite plausible that, in some cases, sampling variation and statistical redundancies may occasionally account for the total of their variance. One reason for the unreliability of some IADs could be that the indicators used here (i.e. the selected pool of emotions items) are not optimal or that measurement occasions were too few. Another reason could be that some IADs reflect more volatile psychological conditions that fluctuate rapidly (e.g. because of contextual factors; e.g. Koval & Kuppens, 2012). This would suggest that their assessment should be based on different assessment frames (e.g. more frequent assessments within a smaller time frame) or that such IADs should be better studied under more controlled conditions (e.g. experimental designs; Dejonckheere, Mestdagh, Kuppens, & Tuerlinckx, 2020).
Associations between Indicators of Affect Dynamics and Big Five Personality Traits
Our findings indicate that big five personality traits are characterized by distinct pattern of affect dynamics that primarily encompass individual differences in Ms and SDs of PA, NA, and HA. Mean affect had correlations with personality traits that were in line with prior research (e.g. Ching et al., 2014; Howell, Ksendzova, Nestingen, Yerahian, & Iyer, 2017; Watson & Clark, 1999), indicating that more adaptive configurations of personality traits (i.e. emotional stability, openness, conscientiousness, agreeableness, and extraversion) are robustly related to more desirable emotional experiences (i.e. high PA, low NA, low HA).
Positive affect variability was positively associated with extraversion and openness. Given that greater variability of positive emotions was a substantive characteristic of extraverted and open individuals, one could speculate that it reflected the exploratory nature of these traits, in other words, a greater tendency to seek potentially rewarding situations (i.e. greater sensitivity to rewards; DeYoung, 2015). This ‘high risk high reward’ strategy could result in greater variability in the achievement of rewards, and thus, in greater variability of experiencing positive emotions. In contrast, individuals high in agreeableness had less variability but higher mean level of PA. This is notable, because it indicates that personality traits are differentially associated with mean affect and variability, and thus, it provides evidence for their divergent nomological patterns. A competing account of variability measures argues that those might reflect extreme responding (Baird, Lucas, & Donnellan, 2017), which is the tendency to choose more extreme response categories in self–report questionnaires. However, extreme responding has been mainly associated with high extraversion and high conscientiousness (Austin, Deary, & Egan, 2006), indicating that the current results might not be sufficiently explained by this type of method bias. In the current study, neuroticism did not show consistent incremental associations with greater negative emotional variability, because although SD reached statistical significance, SDc did not. This corroborates findings from a recent meta–analysis (Kalokerinos et al., 2020). On the one hand, the relative indices used here (i.e. SDc, MSSDc) may be superior for deriving the more unique information about emotional variability and emotional instability in the presence of non–linear dependencies (Mestdagh et al., 2018). On the other hand, it may be, though, that they overcorrect in skewed distributions thereby reducing their validity, and other methods for accounting for the association between mean and variability should be considered in future work.
Some incremental associations were found between more complex IADs and personality traits. Lower instability of negative and hostile emotional states (i.e. NA MSSD
c
, HA MSSD
c
) was observed in individuals high in neuroticism. With respect to our interpretation of the residualized MSSDc that was discussed earlier, this finding suggests that individuals high in neuroticism might be more resistant to change in negative emotional states; thus, adding to the body of conflicting results on how fluctuations in negative emotions are linked to neuroticism–related constructs (also known as the ‘instability–inertia paradox’, e.g. Bos et al., 2019; Bosley, Soyster, & Fisher, 2019; Koval, Kuppens, Allen, & Sheeber, 2012; Koval et al., 2013). Furthermore, a more differentiated reporting of negative emotions (i.e. NA
Limitations
The current study has some important limitations with respect to the samples, the measurement of emotions, the intensive longitudinal designs, the methods for assessing personality traits, and the statistical analyses. First, our study might have compared ‘apples and oranges’ by drawing inferences across samples that were diverse in terms of sampling frames (i.e. daily and momentary emotion data), instruments used, and populations investigated. We regard this limitation a strength, as the heterogeneity across samples contributes to greater generalizability (Yarkoni, 2019). Second, the pool of emotions used might not completely span the affective space. Third, with regard to the involved intensive longitudinal designs, Sample 1 might contain too few measurement occasions for deriving a reliable assessment of network parameters (i.e. 20–30 consecutive measurements per person in Sample 1). Moreover, measurement burst designs (Stawski, MacDonald, & Sliwinski, 2015) can inform researchers about the trait status of IADs, by investigating their stability over more widely spaced temporal intervals, because stability is usually demonstrated over longer periods of time (i.e. 1–2 years) than were used in the current study. Also, IADs might exhibit stronger incremental validity when studied under more controlled contextualized conditions (e.g. experimental designs or event–contingent assessment) because of potentially preferable signal–to–noise ratio (Dejonckheere et al., 2020; Lapate & Heller, 2020). Fourth, we only had access to concurrent self–reported personality data. Some of the dynamic indices could be stronger related to personality facets or nuances, future personality or personality change, informant reports (Finnigan & Vazire, 2018), or digital footprints of personality (Hinds & Joinson, 2019).
Fifth, our study did not model measurement error. Generally, unmodelled measurement error might have attenuated the reliability and validity estimates of IADs (Rouder & Haaf, 2019; Schuurman & Hamaker, 2019). Error may have been introduced when calculating IADs based on daily/momentary affect scores that may not be perfectly reliable measures of state affect. Measurement error might have led to a downward bias of network parameters in particular (Schuurman, Houtveen, & Hamaker, 2015). Error variance may further accumulate when calculating residualized IADs based on affect means and standard variability that may not be perfectly reliable measures of trait affect and emotional variability. Thereby, validity estimates may be biased when residualized IADs are insufficiently cleared of their redundancies with mean level and general variability (Westfall & Yarkoni, 2016), but this might also occur in the presence of non–linear dependencies (Mestdagh et al., 2018). Further limitations of our statistical approach were that we did not consider alternative approaches that differ in their assumptions or estimation techniques (e.g. dynamic structural equation modelling, Asparouhov, Hamaker, & Muthén, 2018; Geukes et al., 2017; Kuppens, Oravecz, & Tuerlinckx, 2010; Loossens et al., 2019) and that we did not model the dyadic data structure in Sample 3 for calculating IADs.
Conclusions
The current study highlights that observed links between IADs and other constructs might be non–specific, as arising from redundancies between them. More specifically, in research settings in which affect dynamics are linked to between–person constructs, researchers should rule out more parsimonious explanations (e.g. trait affect, affect variability) before attributing incremental value to more complex IADs. Occasionally, researchers have strived for trait interpretations of IADs—explicitly or implicitly (i.e. by investigating or theorizing on their associations with relatively stable traits as was done in the current study). Our results demonstrate that there is scarce evidence for trait interpretations of many of the more complex IADs with respect to their low reliability und unknown stability.
More generally, researchers should consider the limited validity of IADs for research questions at the between–person level, as their reliability might be low, and any true effects might be obscured or attenuated. Notwithstanding, some of those more complex IADs had unique and somewhat reliable variance, including IADs with respect to emotion differentiation (e.g. r¯, contemporaneous partial correlations) and emotional instability (e.g. MSSDc). For those, small but incremental associations with personality traits were found. These results point out to the possibility that such IADs might contain substantive between–person variance that may be of interest to researchers for studying individual differences, albeit they may not always meet standard psychometric criteria (Wright & Zimmermann, 2019). The current assessment practices might need refinement in order to further improve the validity of more complex IADs, for example, by increasing the frequency or duration of emotion assessment. However, it is questionable whether a more intensive or longer enduring assessment would be practically feasible, as longer time frames may increase burden of participation and lead to higher non–compliance rates (Eisele et al., 2020). More research is needed for identifying the conditions under which affect dynamics can be assessed most validly.
Supporting Information
Supporting Information, per2277-sup-0001 - Indicators of Affect Dynamics: Structure, Reliability, and Personality Correlates
Table S1. Fit Statistics of Multi‐Level Exploratory Factor Models (Geomin Rotation) by Sample
Table S2. Geomin Rotated Factor Loadings by ML‐EFA in Sample 1
Table S3. Geomin Rotated Factor Loadings by ML‐EFA in Sample 2
Table S4. Geomin Rotated Factor Loadings by ML‐EFA in Sample 3
Table S5. Split‐half Reliability of Raw IADs in Sample 2 and Sample 3
Table S6. Bivariate Correlations between Raw IADs and Big Five Traits by Sample
Table S7. Bivariate Correlations between Residualized IADs and Big Five Traits by Sample
Figure S1. Split‐half Reliability of IADs in Daily Data (Sample 2).
Figure S2. Split‐half Reliability of IADs in Momentary Data (Sample 3)
Supporting Information, per2277-sup-0001 for Indicators of Affect Dynamics: Structure, Reliability, and Personality Correlates by LEON P. WENDT, AIDAN G.C. WRIGHT, PAUL A. PILKONIS, WILLIAM C. WOODS, JAAP J.A. DENISSEN, ANJA Kühnel and JOHANNES ZIMMERMANN, in European Journal of Personality
Supporting Information
Supporting Information, per2277-sup-0001 - Indicators of Affect Dynamics: Structure, Reliability, and Personality Correlates
Supporting info item
Supporting Information, per2277-sup-0001 for Indicators of Affect Dynamics: Structure, Reliability, and Personality Correlates by LEON P. WENDT, AIDAN G.C. WRIGHT, PAUL A. PILKONIS, WILLIAM C. WOODS, JAAP J.A. DENISSEN, ANJA Kühnel and JOHANNES ZIMMERMANN, in European Journal of Personality
Supporting info item
Footnotes
Supporting Information
Additional supporting information may be found online in the Supporting Information section at the end of the article.