
Abstract
This research investigated the congruence between the ideologies of political parties and the ideological preferences (N = 1515), moral intuitions (N = 1048), and political values and worldviews (N = 1345) of diverse samples of Swedish adults who voted or intended to vote for the parties. Logistic regression analyses yielded support for a series of hypotheses about variations in ideology beyond the left–right division. With respect to social ideology, resistance to change and binding moral intuitions predicted stronger preference for a social democratic (vs. progressive) party on the left and weaker preference for a social liberal (vs. social conservative or liberal–conservative) party on the right. With respect to political values and broader worldviews, normativism and low acceptance of immigrants predicted the strongest preference for a nationalist party, while environmentalism predicted the strongest preference for a green party. The effects were generally strong and robust when we controlled for left–right self–placements, economic ideology, and demographic characteristics. These results show that personality variation in the ideological domain is not reducible to the simplistic contrast between ‘liberals’ and ‘conservatives’, which ignores differences between progressive and non–progressive leftists, economic and green progressives, social liberal and conservative rightists, and nationalist and non–nationalist conservatives.
It is impossible to understand a person's pursuit of meaning and goals in life—to really know him or her deep down—without taking his or her beliefs, values, moral convictions, life–story narratives, and broader worldview into consideration (McAdams, 1995; McAdams & Pals, 2006; Nilsson, 2014b). These characteristics are important aspects of personality in their own right. They make up the layer of personality that makes us all uniquely human, which may be the last to reach maturity (McAdams & Olson, 2010). In adulthood, they exhibit levels of heritability, stability, and universality that are comparable with those of dispositional traits (Kandler, Zimmermann, & McAdams, 2014; Saucier et al., 2015), and they have unique effects on behaviour and life outcomes (e.g. Bardi & Schwartz, 2003; Bond, Leung, Au, Tong, & Chemonges–Nielson, 2004; Chen et al., 2016).
This layer of personality is in turn intertwined with political orientation. This is true particularly in modern democratic societies that offer a plurality of political choices and rely on citizens to express their personal preferences. In these contexts, socio–demographic factors, such as income, education, and occupation, which have traditionally accounted for much of the variation in political choices, have receding importance, while personality characteristics have increasing importance (Caprara & Vecchione, 2017; Johnston, Lavine, & Federico, 2017; Piurko, Schwartz, & Davidov, 2011; Schwartz et al., 2014). A rich body of research, drawing on several different research programmes in personality and social psychology, has demonstrated that leftists and rightists differ robustly in terms of their beliefs, values, moral priorities, and socio–political attitudes (Caprara, Schwartz, Capanna, Vecchione, & Barbaranelli, 2006; Duckitt & Sibley, 2009; Graham, Haidt, & Nosek, 2009; Schwarz, Caprara, & Vecchione, 2010).
Nevertheless, the fact that research in this area has traditionally often relied on a simple contrast between ‘liberals’ (or leftists) and ‘conservatives’ (or rightists) is a significant limitation. While some countries do have bi–party systems that pit liberals against conservatives (e.g. Democrats vs. Republicans in the USA), many others have multi–party systems, in which voters are confronted with an ideological smorgasbord containing, for instance, socialist, social democratic, green, feminist, social liberal, libertarian, social conservative, and nationalist parties. The competing ideologies provide a wide range of different interpretations of social events and visions about the proper order of society that cannot be reduced to a dichotomy between ‘liberalism’ and ‘conservatism’ (Freeden, 2010). Given that political orientations are the result of interplay between psychological processes and elite ideological discourse (Caprara & Vecchione, 2018; Johnston et al., 2017; Jost, Federico, & Napier, 2009; Verhulst, Hatemi, & Eaves, 2012), this distinction likely also fails to adequately characterize the structure of political orientations.
Some scholars have sought to capture the complexities of political orientations by dividing the left–right (or liberal–conservative) dimension into one dimension focused on economic equality and one focused on traditional social issues (Feldman & Johnston, 2014; Gerber, Huber, Dowling, & Ha, 2010; Johnston et al., 2017). Recent studies have revealed that a combination of left–wing attitudes in the economic sphere and right–wing attitudes in the social sphere is common, particularly in post–communist, traditional, and low–development nations, and among individuals with low political engagement and strong needs for security and certainty (Malka, Lelkes, & Soto, 2017; Malka, Soto, Inzlicht, & Lelkes, 2014). Recent studies have also identified distinct classes of liberals and conservatives in the USA, including libertarians, moderates, social conservatives, secular liberals, religious liberals, consistent liberals, and consistent conservatives, with unique patterns of issue preferences and moral intuitions (Feldman & Johnston, 2014; Haidt, Graham, & Joseph, 2009; Iyer, Koleva, Graham, Ditto, & Haidt, 2012; Weber & Federico, 2013). Yet another line of research has investigated the variability in values among left and right wingers (Hanel, Zarzeczna, & Haddock, 2018; Van Hiel, 2012), and the associations between party preference and basic personality traits and values (Barnea & Schwartz, 1998; Schoen & Schumann, 2007; Vecchione et al., 2011), in European countries with multi–party systems.
In the current studies, we built on this body of recent research on the complexity of political orientations by investigating how ideologically relevant personality characteristics are reflected in party preferences in the multi–party context of Sweden. Party preferences are interesting for personality psychologists because they are closely related to voting, which is a form of behaviour with undeniable importance in democratic states, and because they can help us to map ideologies onto the personalities of the individuals they attract. Past research suggests both that party preferences depend on the extent to which people resonate with the messages, ideologies, and policy positions of different parties (Jost, 2009; Schoen & Schumann, 2007; Schwarz et al., 2010; Vecchione et al., 2011) and that socialized partisanship can make people align their ideological preferences to the positions of the parties they affiliate with (Bankert, Huddy, & Rosema, 2017; Malka & Lelkes, 2010). What matters to the current purposes is that either process can account for a congruence between the ideological positions of parties and their supporters without requiring us to assume that people are able to explicitly describe the ideologies in question or coherently articulate their own ideological positions—an assumption that has long been considered unrealistic (Converse, 1964; Tomkins, 1963).
The current research extends past work in several ways. While past studies on personality and party preferences in multi–party systems have focused solely on basic values and traits, we sought to provide a more comprehensive view of ideologically relevant personality characteristics within the worldview domain, including ideological preferences, moral intuitions, political values, and broader left–wing and right–wing worldviews. We also took a richer set of political ideologies into consideration, including radical left, green, social democratic, social liberal, liberal–conservative, social conservative, and nationalist ideologies. We did this by focusing on the case of Sweden, which is a Nordic welfare state with an ideologically diverse political landscape.
Models of political orientations
We operationalized ideological preferences in terms of the framework introduced by Jost, Glaser, Kruglanski, and Sulloway (2003), which divides left–right ideology broadly into resistance (vs. openness) to change and preference for equality (vs. acceptance of inequality), suggesting that leftists are motivated to increase social, economic, and political equality and to support social change (which has, throughout history, most frequently been directed toward greater equality), whereas rightists are motivated to preserve tradition and therefore justify existing inequality (see also Jost et al., 2009). We complemented this framework with moral foundations theory (Haidt & Graham, 2007), which suggests that liberals (or leftists) are concerned with promoting fairness and preventing harm, whereas conservatives (or rightists) also intuitively moralize in–group loyalty, respect for authority, and purity. Graham et al. (2009) suggested that the conservative intuitions make up a group–focused and system–focused (‘binding’) morality that promotes social cohesion and protects the social order, whereas the liberal (‘individualizing’) intuitions protect the rights and welfare of individuals.
We also relied upon polarity theory (Tomkins, 1963), which provides a broad, integrative account of the worldview conflicts that underlie the clashes between the left and the right. On the left, this theory posits a humanist worldview, which portrays human nature as intrinsically good and valuable, urging unconditional love and warmth toward others, openness to affects and impulses, protection of human rights and well–being, and reliance on imagination, creativity, and excitement in the pursuit of knowledge. On the right, this theory posits a normativist worldview, which portrays human worth as contingent upon conformity to norms, urging discipline, punishment, respect that is contingent upon achievement, emotional restraint, maintenance of law and order, and reliance on rigorous observation and minimization of error in the pursuit of knowledge (de St. Aubin, 1996; Nilsson & Jost, 2017).
These three models converge conceptually in the sense that preference for equality, individualizing moral intuitions, and humanism involve a concern for the well–being and rights of all individuals, whereas resistance to change, binding moral intuitions, and normativism involve protection of traditions, norms, groups, and the social order. This description is also broadly consistent with other influential models of ideology than the ones we drew upon, including Duckitt's (2001) dual–process account of authoritarian and socially dominant ideological orientations and the Caprara et al. (2006) model of right (vs. left) ideology as an expression of conservation (vs. openness to change) and self–enhancement (vs. self–transcendence) values. In addition, it maps onto the distinction between the HEXACO personality traits of (low) openness and honesty–humility, which may be the primary trait bases of political attitudes (Lee, Ashton, Griep, & Edmonds, 2018; Lee, Ashton, Ogunfowora, Bourdage, & Shin, 2010).
Furthermore, the data do point toward a convergence between the models. Past studies have revealed that the individualizing moral intuitions are primarily associated with preference for equality and (low) social dominance, whereas the binding intuitions are primarily associated with resistance to change and authoritarianism (Federico, Weber, Ergun, & Hunt, 2013; Nilsson & Erlandsson, 2015). Humanism is primarily associated with the first group of constructs, whereas normativism is primarily associated with the second group of constructs (Dimdins, Sandgren, & Montgomery, 2016; Nilsson & Jost, 2017; Nilsson & Strupp–Levitsky, 2016). In addition, resistance to change is closely related to social right (vs. left) self–placement, while preference for equality is more closely related to economic left (vs. right) self–placement (Feldman & Johnston, 2014). We therefore generally expected results on the basis of the models of left–right ideology we drew upon to map onto each other, with some exceptions detailed subsequently.
Because all of the aforementioned models posit broad ideological dimensions that are tied to the left–right divide, we complemented them with a model of more specific and fine–grained political values (Schwartz et al., 2014; 2010), which are less exclusively tied to left–right ideology. Schwartz et al. (2014) most recently posited eight political values: traditional morality, blind patriotism, law and order, free enterprise, equality, civil liberties, foreign military intervention, and accepting immigrants. In the current research, we took the value of protecting the environment into consideration as well, because this value has an important role in Swedish politics.
Hypothesized ideological conflicts in Sweden
There are several reasons to expect to find a congruence between party preferences and personality characteristics in Sweden. First, multi–party systems give people more opportunities to encounter different kinds of ideologies and more incentives to educate themselves about parties and ideologies than bi–party systems do (Gordon & Segura, 1997), and Sweden currently has no less than eight parties, with different ideological positions, represented in the parliament. Second, people are more inclined to align their political positions with their underlying personality characteristics the more they are informed about politics (Johnston et al., 2017) and the more they see politics as an opportunity for self–expression (Federico & Ekstrom, 2018), and the Swedish population is highly politically knowledgeable (Milner, 2002) and strongly cherishes self–expression (Inglehart & Welzel, 2010). Third, Sweden has a notable history of peace and economic growth (Kent, 2008), which should reduce constraints of external threat on links between political positions and underlying personality characteristics (Sibley, Osborne, & Duckitt, 2012).
Sweden is also interesting because it differs from many other ‘liberal’ countries in having a social system moulded by social democratic ideology, 1 which blends elements of socialism and classical liberalism. In some respects, this puts Sweden in an intermediate ideological position between the formerly socialist regimes of Eastern Europe and those parts of the Western world that have hardly been influenced by socialism at all (of which the USA is the clearest example). It is conceivable that an aversion toward novelty and change could be recruited in the interest of protecting egalitarian values and policies in such a context (Jost et al., 2009) even though these aspects of ideology are typically negatively correlated in Western countries (Aspelund, Lindeman, & Verkasalo, 2013).
The fault line between parties that are officially on the left and the right in Swedish politics is today based primarily on the conflict between redistribution and economic freedom, while advocacy of social change and stability varies considerably within the left and the right. This division is reflected in the ideological preferences of voters. Left (vs. right) self–placement is strongly associated with preference for equality and weakly associated with low resistance to change (Aspelund et al., 2013; Cochrane & Nevitte, 2009; Nilsson & Jost, 2017). Therefore, we hypothesized that there would be associations between party preferences and social ideology (resistance to change, binding moral intuitions, normativism, and social left–right self–placement), as well as political values (protecting the environment and accepting immigrants), that are not reducible to left–right ideology (general and economic left–right self–placement, preference for equality, individualizing moral intuitions, and humanism). We focused mainly on contrasts between groups of ideologically similar parties rather than specific parties. This should, to some extent, reduce the influence of candidate preferences and idiosyncratic characteristics of parties on the results.
We summarize the core characteristics of all eight parties that are represented in the Swedish parliament in Table 1. Among the three official left–wing parties, the Social Democratic party is by far the largest. This party served as a ‘catch–all’ party and dominated Swedish politics for most of the 20th century. It shaped the Swedish system through pragmatic efforts to reconcile capitalism with a protection of the interests of the working class and a progression toward greater equality. The other left–wing parties have maintained a more system–critical and idealistic stance. 2 We therefore hypothesized that right (vs. left) position on the social ideological axis would predict preference for the Social Democratic party over one of the more radical left–wing parties over and above effects of general and economic aspects of left–right ideology.
Descriptions of parties represented in the Swedish parliament
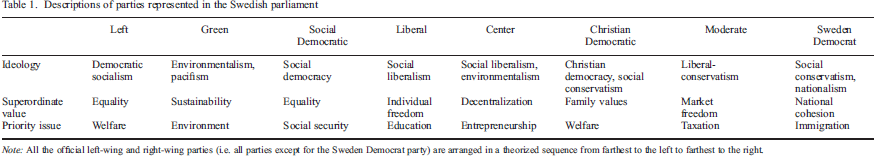
Note: All the official left–wing and right–wing parties (i.e. all parties except for the Sweden Democrat party) are arranged in a theorized sequence from farthest to the left to farthest to the right.
The Left party, which has ideological roots in communism but today subscribes to democratic socialism, is farthest to the left of all parties. It incorporates criticism of capitalism based on Marxism. The Green party, which is rooted in the peace and environmentalist movements, started out closer to centre of the left–right spectrum but subsequently moved to the left. It incorporates criticism of capitalism from a sustainability perspective. We hypothesized that the value of protecting the environment would predict preference for this party over all other parties.
Among the four right–wing parties, the two small social liberal parties called the Liberal party and the Center party are closest to the centre. Both these parties advocate an open society characterized by social equality and freedom. The Liberal party started out as a reform–friendly alternative to the Social Democratic party with a focus on defending the individual's rights and freedoms. Today, it also incorporates normativist positions on issues such as school discipline and national security. The Center party, which started out as a farmers’ union, advocates green policies, decentralization, free entrepreneurship, and generous immigration policies. Because of the social liberal progressivism of these two parties, we hypothesized that left (vs. right) position along the social ideological axis would predict preference for these parties over other right–wing parties (over and above effects of general and economic left–right ideology). One exception is that we hypothesized that normativism would predict the lowest preference specifically for the Center party among the parties on the right because of the normativist issue positions of the Liberal party.
The Moderate party is the largest of the right–wing parties. This party governed Sweden, most recently, from 2006 to 2014 in a coalition with other right–wing parties. It is rooted in ‘liberal conservatism’, which is a hybrid ideology that fuses free–market policies in the economic sphere with a defence of traditional values in the social sphere, although much of the latter part of this ideology was jettisoned in the early 21st century. It is farthest to the right in terms of prioritizing free–market policies over social and economic equality. By contrast, the Christian Democratic party, which is a small party with roots in social conservative ideology and Christian values, is farthest to the right on the social ideological dimension. Today, this party emphasizes family values and traditional moral values over religiosity per se, and it is aligned with the market liberalism of the other right–wing parties on economic issues.
Alongside the official left–wing and right–wing parties, the Sweden Democrat party, which is based on nationalist and social conservative ideology, has recently risen from obscurity to become one of the largest parties in Sweden by opposing immigration, multiculturalism, and political correctness. This party is similar to radical right populist parties in neighbouring countries, except that connections to neo–Nazi movements have tainted its early history and made collaboration with other parties difficult.
We hypothesized that right (vs. left) position on the social ideological dimension would generally predict preference for the two social conservative parties (i.e. the Christian Democratic and Sweden Democrat parties) over all other parties. At the same time, we hypothesized that normativism and (low) acceptance of immigrants would predict the strongest preference specifically for the Sweden Democrat party, which remains the only Swedish party to officially embrace an anti–immigration stance and a normativist view on the role of laws, traditions, and loyalties for civilizing human beings.
Overview of research
This research investigated the complexity of political orientations in the North–European multi–party welfare state of Sweden in terms of party preferences and a broad range of worldview characteristics relevant to political orientation. Study 1 (N = 1515) focused on ideological preferences (resistance to change and preference for equality) and left–right self–placement. Study 2 (N = 1048) focused on moral foundations (binding and individualizing intuitions) and left–right self–placement. Study 3 (N = 1345) focused on humanist and normativist worldviews, core political values, and general, economic, and social left–right self–placement.
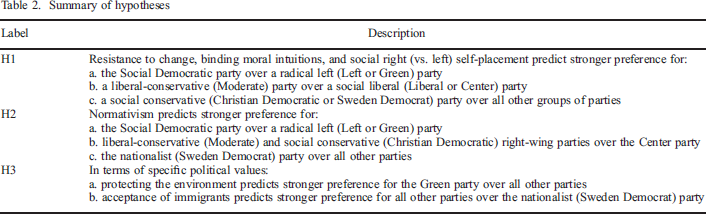
Our overarching hypothesis was that the political orientations of voters reflect a multitude of ideological conflicts between parties rather than just one general left–right (or liberal–conservative) divide. Our more specific hypotheses about ideological conflicts in Sweden (which were not pre–registered) are summarized in Table 2. We tested whether socio–demographic factors, left–right self–placement, and other aspects of left–right ideology could account for any of the effects of social ideology and core political values on party preference. If there are ideological differences between groups that are not reducible to a unitary left–right dimension (Feldman & Johnston, 2014; Malka et al., 2014; 2017), then the effects of social ideology and political values on party preference should hold up when we control for left–right self–placements and ideology. If political orientation is indeed more of an expression of personal preferences and characteristics than social background and demographic factors in modern democracies (Caprara & Vecchione, 2017; Johnston et al., 2017), then the hypothesized effects should hold up when we control for these factors as well.
Summary of hypotheses
We also performed exploratory analyses to investigate the joint effects of the main predictors and control variables on party preference, as well as the profiles of political values associated with each party. The results of additional exploratory analyses are reported in supplemental documents (see ‘SI Latent class analyses.pdf’, https://osf.io/rn3b9, for latent class analyses; see Supplementary Tables 6–16 in ‘SI Descriptives, correlations, and post hoc difference tests.pdf’, https://osf.io/p5eyz, for post hoc difference tests).
Method
Participants
The sizes of all groups of voters are shown in Table 3. The total sample sizes were determined by practical limitations. Post hoc power analyses conducted in G*Power 3.1.9 indicated that the samples gave us at least 80% power to detect effects (two–tailed) pertaining to our hypotheses in the small to medium range (0.16 ≤ d ≤ 0.30 in Study 1; 0.22 ≤ d ≤ 0.34 in Study 2; 0.18 ≤ d ≤ 0.52 in Study 3).
Frequencies and proportions of participants by party preference
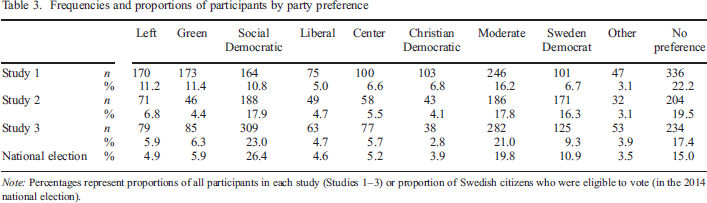
Note: Percentages represent proportions of all participants in each study (Studies 1–3) or proportion of Swedish citizens who were eligible to vote (in the 2014 national election).
Study 1
Swedish adults were recruited through convenience sampling on a university campus and in other public spaces in the years 2011–2016 (N = 1515; 53.2% women and 44.8% men; Mage = 29.3 years, SD = 13.0) to fill out online or pen–and–paper questionnaires. Average left–right self–placement (M = 4.71, SD = 2.27) was to the left of the theoretical midpoint (M = 5) of the scale, t(1483) = −4.87, p < .001, d = −0.13. As shown in Table 3, Left and Green party supporters were heavily overrepresented, while Social Democratic and Sweden Democrat supporters were underrepresented, compared with the distribution of voters in the 2014 Swedish national elections.
Study 2
Swedish adults were recruited from a nationally representative panel by an independent research firm in the fall of 2015 (N = 1048; 49.9% women and 50.1% men; Mage = 52.2 years, SD = 14.9) to fill out an online questionnaire battery, which included measures of prosociality in addition to the scales we used (results concerning prosociality have been reported elsewhere, see Erlandsson, Nilsson, Tinghög, Andersson, & Västfjäll, 2019; Nilsson, Erlandsson, & Västfjäll, 2016). Quota sampling was used to make the sample nationally representative in terms of sex, age, and geographic region. Average left–right self–placement (M = 4.78, SD = 2.21) was to the right of the theoretical midpoint (M = 4.5) of the scale, t(1045) = 4.13, p < .001, d = 0.13. As shown in Table 3, Social Democratic supporters were underrepresented, and Sweden Democrat supporters were overrepresented, in comparison with the outcome of the 2014 national elections (but much less so when compared with opinion polls conducted at the time of research).
Study 3
A nationally representative sample of Swedish adults participated in a postal survey administered by Statistics Sweden (SCB), which is a public administrative agency, in the spring of 2015 (N = 1345; 51.0% women and 49.0% men; Mage = 52.0 years, SD = 16.0). The participants filled out a questionnaire battery, which included measures of trust and basic values in addition to the scales we used. Average left–right self–placement (M = 5.55, SD = 2.23) was close to the theoretical midpoint (M = 5.5) of the scale, t(1310) = 0.74, p = .462, d = 0.02.
Measures
Detailed descriptive statistics for all measures are provided in Supplementary Tables 1–3 in ‘SI Descriptives, correlations, and post hoc difference tests.pdf’, https://osf.io/p5eyz.
Study 1
We measured resistance to change (α = .82) and preference for equality (α = .86) by computing the mean values of responses to two 9–item scales (Nilsson & Jost, 2017). These scales were developed to measure resistance to change and preference for equality specifically, without conflating these constructs with, for example, deference for authority, religiosity, in–group favouritism, and aggression. They have been psychometrically refined and have proved to correlate strongly with other constructs that are associated with left–right ideology in Sweden, the USA, and Italy (Caprara, Nilsson, Vecchione, Bäck, & Bäck, 2015; Nilsson & Erlandsson, 2015; Nilsson & Jost, 2017). Sample items are ‘If you start changing things very much, you often end up making them worse’ and ‘Prosperous nations have a moral obligation to share some of their wealth with poor nations’. The participants responded on a 7–point Likert scale ranging from 1 (strongly disagree) to 7 (strongly agree).
The participants indicated their ideological self–placement on a 10–point Likert scale ranging from 1 (Left) to 10 (Right) (‘In political matters, people sometimes talk about “the left” and “the right.” How would you place your views on this scale, generally speaking?’, n = 623), on a 9–point Likert scale ranging from 1 (extremely far to the left) to 9 (extremely far to the right) (‘General political orientation’, n = 282), or on a 7–point Likert scale ranging from 1 (strongly to the left) to 7 (strongly to the right) (‘Political ideologies are usually placed on a scale between left and right. Where would you place yourself on the left–right scale?’, n = 610). The correlates of left–right self–placement were similar across groups with different response scales (resistance to change: r ≥ .24; preference for equality: r ≤ −.30). We therefore aggregated the groups, converting all left–right self–placement scores to the 1–9 scale format through linear transformations. The total scores correlated strongly positively with resistance to change, r = .42, 95% bias–corrected and accelerated (BCa) CI [0.37, 0.47], and negatively with preference for equality (r = −.65, 95% BCa CI [−0.69, −0.62]), which were, in turn, negatively correlated with each other (r = −.38, 95% BCa CI [−0.43, −0.33], p < .001).
The participants indicated either what party they had voted for in the previous national election (‘If you voted, what party did you vote for?’) or what party they would vote for (‘What party would you vote for if there was an election today?’) depending on when they participated in the study. They responded either through an open–ended question (n = 282) or through a multiple–choice item (n = 1233) that listed all eight parties in the parliament along with the options ‘Other’ (n = 32) and ‘Don't want to say/Don't know’ (n = 238; we placed participants who chose this option, along with 98 participants who did not respond to the open–ended question, in the category ‘No preference expressed’).
Study 2
We measured moral intuitions with the Swedish version (Nilsson & Erlandsson, 2015) of the Moral Foundations Questionnaire (Graham et al., 2009), which includes three items assessing the perceived relevance of moral concerns and three items assessing agreement with moral judgments for each of five moral foundations (harm, fairness, loyalty, authority, and purity). The participants responded on 6–point Likert scales ranging from 0 (not at all relevant) to 5 (extremely relevant) and from 0 (strongly disagree) to 5 (strongly agree). We computed mean scores for individualizing intuitions (α = .74) and binding intuitions (α = .86). Sample items include ‘Chastity is an important and valuable virtue’ (purity) and ‘Justice is the most important requirement for a society’ (fairness).
The participants reported left–right self–placement (‘Do you see yourself as politically to the right or to the left on this scale?’) on a 10–point Likert scale ranging from 0 (very far to the left) to 9 (very far to the right). We converted the responses to a 1–9 scale format through a linear transformation in order to facilitate comparison with the results of Study 1. Left–right self–placement correlated as expected with individualizing intuitions (r = −.28, 95% BCa CI [−0.34, −0.22]) and binding intuitions (r = .28, 95% BCa CI [0.21, 0.34]), which were in turn positively correlated with each other (r = .22, 95% BCa CI [0.16, 0.28], p < .001).
The participants reported their religiosity (‘Do you see yourself as religious?’) on a 10–point Likert scale ranging from 0 (very non–religious) to 9 (very religious). They reported what party they would vote for (‘If there was an election today, what party would you vote for?’) by responding to a multiple–choice item that listed all eight parties in the parliament along with the options ‘Other’ (n = 32) and ‘Don't want to say/Don't know’ (n = 203; we placed participants who selected this option and one participant who did not respond to this item at all in the category ‘No preference expressed’). The participants also reported the highest level of education they had completed (1 = no formal education, 2 = primary education, 3 = secondary education, 4 = started university/college, and 5 = degree from university/college) and their monthly pretax income in SEK (1 = 8000 or less, 2 = 8001 to 17 000, 3 = 17 001 to 25 000, 4 = 25 001 to 33 000, 5 = 33 001 to 41 000, 6 = 41 001 to 50 000, 7 = 50 001 to 58 000, and 8 = 58 001 or more).
Study 3
We measured humanism (α = .79) and normativism (α = .79) with 15–item short scales developed by Nilsson (2014a). These scales include three items for each of five facets of humanism and normativism: view of human nature, interpersonal attitude, attitude to affect, political values, and epistemology. Sample items include ‘Human beings are basically good’ (humanism) and ‘Human beings should be treated with respect only when they deserve respect’ (normativism). The participants responded on a 7–point Likert scale ranging from 1 (completely disagree) to 7 (completely agree).
We measured core political values with a modified version (Schwartz et al., 2014) of an instrument that was developed by Schwarz et al. (2010). Sample items include ‘The government should forbid all protests that might turn violent’ (law and order) and ‘The freer the market is from government interference, the better’ (free enterprise). We added two items measuring the value of protecting the environment (e.g. ‘Preventing pollution of the environment and protecting the natural resources is very important’). The participants responded on a 5–point Likert scale ranging from 1 (strongly disagree) to 5 (strongly agree).
Because there was no definite model of the dimensionality of the political values and only two to three items per value included in our study, we conducted item–based principal components analyses and exploratory factor analyses. Principal components extraction and promax rotation (κ = 4) yielded six rotated components with eigenvalues larger than 1 (4.78, 2.53, 1.74, 1.34, 1.15, and 1.12) followed by a drop and levelling out of eigenvalues (principal axis factoring and oblimin rotation yielded very similar results). Correlations between component scores and the sum of items measuring each political value revealed that the first component was associated with traditional morality (r = .87), law and order (r = .84), and blind patriotism (r = .67); the second was associated with equality (r = .86); the third was associated with protecting the environment (r = .98); the fourth was associated with free enterprise (r = .94); the fifth was associated with military intervention (r = .98); and the sixth was associated with civil liberties (r = .87). Acceptance of immigrants correlated negatively with the first component (r = −.60) and positively with the second (r = .74).
We treated acceptance of immigrants as a separate value, because one of our hypotheses pertained to this value (two items, α = .88). We summed traditional morality, law and order, and blind patriotism into a general score for the value of ‘stability’ (eight items, α = .83), which is closely related to resistance to change and binding moral intuitions. We treated equality (two items, α = .68), protecting the environment (two items, α = .90), free enterprise (two items, α = .71), and military intervention (two items, α = .60) as separate scales. We excluded civil liberties (α = .56) from further analyses because the scores were heavily skewed toward the ceiling and essentially invariant across parties.
The participants reported left–right self–placement (‘In political matters, people sometimes talk about “left” and “right.” How would you place yourself on the scale below?’) on a 10–point Likert scale ranging from 1 (very left wing) to 10 (very right wing). They reported self–placement in terms of economic issues (‘When someone is on the left, they emphasize economic equality, even if it leads to redistribution of economic resources. When someone is on the right, they emphasize individuals’ rights to reap the results of their economic success, even if it leads to economic inequality. To what extent would you describe yourself as to the left or the right with respect to economic issues?’) and in terms of social issues (‘If someone is social liberal, individual rights and freedoms are more important than norms and traditions. When someone is social conservative, observing norms and traditions is more important than individual rights and freedoms. To what extent would you describe yourself as social liberal or social conservative?’) on 7–point Likert scales ranging from 1 (very left wing) to 7 (very right wing) and 1 (very liberal) to 7 (very conservative). We included explanations of the issues associated with each dimension in these items because we found it possible that many participants would not be familiar with the distinction between social and economic issues, although the vast majority of Swedes know how to position themselves in a general left–right space (Cochrane & Nevitte, 2009). We converted the responses to all self–placement items into a 1–to–9–scale format in order to make the studies and scales comparable.
Left–right self–placement correlated as expected with self–placement on economic issues (r = .78, 95% BCa CI [0.75, 0.81]) and social issues (r = .27, 95% BCa CI [0.22, 0.33]), (low) humanism (r = −.18, 95% BCa CI [−0.23, −0.12]), normativism (r = .22, 95% BCa CI [0.16, 0.27]), and all political values (.48 ≥ |r| ≥ .17). Left–right self–placement on social and economic issues correlated with (low) humanism (economic: r = −.25, 95% BCa CI [−0.30, −0.19]; social: r = −.13, 95% BCa CI [−0.18, −0.06]), normativism (economic: r = .24, 95% BCa CI [0.19, 0.30]; social: r = .33, 95% BCa CI [0.28, 0.39]), each other (r = .22, 95% BCa CI [0.16, 0.28]), and, with varying magnitudes, with all political values as well (.49 ≥ |r| ≥ .08; p ≤ .006; see Supplementary Table 5 in ‘SI Descriptives, correlations, and post hoc difference tests.pdf’, https://osf.io/p5eyz).
The participants reported party preference (‘If the election were today, which party would you vote for?’) by responding to a multiple–choice item that listed all eight parties in the parliament along with the options ‘Feminist Initiative’ (the largest party outside of the parliament when the data were collected, n = 35), ‘Other party’ (n = 18), ‘I do not vote’ (n = 22), ‘I abstain in the vote’ (n = 34), and ‘I do not know’ (n = 164; we placed participants who chose either of the last three options and 14 participants who did not respond to this item at all in the category ‘No preference expressed’). The participants also reported the highest level of education they had completed (1 = primary education, 2 = high school, 3 = post high school started, 4 = bachelor/master degree, and 5 = doctoral degree) and their yearly income (in SEK).
Statistical procedure
Before proceeding to the main analyses, we conducted confirmatory factor analyses of the scales we used to measure leftist and rightist orientations, along with tests of exact measurement invariance across the groups we intended to compare. A two–factor model of resistance to change and preference for equality (in Study 1), and hierarchical two–factor models of binding and individualizing intuitions (in Study 2) and humanism and normativism (in Study 3), showed acceptable fit. All three models exhibited full configural and metric invariance. Humanism and normativism exhibited full scalar invariance as well, while evidence for full scalar invariance was less consistent for the two other models (see ‘SI Psychometric analyses.pdf’, https://osf.io/cf2a6, for complete results; see ‘SI Measurement invariance.zip’, https://osf.io/cyuwg, for script and data files).
To test our hypotheses concerning social ideology (H1 and H2, see Table 2), we recoded party preference into dichotomous variables that corresponded to the contrasts we were interested in (left vs. right, radical left vs. social democratic, social liberal vs. social conservative, etc.) and ran binomial logistic regression models that predicted these contrasts. To test our hypotheses concerning political values (H3, see Table 2), we instead performed multinomial logistic regressions with the Green party and the Sweden Democrat party as the reference categories. Each model initially contained only one predictor variable, but we subsequently added covariates to investigate whether the findings held up when we controlled for (i) ideological self–placements; (ii) socio–demographic characteristics; (iii) other aspects of left–right ideology, moral intuitions, and worldviews that were included in each study; and (iv) religiosity (only included in Study 2). We performed these robustness tests both with each group of control variables included at a time and with all control variables entered together.
We report odds ratios (OR), which indicate how much a one–unit change in a predictor variable changes the odds that a person would choose a party or group of parties over another, with 95% confidence intervals. To facilitate comparison of effect sizes, we report odds ratios based on standardized scores with higher values indicating a larger difference (i.e. p < .05 when the lower end of the confidence interval is larger than 1) in the running text. We also quantify the effect sizes in terms of partial eta squared (ηp2) based on analysis of variance (ANOVA) (switching places between independent and dependent variables) to facilitate interpretation of the effect sizes. To avoid capitalizing on chance, we adjusted the significance thresholds for the hypotheses we tested sequentially through Holm's (1979) modified Bonferroni procedure (see ‘SI corrections.xlsx’, https://osf.io/pyq65, for full documentation of the adjusted thresholds). For the exploratory analyses of political values (in Study 3), we ran one binomial logistic regression analysis for each party with all six political values as predictors and party preference recoded into a dichotomous variable (did vs. did not select the given party) as the outcome.
We conducted all our main analyses in SPSS 26.0. Data files, codebook, and scripts for the analyses are openly accessible: ‘Data (csv).zip’ at https://osf.io/94d8p and ‘SI Scripts.zip’ at https://osf.io/ye7f6. We constructed all figures with the bar chart and scatter chart functions in Excel 2016 based on standardized scores.
Results
Average left–right self–placement by party preference in all three studies is illustrated in Figure 1. The total differences between participants who favoured a left–wing party and those who favoured a right–wing party were very large, t(1020) = 40.1, d = 2.51, in Study 1; t(639) = 33.0, d = 2.62, in Study 2; and t(915) = 39.1, d = 2.59, in Study 3 (p < .001). In the remainder of the Results section, we present results pertaining to our main research questions for one study at a time.
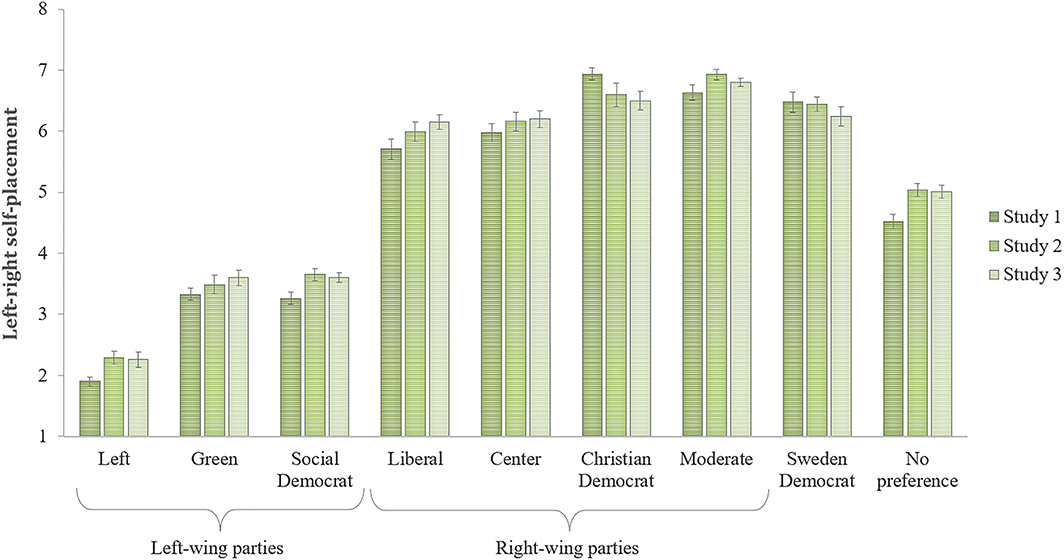
Mean left–right self–placement with error bars (±1 SE) by party preference in all studies.
Study 1: Preference for equality and resistance to change
As can be seen in Figure 2, acceptance of inequality (vs. preference for equality) increased continuously from left to right, while resistance to change varied more within the left and the right. Table 4, which presents odds ratios based on logistic regression models with all predictors and control variables included, shows that resistance to change did not have a unique effect on preference for a right–wing versus left–wing party.
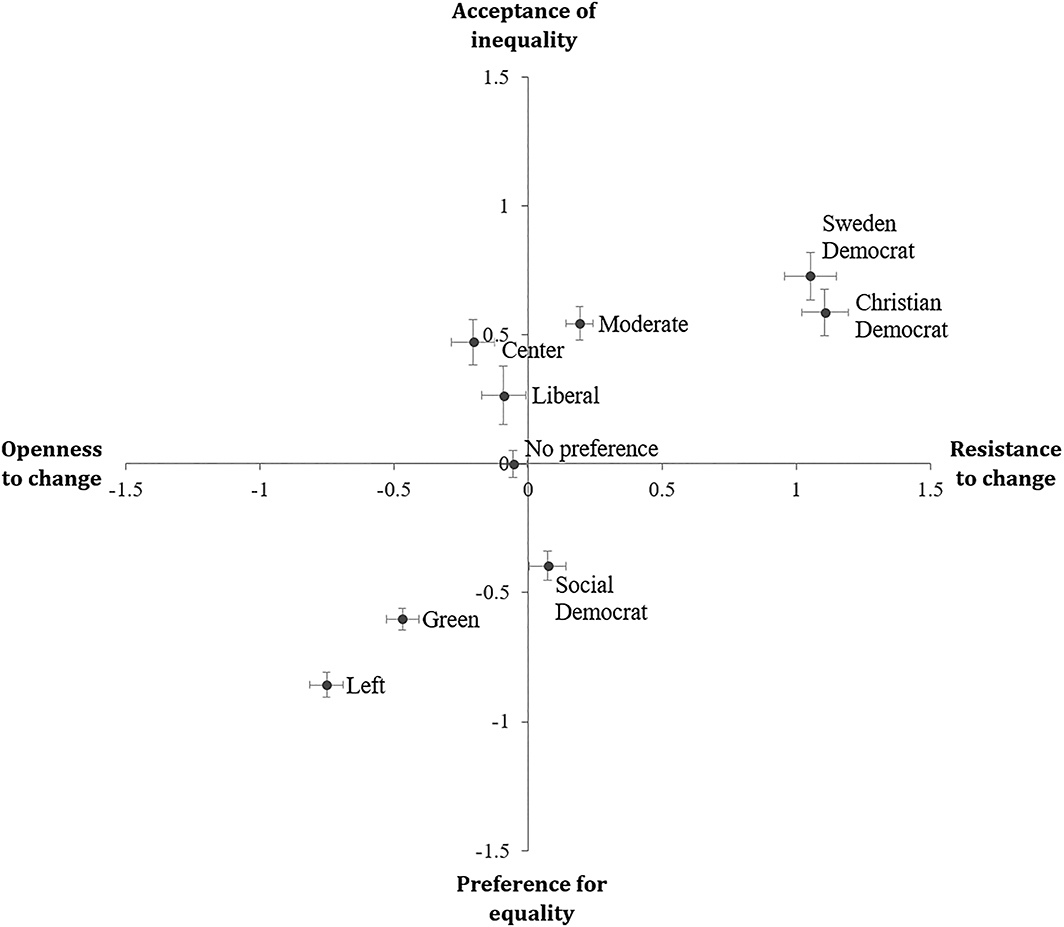
Mean standardized resistance (vs. openness) to change and acceptance of inequality (vs. preference for equality) with error bars (±1 SE) by party preference in Study 1.
Odds ratios (with 95% confidence intervals and p–values) based on binomial logistic regression models predicting party preference in terms of political preferences, left–right self–placement, and demographic variables (Study 1)
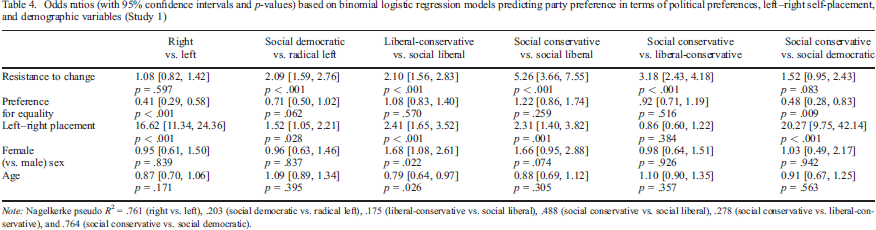
Note: Nagelkerke pseudo R2 = .761 (right vs. left), .203 (social democratic vs. radical left), .175 (liberal–conservative vs. social liberal), .488 (social conservative vs. social liberal), .278 (social conservative vs. liberal–conservative), and .764 (social conservative vs. social democratic).
The tests of our hypotheses (see Table 2) yielded clear support for the existence of variations in social ideology that cannot be accounted for by a single left–right dimension or by demographic differences. Consistent with H1a, a binomial logistic regression showed that resistance to change had a substantial effect on preference for the Social Democratic party over a radical left (Left or Green) party, OR = 2.50 [1.97, 3.18] (p < .001; Nagelkerke pseudo R2 = .17; ηp2 = 0.13 based on a corresponding ANOVA comparing Social Democratic and radical left supporters), and this effect was very robust when we controlled for left–right self–placement, preference for equality, and demographics (p < .001; see Table 4).
Consistent with H1b and H1c, resistance to change predicted preference for the liberal–conservative (Moderate) party over a social liberal (Liberal or Center) party, OR = 1.78 [1.37, 2.31], preference for a social conservative (Christian Democratic or Sweden Democrat) party over a social liberal party, OR = 5.05 [3.63, 7.04], and preference for a social conservative party over the liberal–conservative party, OR = 3.28 [2.52, 4.28] (p < .001; Nagelkerke pseudo R2 = .06, .45, and .28, respectively; ηp2 = 0.05, 0.34, and 0.21 based on corresponding ANOVAs), and these effects held up across all tests with control variables included (p < .001; see Table 4). Resistance to change predicted preference for a social conservative party over the Social Democratic party as well, OR = 3.33 [2.50, 4.42] (p < .001; Nagelkerke pseudo R2 = .31; ηp2 = 0.23), consistent with H1c. This effect remained significant when we controlled for left–right self–placement (p = .007, adjusted significance threshold = .050), preference for equality, and demographics (p < .001) but not when all of the controls were included at the same time (see Table 4).
Study 2: Individualizing and binding moral intuitions
Average levels of individualizing and binding moral intuitions by party preference are illustrated in Figure 3. Neither of these variables had a unique effect on preference for a left–wing versus right–wing party. This is shown in Table 5, which presents odds ratios based on logistic regression analyses with all predictors and control variables included.
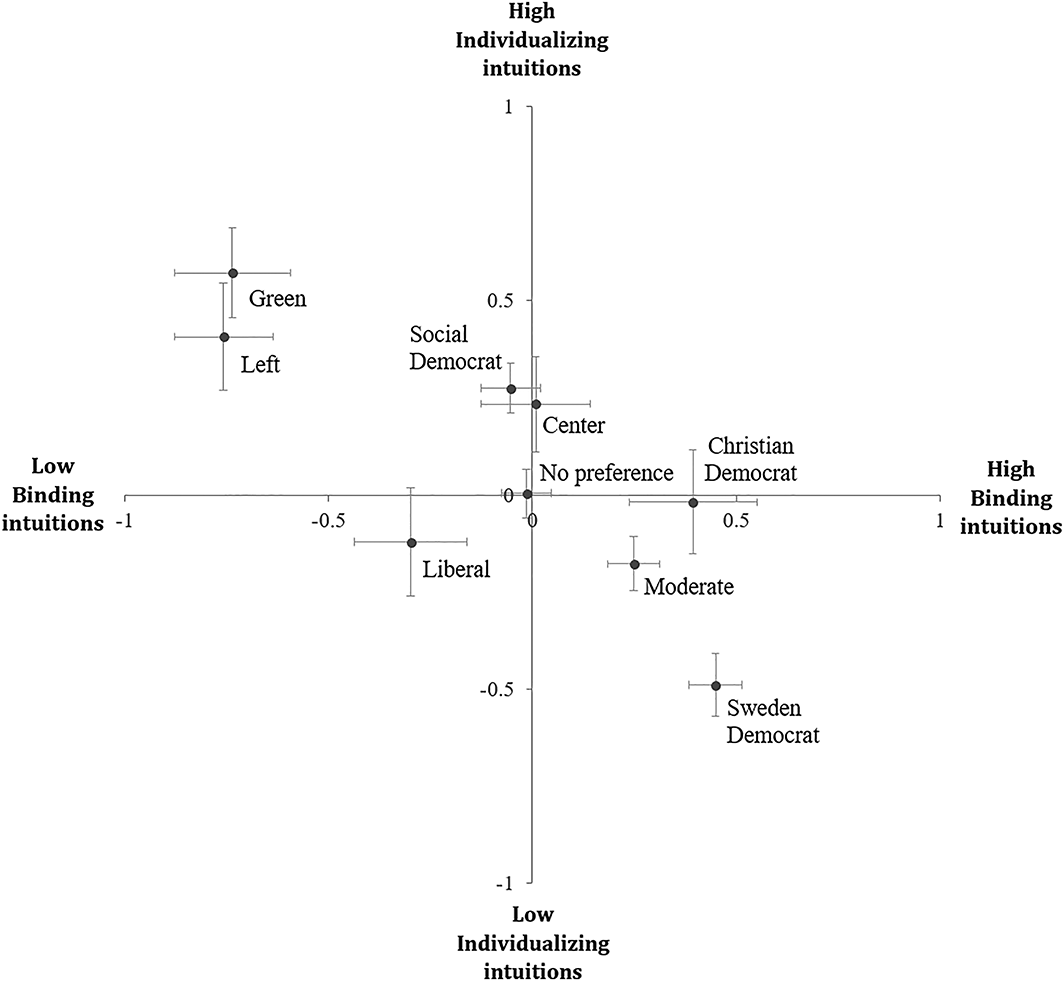
Mean standardized binding and individualizing moral intuitions with error bars (±1 SE) by party preference in Study 2.
Odds ratios (with 95% confidence intervals and p–values) based on binomial logistic regression models predicting party preference in terms of moral foundations, left–right self–placement, demographic variables, and religiosity (Study 2)
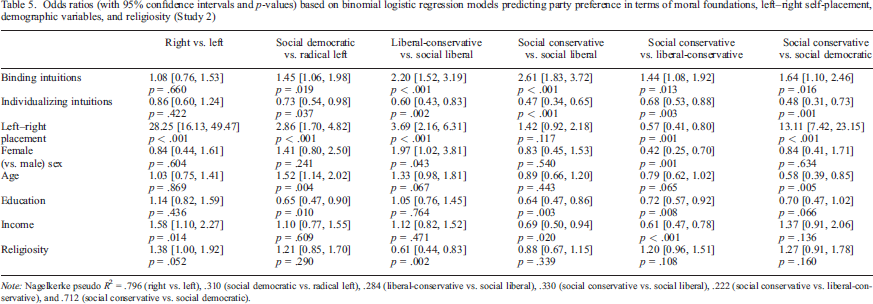
Note: Nagelkerke pseudo R2 = .796 (right vs. left), .310 (social democratic vs. radical left), .284 (liberal–conservative vs. social liberal), .330 (social conservative vs. social liberal), .222 (social conservative vs. liberal–conservative), and .712 (social conservative vs. social democratic).
Once again, we obtained support for the existence of hypothesized variations (see Table 2) along the social ideological axis. Consistent with H1a, a binomial logistic regression analysis showed that binding moral intuitions predicted preference for the Social Democratic party over a radical left party, OR = 1.98 [1.54, 2.55] (p < .001; Nagelkerke pseudo R2 = .14; ηp2 = 0.10 based on a corresponding ANOVA). This effect held up when we included each group of control variables (demographics, religiosity, left–right self–placement, and individualizing intuitions) one by one (p < .001) and when we entered all of them together (see Table 5; adjusted significance threshold = .050).
Consistent with H1b and H1c, binding moral intuitions predicted preference for the liberal–conservative party over a social liberal party, OR = 1.56 [1.20, 2.03] (Nagelkerke pseudo R2 = .05), and preference for a social conservative party over a social liberal party, OR = 1.91 [1.47, 2.49] (p ≤ .001; Nagelkerke pseudo R2 = .05 and .11, respectively; ηp2 = 0.04 and .08). These effects proved to be robust across all tests with control variables (p ≤ .005, adjusted significance threshold ≤ .025).
The results pertaining to preference for a social conservative party over other parties were somewhat less clear. Consistent with H1c, binding intuitions predicted preference for a social conservative party over the liberal–conservative party, OR = 1.28 [1.02, 1.61] (p = .033, adjusted significance threshold = .050; Nagelkerke pseudo R2 = .02; ηp2 = 0.01). This effect held up when we controlled for individualizing intuitions (p = .002) but not when we controlled for demographics (p = .102), and it was marginally significant when we controlled for religiosity (p = .042, adjusted significance threshold = .050) and left–right self–placement (p = .019, adjusted significance threshold = .025), and when all control variables were included (see Table 5; adjusted significance threshold = .017).
Consistent with H1c, binding intuitions predicted preference for a social conservative party over the Social Democratic party, OR = 1.73 [1.39, 2.16] (p < .001; Nagelkerke pseudo R2 = .08; ηp2 = 0.06). This effect was significant when we controlled for individualizing intuitions, religiosity, and demographics (p < .001). It was not significant when we controlled for left–right self–placement (p = .144) yet marginally significant when all control variables were included at the same time (see Table 5; adjusted significance threshold = .025).
Study 3
Economic and social left–right self–placement
Economic and social left–right self–placements by party preference are illustrated in Figure 4. The pattern of economic left–right self–placement by party preference was extremely similar to the pattern we obtained for general left–right self–placement, while self–placement on the social ideological axis varied more from left to right across the party spectrum. As shown in Table 6, which presents odds ratios based on logistic regression models with all predictors and control variables included, social right (vs. left) self–placement had no unique effect on preference for a right–wing versus left–wing party.
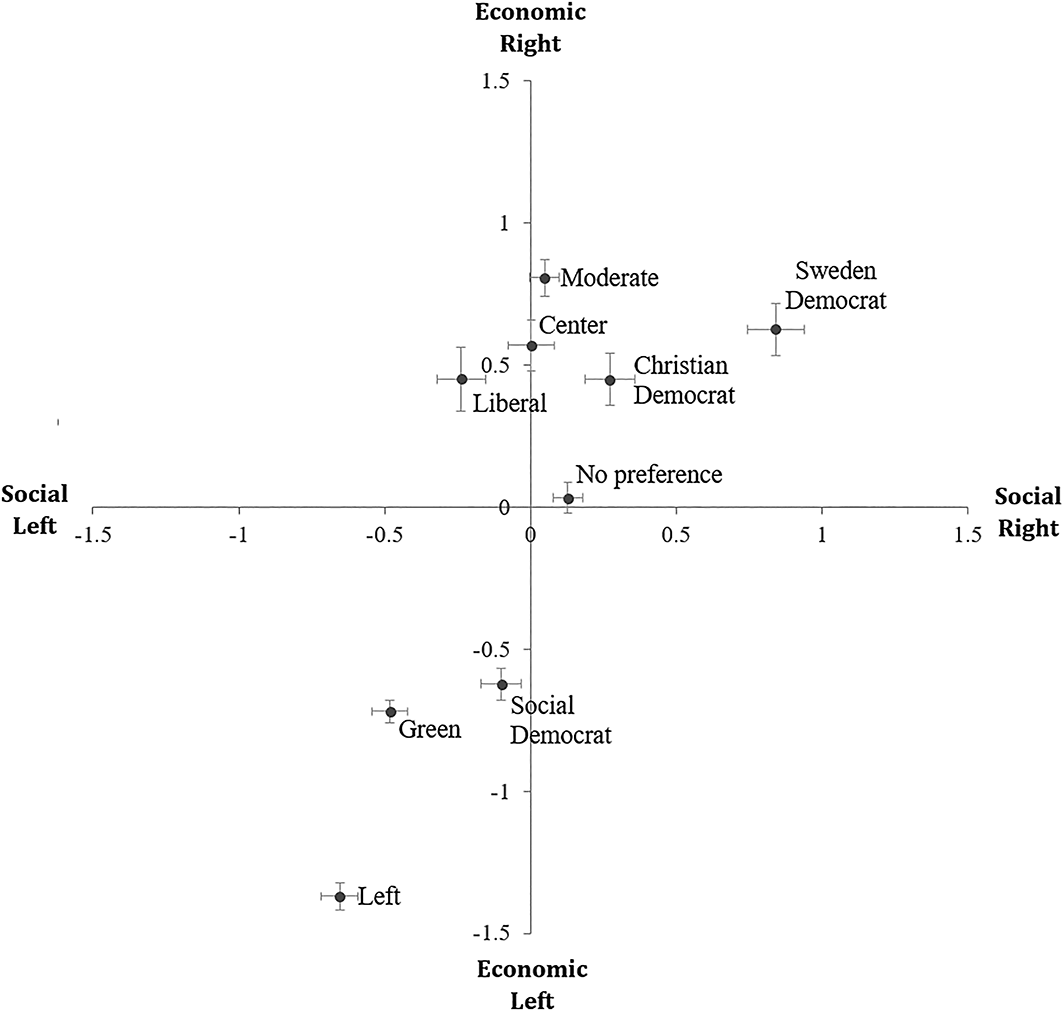
Mean standardized social right (vs. left) and economic right (vs. left) self–placement with error bars (±1 SE) by party preference in Study 3.
Odds ratios (with 95% confidence intervals) based on binomial logistic regression models predicting party preference in terms of worldviews, left–right self–placements, and demographic variables (Study 3)
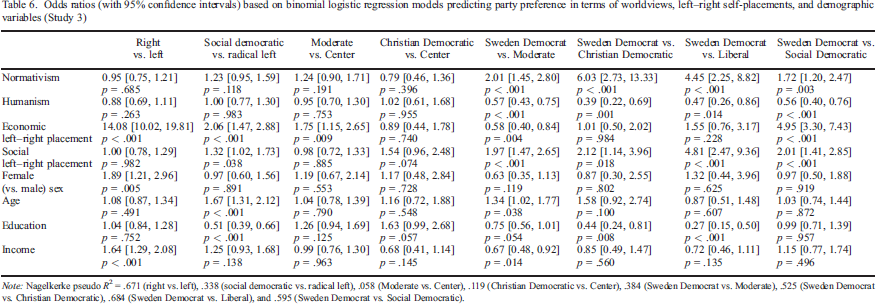
Note: Nagelkerke pseudo R2 = .671 (right vs. left), .338 (social democratic vs. radical left), .058 (Moderate vs. Center), .119 (Christian Democratic vs. Center), .384 (Sweden Democrat vs. Moderate), .525 (Sweden Democrat vs. Christian Democratic), .684 (Sweden Democrat vs. Liberal), and .595 (Sweden Democrat vs. Social Democratic).
The results provided mixed support for the hypotheses concerning social ideology (see Table 2). Consistent with H1a, right–wing self–placement on social issues predicted preference for the Social Democratic party over a radical left party, OR = 1.79 [1.43, 2.25] (p < .001; Nagelkerke pseudo R2 = .08; ηp2 = 0.06 based on a corresponding ANOVA). Although this effect held up when we adjusted for one group of control variables at a time (p ≤ .003, adjusted significance threshold ≤ .008), it did not reach significance when we included all controls at the same time (see Table 6, adjusted significance threshold = .010). Contrary to H1b, social right–wing self–placement did not predict preference for the liberal–conservative party over a social liberal party, OR = 1.19 [0.96, 1.49] (p = .111; Nagelkerke pseudo R2 = .01; ηp2 = 0.01). But consistent with H1c, social right–wing self–placement predicted preference for a social conservative party over social liberal, OR = 2.47 [1.87, 3.27], liberal–conservative, OR = 2.02 [1.62, 2.52], and social democratic, OR = 2.41 [1.92, 3.02], parties (p < .001; Nagelkerke pseudo R2 = .21, .13, and .19, respectively; ηp2 = 0.16, 0.10, and 0.14), and these effects were highly robust when we controlled for left–right self–placements, demographics, and worldviews (p < .001).
Humanist and normativist worldviews
Average levels of humanism and normativism by party preference are illustrated in Figure 5. Neither of these constructs had a unique effect on preference for a right–wing versus left–wing party over and above the effects of other variables (see Table 6).
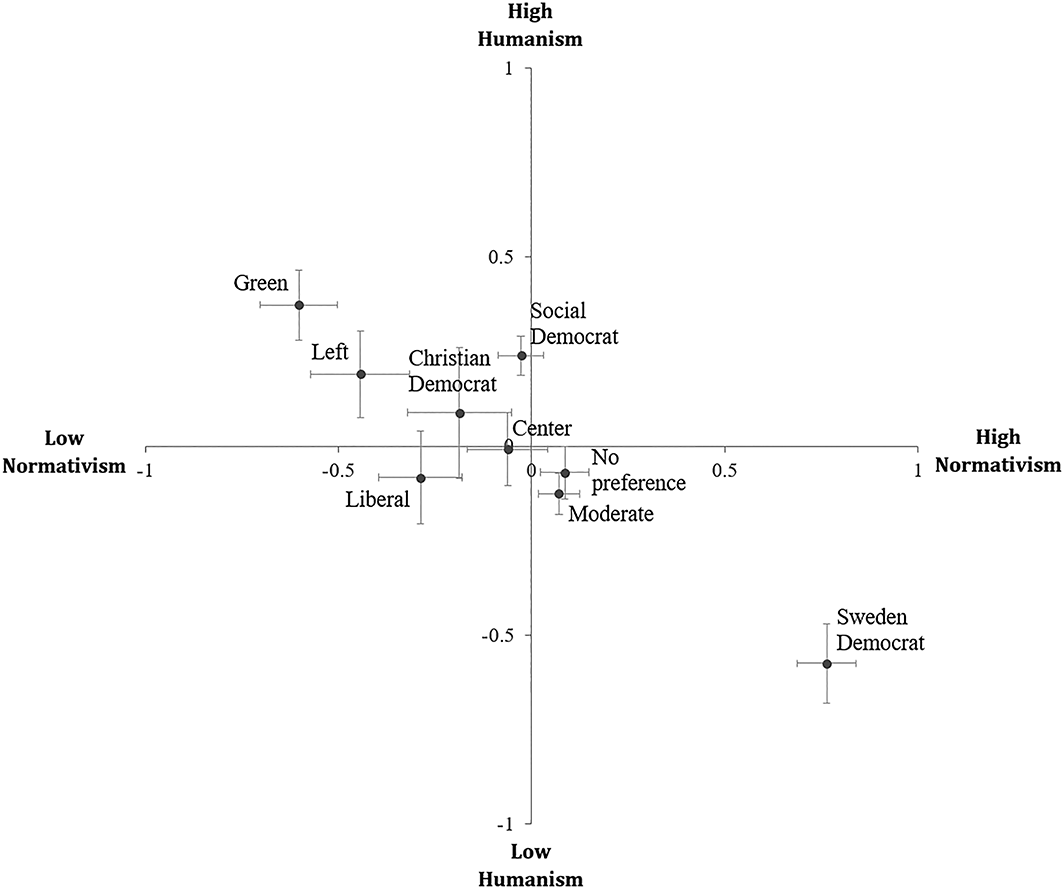
Mean standardized normativism and humanism with error bars (±1 SE) by party preference in Study 3.
The hypotheses about variations in normativism (H2, see Table 2) received mixed support. Consistent with H2a, and with the findings concerning other aspects of social ideology, normativism predicted preference for the Social Democratic party over a radical left party, OR = 1.65 [1.35, 2.03] (p < .001; Nagelkerke pseudo R2 = .07; ηp2 = 0.05). This effect held up when we controlled for demographic variables (p = .004, adjusted significance threshold = .010), humanism, and left–right self–placements (p ≤ .001), but it did not hold up when we entered all control variables together (see Table 6).
Contrary to H2b, normativism did not predict preference for the liberal–conservative Moderate party over the social liberal Center party, OR = 1.18 [0.89, 1.57] (p = .250), or preference for the Christian Democratic party over the Center party, OR = 0.85 [0.54, 1.33] (p = .475; Nagelkerke pseudo R2 = .006 for both cases; ηp2 = 0.004). In fact, it was the Liberal rather than the Center voters who expressed the least normativism on the right (see Figure 5), contrary to our expectations.
On the other hand, H2c received strong support. Normativism predicted preference for the nationalist (Sweden Democrat) party over all other parties (p < .001; OR ≥ 2.36; ηp2 ≥ 0.12 based on corresponding ANOVAs), including the Christian Democratic, OR = 4.39 [2.42, 7.94], Moderate, OR = 2.48 [1.88, 3.26], and Social Democratic, OR = 2.36 [1.84, 3.03], parties (Nagelkerke pseudo R2 = .30, .17, and .18, respectively; ηp2 = 0.19, 0.12, and 0.12). The effects held up when we controlled for humanism and demographic variables (p < .001), and social and economic left–right self–placement (p ≤ .003, adjusted significance threshold ≤ .008; see Table 6 for results with all controls included). In other words, high levels of normativism uniquely characterized participants who supported a nationalist party, whereas strong resistance to change and binding moral intuitions characterized participants who preferred conservative parties in general (see Figures 2 and 3).
Political values
Average scores on political values by party preference are illustrated in Figure 6. Note that positive scores in this figure indicate a more right–wing orientation (higher stability, free enterprise, and military intervention but lower equality, accepting immigrants, and protecting the environment).
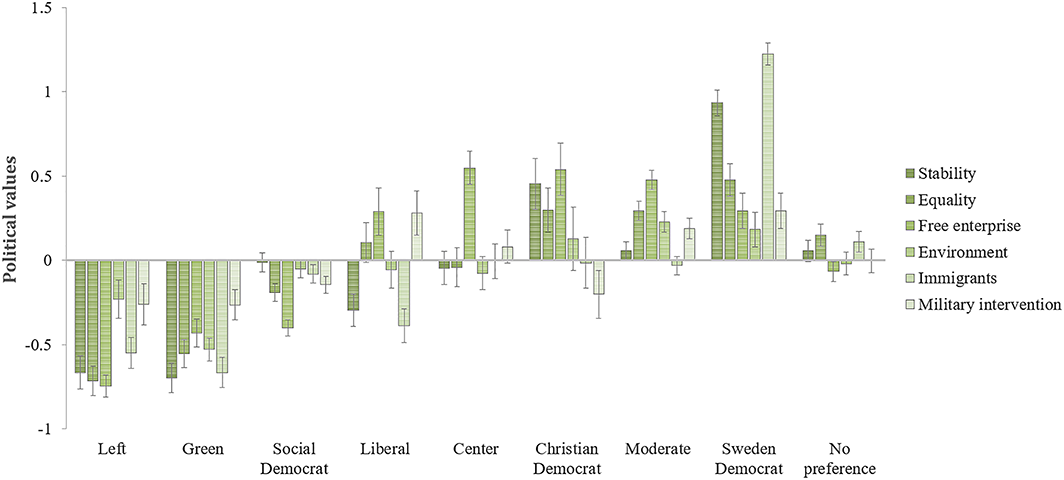
Mean standardized scores on core political values with error bars (±1 SE) by party preference in Study 3. Positive estimates indicate right–wing orientation (stronger endorsement of stability, free enterprise, and military intervention, and weaker endorsement of equality, protecting the environment, and accepting immigrants); negative estimates indicate left–wing orientation.
Support for our hypotheses pertaining to core political values (H3, see Table 2) was strong overall. Consistent with H3a, a multinomial logistic regression model revealed that protection of the environment predicted preference for the Green party over each of the seven other parties in the parliament, 2.42 ≤ OR ≤ 4.02 (p ≤ .003, adjusted significance threshold ≤ .013; Nagelkerke pseudo R2 = .05; ηp2 based on ANOVAs comparing participants who supported the Green party with participants who supported each of the other parties ranged from .03 to .12). All of the effects held up when we controlled for demographic variables (p ≤ .009, adjusted significance threshold ≤ .013), humanism and normativism (p ≤ .004, adjusted significance threshold ≤ .025), and left–right self–placement on social and economic issues (p ≤ .009, adjusted significance threshold ≤ .013). When we included all control variables, the effects on preference for the Green party over the social liberal parties did not reach significance (the Liberal party: p = .009, adjusted significance threshold = .006; the Center party: p = .015, adjusted significance threshold = .007).
Consistent with H3b, low acceptance of immigrants strongly predicted preference for the nationalist Sweden Democrat party over each of the other parties, 4.31 ≤ OR ≤ 10.99 (p < .001; Nagelkerke pseudo R2 = .05; ηp2 based on ANOVAs comparing participants who supported the Sweden Democrat party with participants who supported another party ranged from .30 to .60). These effects were highly robust when we ran tests with different groups of control variables (p < .001 in all cases).
Results from binomial logistic regressions with all six political values as predictors of preference for each party (vs. all other parties or no party) are shown in Table 7. Consistent with our hypotheses, valuing stability positively predicted preference for the social democratic and social conservative (Christian Democratic and Sweden Democrat) parties and negatively predicted preference for the radical left (Left and Green) and social liberal (Liberal and Center) parties when all political values were included in the model. The equality and free enterprise values instead predicted preference for a left–wing versus right–wing party (in opposite directions), as could be expected. Protection of the environment predicted stronger preference for the Green party and acceptance of immigrants predicted weaker preference for the Sweden Democrat party, which is also consistent with our hypotheses. In addition, low protection of the environment and high acceptance of immigrants predicted preference for the Moderate party, while valuing military intervention predicted stronger preference for the Sweden Democrat party and weaker preference for the Christian Democratic and Social Democratic parties.
Odds ratios (with 95% confidence intervals) based on binomial logistic regression models predicting party preference in terms of political values
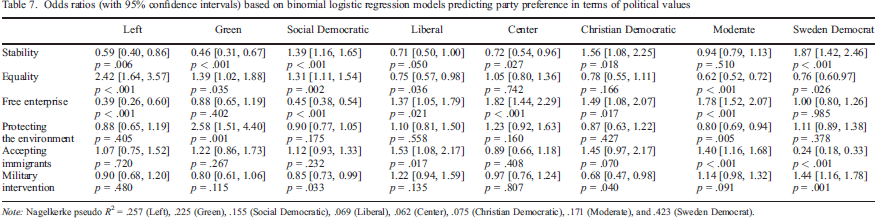
Note: Nagelkerke pseudo R2 = .257 (Left), .225 (Green), .155 (Social Democratic), .069 (Liberal), .062 (Center), .075 (Christian Democratic), .171 (Moderate), and .423 (Sweden Democrat).
Discussion
This research investigated the congruence between party preferences and personality characteristics relevant to political ideology, including ideological preferences concerning equality and social change (Jost et al., 2003), binding and individualizing moral intuitions (Graham et al., 2009), worldviews of humanism and normativism (Tomkins, 1963), and core political values (Schwartz et al., 2014), in the ideologically diverse multi–party welfare state of Sweden. The overarching goal of the research was to investigate how the ideological proclivities of the participants map onto the ideological positions of the parties they voted or intended to vote for. Our general hypothesis was that political orientations reflect a multitude of ideological conflicts between parties rather than just one general left–right (or liberal–conservative) divide. We devised several more specific hypotheses (which are summarized in Table 2) on the basis of the ideological landscape in Sweden. The results were, for the most part, supportive of these hypotheses. The findings thus contribute to a growing body of recent work on the complexity of political orientations (Feldman & Johnston, 2014; Haidt et al., 2009; Hanel et al., 2018; Iyer et al., 2012; Malka et al., 2017; Schoen & Schumann, 2007; Van Hiel, 2012; Vecchione et al., 2011; Weber & Federico, 2013).
The left–right dimension
The results revealed a left–right dimension associated particularly with preferences concerning equality and redistribution in an ideologically rich North–European context, consistent with past research (Aspelund et al., 2013; Cochrane & Nevitte, 2009; Malka et al., 2017). In spite of differences between the political parties, their respective groups of voters could be arranged in a largely consistent sequence from left to right. In the two–dimensional graphical representations shown in Figures 2–5, most of the parties (except the social liberal parties and, to some extent, the Social Democratic party) are located in the quadrants that represent a right–wing or left–wing orientation on both dimensions. This result is perhaps no wonder given that most of the parties are officially left–wing or right–wing parties. Education and political engagement, which are relatively high in the Swedish population, increase the probability that a person adopts an entire ideological (left–wing or right–wing) package from elite discourse (Johnston et al., 2017; Malka et al., 2014) and knows his or her position on the left–right continuum (Cochrane & Nevitte, 2009).
It should be noted that around a fifth of the participants in our studies did not express a preference for any party. It is possible that these non–voters did not feel represented by the homogeneous ideological packages offered by mainstream political parties. However, our results show no evidence of a clear ideological profile among these participants. Rather, they were consistently close to the centre on all measures we used (see Figures 1–6). The participants who did express a preference for a political party were more polarized in terms of left–right self–placements and ideology, which suggests that they oriented themselves in the political landscape with a left–right compass.
At the same time, this does not preclude that voters also pick up on more fine–grained ideological cleavages. Indeed, our results suggest that a single dimension contrasting leftists and rightists (or ‘liberals’ and ‘conservatives’) is not in itself sufficient for capturing all of the personality variation within the ideological domain. We found substantial differences between participants who voted or intended to vote for different kinds of left–wing and right–wing parties on variables associated with social ideology and political values (social left–right self–placement, binding moral intuitions, normativism, and values of protecting the environment and accepting immigrants) that were not reducible to a general left–right dimension. In general, the left–right dimension strongly predicted whether the participants chose a left–wing or right–wing party, but it was much less useful for predicting which of the left–wing or right–wing parties they chose. Furthermore, psychometric analyses (see ‘SI Psychometric analyses.pdf’, https://osf.io/cf2a6) revealed that two–factor models of political preferences, moral intuitions, and worldviews fit our data better than one–factor models did, and even more factors could be identified with a fine–grained measure of political values, consistent with the results of other recent studies (Feldman & Johnston, 2014; Graham et al., 2009; Malka et al., 2014; Schwarz et al., 2010, 2014; see also results of latent class analyses, ‘SI Latent class analyses.pdf’, https://osf.io/rn3b9).
These results do not completely invalidate the left–right description of political orientations. Philosophy of science provides good reasons for retaining a plurality of descriptions of the same aspect of reality (e.g. Dupré, 1993; Kellert, Longino, & Waters, 2006). Which description is preferable depends, to some extent, on the research problem and on pragmatic and contextual factors. The general left–right description is a broad–bandwidth model that is likely to remain useful, for instance, for illuminating how people navigate the political landscape and align their worldviews to elite discourse in post–industrial democracies (Caprara & Vecchione, 2017; Malka et al., 2017). Nevertheless, our results suggest that it is necessary to complement the left–right model with a richer and more fine–grained description of political orientations.
Radical left versus social democratic ideology
One of the contrasts we addressed in this research was that between left wingers who favoured one of the two radical left (Left and Green) parties, which have system–critical ideologies, and those who favoured the Social Democratic party, which has a more system–maintaining stance. As we had expected, variables associated with social ideology, including social right (vs. left) self–placement, resistance to change, binding moral intuitions, and normativism, consistently predicted preference for the Social Democratic party over a more radical left–wing party. These effects were not reducible to the left–right dimension, holding up in almost every case when we controlled for left–right self–placement and ideology (and demographic factors). The only exceptions were that the effects of normativism and social right (vs. left) self–placement on preference for the Social Democratic party were not significant when all control variables were included in the model.
Participants who supported the Social Democratic party were consistently clearly to the left on variables associated with economic ideology but close to the centre of the social ideological axis. In fact, there were no significant differences between participants who preferred the Social Democratic party and those who preferred a social conservative party once we adjusted for all other aspects of left–right ideology, worldviews, and demographics. Furthermore, an exploratory analysis suggested that the value of stability (traditional values, law and order, and patriotism) predicted lower probabilities of preferring one of the radical left parties but a higher probability of preferring the Social Democratic party (compared with all other parties) when all political values were included in the model.
In fact, on variables associated with social ideology, participants who favoured the Social Democratic party were consistently closer to participants who favoured social liberal (Liberal and Centre) and liberal–conservative (Moderate) right–wing parties than to those who favoured radical left parties. It should be noted, however, that the results of latent class analyses, which we present in supplemental documents (see ‘SI Latent class analyses.pdf’, https://osf.io/rn3b9), suggested that the moderate levels of social conservative ideology among Social Democratic voters overall were due to the fact that this party attracted both many voters with progressive left views and many voters with social conservative views. Most of the participants who preferred a social liberal or liberal–conservative party, on the other hand, belonged to a distinct class with an economic right profile.
These findings shed new light on a classical issue. As noted by Jost et al. (2009), it seemed conceivable that resistance to change would correlate positively with preference for equality in an egalitarian welfare state shaped by social democratic ideology. We found that this was not the case. The correlation between the two constructs was strongly negative. Nevertheless, the findings regarding social conservatism among Social Democratic voters specifically suggest that there is some merit to the idea that resistance to change is sometimes recruited in the interest of protecting an egalitarian system. Threats to social stability, order, and ‘the Swedish model’ have, in fact, often been framed as threats to social and economic equality in Swedish social democratic rhetoric. It is possible that this very combination of economic leftism and social rightism, which is common among voters (Malka et al., 2014; 2017), explains why the Swedish Social Democratic party has, at least historically, been able to appeal to so many different groups.
Social liberal versus social conservative and liberal–conservative ideology
Another set of contrasts we addressed in the current research are those between participants who preferred one of the two social liberal (Liberal and Centre) parties, which are officially on the right in Swedish politics, and those who preferred social conservative (Sweden Democrat and Christian Democrat) or liberal–conservative (Moderate) parties. Consistent with our expectations, the social liberal groups were consistently far to the right on variables associated with economic ideology and left–right self–placement but on the centre or left on variables associated with social ideology. Right–wing self–placement on social issues, resistance to change, and binding moral intuitions strongly predicted preference for a social conservative over a social liberal party (and all other groups of parties). Resistance to change and binding moral intuitions predicted preference for the liberal–conservative party over a social liberal party as well. Once again, the effects remained significant in almost every single case when we controlled for left–right self–placement and ideology, as well as demographic variables. Taken together, these findings demonstrate differences between groups of right–wing voters that are not reducible to a general left–right dimension.
It is worth noting that particularly right wingers who favoured the Liberal party occupied a left–wing position on variables associated with social ideology. They expressed not only a lack of binding intuitions and resistance to change but also low levels of individualizing moral intuitions, normativism, and humanism and relatively high acceptance of immigrants. This makes them somewhat similar to libertarians in the USA, who score low on both binding and individualizing moral intuitions—for this group, individual liberty is the central moral value (Iyer et al., 2012), and this is the core value of the Swedish Liberal party as well. Another similarity is that a recent study found that Swedish social liberal voters in general, and Liberal voters in particular, had very high levels of analytic thinking, numeracy, and bullshit sensitivity (Nilsson, Erlandsson, & Västfjäll, 2019), and research has shown that US libertarians tend to have high levels of need for cognition, analytical thinking, and systemizing (Iyer et al., 2012). It is possible that these cognitive dispositions can explain why Liberal voters are disinclined to endorse the sort of simple and unqualified worldview statements that we used to measure humanism and normativism.
These findings illustrate the fact that the problem with the contrast between ‘liberals’ and ‘conservatives’ goes beyond the issue of the dimensionality of political orientations. This contrast is a reification of ideological discourse in English–speaking countries (the USA, Canada, the UK, and Australia) that fits poorly as a description of the ideological divergence between left and right in many other parts of the world. The conflict between liberalism and conservatism is often (insofar as these generic terms are even appropriate, see Freeden, 2010) one among several ideological conflicts along the left–right continuum, as exemplified by the Swedish case. It is therefore crucial to disentangle leftists from persons who are attracted to liberal ideologies and rightists from persons who are attracted to conservative ideologies of different kinds.
Green and nationalist ideology
In addition to the contrasts between different groups of left and right wingers, we focused specifically on parties with green and nationalist ideologies. Consistent with our hypotheses, participants who favoured the nationalist Sweden Democrat party did clearly stand out in terms of having a much lower acceptance of immigrants and higher normativism (and lower humanism) than all other groups of voters, while participants who preferred the Green party stood out in terms of valuing protection of the environment. Once again, the differences held up when we controlled for left–right self–placement (and worldviews and demographics), and most of them held up also when we included all control variables. The variations between the other parties in terms of acceptance of immigrants, normativism, humanism, and protection of the environment were small.
Taken together, these findings suggest that nationalist and green orientations are not completely reducible even to a two–dimensional model that distinguishes social and economic aspects of ideology. Rather, they appear to be better described by the GAL–TAN (Green–Alternative–Libertarian vs. Traditional–Authoritarian–Nationalist) dimension, which political scientists have invoked to describe a clash between opposing viewpoints on issues concerning lifestyle, ecology, cultural diversity, nationalism, and immigration in European politics; the parties at either pole are typically characterized by radical positions on these specific issues rather than more standard left–wing or right–wing positions (Hooghe, Marks, & Wilson, 2002). It is particularly interesting to note that Sweden Democrat and Christian Democratic groups were very similar in terms of having high levels of resistance to change and binding moral intuitions yet extremely different in terms of attitudes to immigrants, normativism, and humanism. On the opposite end of the spectrum, participants who preferred the Left party were the most extreme in terms of preference for equality, advocacy of change, and economic left–wing self–placement, while participants who preferred the Green party scored higher on environmentalist values, humanism, and individualizing moral intuitions. These findings illustrate how progressive and conservative ideologies that are animated by the GAL–TAN conflict differ from traditional progressive and conservative ideologies.
An additional implication of these findings is that the clash between humanist and normativist worldviews described by polarity theory (Tomkins, 1963), and to some extent the moral orientations described by moral foundations theory (Haidt & Graham, 2007), may shed new light on roots of the GAL–TAN conflict. The more standard conceptualization of ideology in terms of resistance to change and preference for equality (Jost et al., 2003) may instead predominantly capture the traditional conflict between left and right.
Limitations and future directions
Although all our samples were reasonably heterogeneous, only the third study had a fully nationally representative sample. Respondent self–selection may thus have affected the results. Particularly anti–establishment voters may be wary of participating in this kind of research and expressing their opinions sincerely because of the stigma associated with expressing such opinions in Sweden. Moreover, the statistical power of analyses involving the smallest groups we studied was limited. It is possible that there is even more variation in political orientations than we were able to detect in the current research. This kind of research naturally requires very large samples, as the smallest parties may occupy no more than a few percent of the entire population of voters.
The choice of instruments also leaves room for improvement. Although we took a broad range of ideologically relevant personality characteristics into consideration, we did not consider more specific preferences and issue positions. For example, we focused on general attitude to social change at an abstract level. By contrast, Proch, Elad–Strenger, and Kessler (2019) measured attitudes toward change across different socio–political issues, finding that whether people support or accept change depends on their view of the status quo on the given issue. Similarly, Freeden (2010) has argued that all political ideologies advocate some forms of change while resisting others. Including fine–grained issue–specific measures may therefore provide further nuance to our understanding of political orientations.
Another limitation is that cross–sectional data provide a static image of the relations between political orientations and party preference. Longitudinal studies are necessary for clarifying how party preferences develop as a function of personality characteristics, partisanship, socio–demographic factors, and candidate preferences. Such studies can provide tests of whether personal beliefs, preferences, and values drive party preferences (Schoen & Schumann, 2007; Vecchione et al., 2011) or whether it is the other way around (Bankert et al., 2017; Malka & Lelkes, 2010), and they can shed light on how changing political landscapes may drive changes in either of these characteristics. Previous longitudinal studies (e.g. Perry & Sibley, 2012; Schwarz et al., 2010; Sibley & Duckitt, 2013) have tended to focus on associations between personality constructs and the left–right dimension, while ignoring more fine–grained ideological cleavages and extraneous factors other than demographics that might shape party choice.
Longitudinal studies can also help us to situate political orientations within a broader personality framework that encompasses both worldview characteristics and traditional personality traits (Nilsson, 2014b). Personality traits, such as the Big Five and the HEXACO traits, are often modelled as antecedents of ideological worldviews (e.g. Caprara et al., 2006; Duckitt, 2001; Leone, Desimoni, & Chirumbolo, 2012). Even though longitudinal studies have provided more consistent evidence for effects of personality traits on political preferences and other aspects of worldviews than for effects in the opposite directions (Ekstrom & Federico, 2019; Perry & Sibley, 2012; Sibley & Duckitt, 2013), genetically informative studies have suggested that most of the associations between personality traits and political preferences may be due to common genetic influences (Hatemi & Verhulst, 2015; Kandler, Bell, Shikishima, Yamagata, & Riemann, 2015). Further studies with genetically informative longitudinal designs and fine–grained measures of personality traits, beliefs, values, and preferences are needed to provide a more complete picture of the role of genetic and environmental factors, as well causal processes within the personality system, in shaping political orientations.
Yet another limitation of this research is that it focused on one single country. It is quite possible that associations between personality and party preferences are affected by the role of different parties within a specific political system. It is possible, for instance, that the radical left parties were supported by participants in our studies who were highly open to change because they have a history of being in political opposition and not because of their system–critical ideologies per se. Cross–cultural research is needed to disentangle ideological content from factors related to the political system. Past cross–cultural studies (Aspelund et al., 2013; Lee et al., 2018; Piurko et al., 2011; Saucier et al., 2015; Schwartz et al., 2014) have focused almost exclusively on the left–right dimension. Future research should investigate how the diverse ideological cleavages that emerge between political parties in different societies and systems map onto the personalities of voters across the world.
Conclusion
The findings of this research programme show that personality variation within the ideological domain in the North–European multi–party welfare state of Sweden cannot be reduced to a single divide between leftists and rightists, let alone between ‘liberals’ and ‘conservatives’. They demonstrate differences between progressive and non–progressive leftists (such as social democrats), economic and green progressives, social liberal and social conservative rightists, and nationalist and non–nationalist conservatives (such as Christian democrats). The political preferences, moral intuitions, political values, and broader worldviews of these groups were congruent with the political ideologies of their preferred parties, occupying different positions on at least three distinct ideological dimensions: economic ideology (equality and redistribution), social ideology (tradition and social change), and GAL–TAN ideology (ecology, cultural diversity, and nationalism). Future research on the structure, development, and consequences of political orientations should take these complexities into consideration. Above all, the simplistic contrast between ‘liberals’ and ‘conservatives’ should be replaced with a richer conceptualization of the attraction between personalities and political ideologies.
Funding
The data collection for Study 2 was funded by a grant to Daniel Västfjäll (a collaborator from Linköping University) from the Swedish Research Council (Vetenskapsrådet; project ID: 2014–01158). The data collection for Study 3 was funded by a grant to Maria Sandgren from the Foundation for Baltic and East European Studies (project ID: A056–2012).
Author Contributions
Artur Nilsson conceptualized, wrote, and revised the paper and ran all the analyses. The rest of the authors were involved in study designs, administration, and data collection, and they provided feedback and suggestions on how to improve the article. Artur Nilsson led Study 1. Arvid Erlandsson led Study 2. Henry Montgomery, Girts Dimdins, and Maria Sandgren led Study 3.
Open Practices Disclosure Form
Open Practices Disclosure Form, PER2249_Open_Practices_Disclosure_Form - Beyond ‘Liberals’ and ‘Conservatives’: Complexity in Ideology, Moral Intuitions, and Worldview among Swedish Voters
Open Practices Disclosure Form, PER2249_Open_Practices_Disclosure_Form for Beyond ‘Liberals’ and ‘Conservatives’: Complexity in Ideology, Moral Intuitions, and Worldview among Swedish Voters by Nilsson Artur, Montgomery Henry, Dimdins Girts, Sandgren Maria, Erlandsson Arvid and Taleny Adrian in European Journal of Personality
Footnotes
Supporting Information
Additional supporting information may be found online in the Supporting Information section at the end of the article.
Notes
References
Supplementary Material
Please find the following supplemental material available below.
For Open Access articles published under a Creative Commons License, all supplemental material carries the same license as the article it is associated with.
For non-Open Access articles published, all supplemental material carries a non-exclusive license, and permission requests for re-use of supplemental material or any part of supplemental material shall be sent directly to the copyright owner as specified in the copyright notice associated with the article.